Dual color dynamic anti counterfeiting labels with persistent emission after visible excitation allowing smartphone authentication
←
→
Page content transcription
If your browser does not render page correctly, please read the page content below
www.nature.com/scientificreports
OPEN Dual‑color dynamic
anti‑counterfeiting labels
with persistent emission
after visible excitation allowing
smartphone authentication
Ngei Katumo1*, Kai Li1, Bryce S. Richards 1,2
& Ian A. Howard 1,2*
A significant impediment to the deployment of anti-counterfeiting technologies is the reliance
on specialized hardware. Here, anti-counterfeiting labels are developed that are both excited and
detected using a smartphone. The persistent luminescence pattern and color changes on the timescale
of hundreds of milliseconds to seconds. The labels can be authenticated by comparing still images
from the red and green channels of video acquired at known times after flashlight excitation against
expected reference patterns. The labels are based on a green-emitting SrAl2O4: Eu2+,Dy3+ (SAED),
and red-emitting CaS:Eu2+ phosphors whose lifetimes are varied: (i) for SAED from 0.5 to 11.7 s by
annealing the commercial material in air; and (ii) CaS:Eu2+ from 0.1 to 0.6 s by varying the dopant
concentration. Examples of anti-counterfeiting labels exhibiting changing emission patterns and
colors on a seven-segment display, barcode, and emoji are demonstrated. These results demonstrate
that phosphors with visible absorption and tunable persistent luminescence lifetimes on the order of
hundreds of milliseconds to seconds are attractive for anti-counterfeiting applications as they allow
authentication to be performed using only a smartphone. Further development should allow richer
color shifts and enhancement of security by embedding further covert anti-counterfeiting features.
Counterfeiting is increasing globally, with the projected financial losses to the global economy projected to hit
USD 4.7 trillion in 2022 and at the cost of 5 million legitimate j obs1. In addition to the economic consequences,
counterfeiting poses major risks to human health and national security. Therefore, there is significant interest
in developing anti-counterfeiting technologies. Currently, research into anti-counterfeiting technologies can be
categorized into two major classes. Firstly, there is a significant effort on the development of unique unclonable
labels, also known as physical unclonable functions2–5. These labels should provide the highest level of security.
Each label is unique due to a stochastic process in manufacturing, and in practice unclonable, as other manu-
facturing methods are similarly limited by such stochastic processes and cannot accurately reproduce a given
label. Thus, a unique and unclonable label can be attached (in an unremovable fashion) to each product to make
duplication impossible. However, there are significant overheads associated with the implementation of such
a solution, as each unique label must be characterized and stored in a database to allow authentication5. The
characterization and storage of information for a large number of unique labels takes time and comes at a cost.
Naturally, the losses incurred by manufacturers will need to exceed a certain “pain” threshold before unique
unclonable labels will be considered to be adopted as the preferred solution.
The second class of anti-counterfeiting technologies are based on interchangeable labels that are less secure,
but are easily implementable, thus representing a lower threshold option. In this direction, interchangeable
anti-counterfeiting labels are created with designed overt and covert features that are the same for each label of
a given design. In comparison to the unique labels, the costs and time associated with characterizing every label
are removed, as each label has the same anti-counterfeiting features that can be communicated to the end-users
for authentication (note that the end-users are trusted, as they wish to honestly assess the authenticity of the
product in question). However, given enough effort and time to access the unique materials or manufacturing
1
Institute of Microstructure Technology, Karlsruhe Institute of Technology, Hermann‑von‑Helmholtz‑Platz 1,
76344 Eggenstein‑Leopoldshafen, Germany. 2Light Technology Institute, Karlsruhe Institute of Technology,
Engesserstrasse 13, 76131 Karlsruhe, Germany. *email: ngei.katumo@kit.edu; ian.howard@kit.edu
Scientific Reports | (2022) 12:2100 | https://doi.org/10.1038/s41598-022-05885-6 1
Vol.:(0123456789)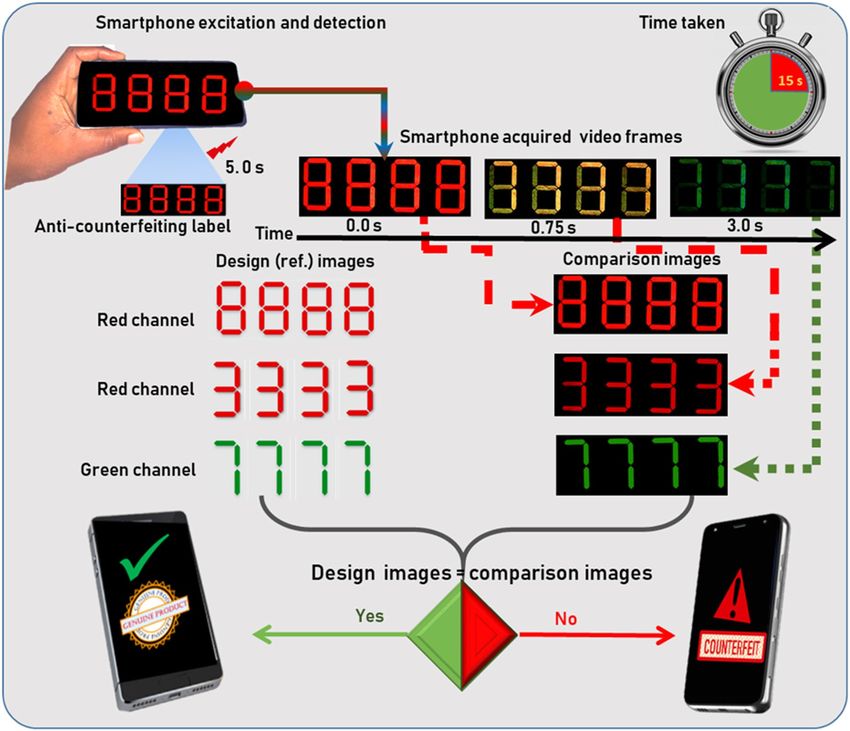
www.nature.com/scientificreports/
processes, these labels could be forged by counterfeiters. Examples of the features found in the interchangeable
anti-counterfeiting labels are watermarks, printed structures, security threads, holograms, two-dimensional
codes, and luminescent markers already in common usage for security such as in banknotes, identity cards, and
product brands6,7. In this paper, the focus is on interchangeable anti-counterfeiting labels, which utilize covert
and overt features offered by persistent luminescence markers that are excitable and detectable using a single
smartphone—with no other hardware being necessary (e.g. optical filters or lenses).
Luminescence-based anti-counterfeiting tags can be further classified into single-level, double-level, and
multilevel according to the level of security provided by the tags7. Examples of these are summarized here,
but the interested reader is also directed to a recent review by Yu and c oworkers7. Single-level luminescence
anti-counterfeiting tags display the anti-counterfeiting features directly after being stimulated by the appro-
priate stimuli such as ultraviolet (UV) light or chemical stimuli. These features are usually observable pat-
terns in the anti-counterfeiting label. This level is widely used in certificates and currencies, although relatively
susceptible to counterfeit r eproduction7. The single-level luminescence anti-counterfeiting can use down-
shifting (DS) p hotoluminescence8,9 up-conversion (UC) p hotoluminescence10–12, chemiluminescence13, or
14–16
mechanoluminescence features of phosphor materials. Dual-level luminescence-based anti-counterfeiting
tags extend upon the single-level tags in that the observable covert and overt features are parameterized and
quantified in terms of both the stimuli and the observed stimuli responses. The double level modes are realized
through either regulating the excitation source17–19 or co-regulating the excitation source with other parameters
such as the luminescence lifetime18, along with thermal17, mechanical and chemical response of the labels7. The
examples involving regulation of the excitation sources include dual-mode excitation leading to controllable
multiple photoluminescence (PL) emission via either UC, DS, or a combination of both. The subsequent co-reg-
ulation involves exploiting the other optical responses of the phosphor with respect to diversified excitation and
stimulation sources. A broader discussion on the exploitation of the luminescence lifetime feature is provided in
the following section as it is the focus of this paper. Finally, multi-level anti-counterfeiting labels are labels whose
covert feature authentication affords more than two dimensions of security7. For example Sun et al. demonstrated
multi-mode anti-counterfeiting nano-taggants based on Yb3+-, Nd3+-, and Ce3+-sensitized NaY(Gd)F4 nanopar-
ticles, which displayed different colors when the excitation wavelength was c hanged19. The observed emitted
color (red, blue, and/or green) was dependent on the excitation wavelength which was either 980 nm, 808 nm,
and 254 nm19. Other approaches to realize multi-level anti-counterfeiting include power-dependent excitation
leading to diversified emission s ignals20, and PL lifetimes from the multiple excitation sources of the labels21.
The discussion is now focused on double-level anti-counterfeiting labels that, beyond the simple presence of
luminescence, utilize the PL lifetime—in this case the persistent luminescence lifetime—to add a further feature
to the labels and improve their anti-counterfeiting security. For example, early work on utilizing PL lifetime in
an anti-counterfeiting capacity included forensic work comparing legitimate and counterfeit U.S. dollar bills in
terms of the sub-nanosecond PL lifetime of the paper after UV excitation using time-correlated single-photon
counting (TCSPC)22. Although it was demonstrated that legitimate bills had different lifetimes to fake bills, the
cost of the required TCSPC apparatus makes it impractical for widespread application. The lifetime of specific
fluorescence materials can also be used for anti-counterfeiting. For example, Kalytchuk et al. utilized two different
sets of carbon dots with fluorescence lifetimes of 4.4 ns and 6.1 ns respectively after 365 nm UV light excitation
to demonstrate anti-counterfeiting tags wherein hidden patterns are revealed by fluorescence lifetime imaging
(FLI)23. These are very interesting anti-counterfeiting inks, but to image the lifetime on these short time scales
expensive hardware and TCSPC is necessary. Lu et al. employed luminescent nanocrystals to develop phosphors
with emission lifetimes in the 26–662 µs range usable for multi-level anti-counterfeiting and optical coding24.
Although this presented a significant step to longer lifetimes use in anti-counterfeiting, either a scanning single
pixel fast detector or an expensive high-speed camera is still required to detect patterns.
The bulky and expensive equipment needed to image of such nano- to micro-second lifetimes can be avoided
by shifting the lifetimes of the labels to the 100 ms to 10 s r ange25. The upper limit on lifetime here is imposed to
allow sufficiently rapid authentication, limiting the charging time and video recording time such that authentica-
tion can be completed within around 15–20 s. Such extension in the PL lifetime would allow the use of a video
captured with a standard camera, such as those in smartphones, to characterize the lifetimes and provide a series
of images at different lifetimes25–27. Several phosphors exhibiting persistent color change have been explored, but,
to date, tailoring lifetimes to create a materials palette optimized for smartphone excitation and detection has
not been demonstrated. The work by Liu et al. demonstrated the use of ultra-long lifetimes (up to 350 ms) using
carbon dots in zeolite matrices with a photoluminescence quantum yield (PLQY) of up to 52% allowing post UV
excitation observation with the naked eye18. The authors’ previous work advanced on this approach by develop-
ing smartphone-camera-readable dynamic anti-counterfeiting labels based on Gd2O2S: Eu3+/Ti4+ phosphor26.
Dynamic patterns were realized via the T i4+ co-doping that allowed the persistent lifetime to be tuned from 1.2
to 5.6 s26. However, for these labels, a UV light source was required for exciting the labels before video-recording
the emission for subsequent PL-lifetime analysis. In this paper, the use of the smartphone is extended to allow
both the excitation and detection of dynamic and color-tunable anti-counterfeiting labels.
Anti-counterfeiting systems that can rely solely on the use of smartphones as that hardware component in
an authentication strategy are attractive and convenient as smartphones are ubiquitous5,25–29. However, such
systems would need to meet several requirements to permit the reliance on only a smartphone being used and
no additional hardware being required for the complete authentication process. The first requirement is that
the phosphor material used in the anti-counterfeiting label should sufficiently absorb in the visible region (the
smartphone flashlight has a 450 nm peak and a broad visible region extending up to 750 nm). Secondly, there
should be sufficient emission from the excited anti-counterfeiting material that can be detected with the smart-
phone camera in a darkened environment. Thirdly, to achieve a dynamic shift in the emission pattern of the
anti-counterfeiting labels should contain phosphors with varied persistent lifetimes as already demonstrated in
Scientific Reports | (2022) 12:2100 | https://doi.org/10.1038/s41598-022-05885-6 2
Vol:.(1234567890)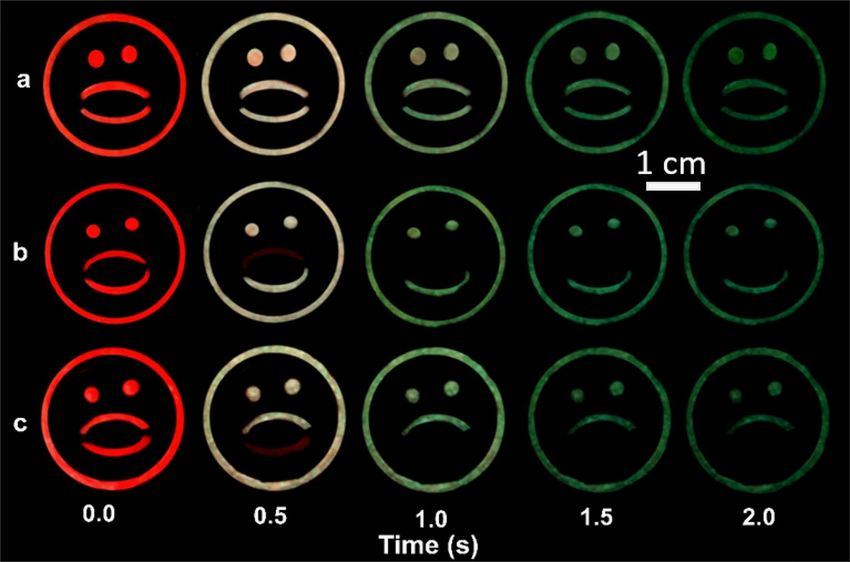
www.nature.com/scientificreports/
Figure 1. Schematic illustration of smartphone-based authentication of dynamic and color tunable anti-
counterfeiting labels. The label is first irradiated with the smartphone-flashlight for 5 s and then the persistent
emission is video-recorded with the smartphone’s camera. The acquired raw video is then split at into the
red and green channel and the frames at various timestamps (for red 0.0 and 0.75 s and for green 3.0 s) are
compared to the intended design images. If the images of the split frames match with the designed image the
product is genuine, else counterfeit. The total time taken is less than 15 s.
the authors’ previous w ork26. Finally, to achieve a shift in color in the dynamic pattern, a blend of two or more
phosphors with different emission spectra is required.
The smartphone-only authentication process would then proceed as illustrated in Fig. 1. The process starts
with the smartphone video-recording turned on, followed by a 5 s flashlight illumination and continuous capture
of the emission for a further 10 s. In this case, a seven-segment display is targeted that should have the following
characteristics. During illumination with the smartphone flashlight, a ‘8 8 8 8’ should be observed when the
red channel of a still frame of the smartphone video is considered. At 0.3 s after the flashlight is extinguished a
‘3 3 3 3’ should be observed in the red channel of the still frame extracted from the video. Finally, 3 s after excita-
tion ‘7 7 7 7’ should be observed in the green channel. If analysis of stills extracted from the smartphone video
confirms these expectations, then the label can be deemed authentic.
Herein, dual-color dynamic anti-counterfeiting patterns are realized using blends of green-emitting strontium
aluminate doped with europium and dysprosium (Sr0.95 Al2 O4 :Eu2+ 0.02 , Dy0.003 abbreviated as SAED) and red-
3+
emitting europium doped calcium sulfide (CaS:Eu2+) and strontium sulfide (SrS:Eu2+). For the green-emitting
SAED phosphor, the E u2+ ion acts as the emitting center. Oxygen vacancies and D y3+ dopants act as electron-
trapping centers after photoexcitation and the gradual thermal release of electrons from these traps is responsible
for the persistent luminescence30,31. The SAED phosphor was annealed in air at various temperatures to reduce
its persistent lifetime, tailoring it appropriately for the present anti-counterfeiting a pplication32. The SAED phos-
phors are labeled according to the annealing temperature used (units of °C), for example, phosphors annealed at
700 °C,800 °C, 810 °C and 820 °C are named SAED (700), SAED (800), SAED(810) and SAED (820), respectively.
The reference commercial phosphor was named SAED (Ref.). For the red phosphors, the persistent luminescence
lifetime of the synthesized Ca1−x S:Eu2+ x and Sr1−x S:Eux could be varied from 120 to 600 ms by controlling the
2+
Scientific Reports | (2022) 12:2100 | https://doi.org/10.1038/s41598-022-05885-6 3
Vol.:(0123456789)
www.nature.com/scientificreports/
u2+ doping from 0.0005 to 0.015 mol. These phosphors are also extensively studied owing to their good optical
E
characteristics viable for applications in bio-imaging33, displays34, persistent e mission35 and white-light-emitting
diodes36,37. Exciting the broad charge-transfer absorption band with blue light leads to a deep-red emission peak
centered at 650 nm and 610 nm for CaS:Eu2+ and SrS:Eu2+, respectively35,38. Importantly, Shi et al. have studied
the persistent luminescence of SAED, and C aSrS3:Eu2+ (alongside C aAl2O4:Eu2+) and demonstrated excellent
properties of these trichromic phosphors for anti-counterfeiting, including color shifts in persistent emission
on the timescale of tens of seconds after UV e xcitation39. This is used as a launching point to demonstrate and
quantify how persistent lifetimes and color changes can be controlled on the sub-second scale after excitation with
a smartphone flashlight in a series of materials based on these hosts, and how the video shot by the same smart-
phone’s camera can be used to authenticate anti-counterfeiting labels based on the developed material palette.
Results and discussion
To achieve labels such as those shown in Fig. 1, a key requirement is to use persistent phosphors that are excit-
able by the smartphone flashlight and have the emission in the visible region. The optical properties of the
dynamic anti-counterfeiting phosphor materials demonstrating satisfaction of smartphone flashlight excitation,
emission detection, and the material’s varied PL lifetimes are illustrated in Fig. 2. In Fig. 2a smartphone-video-
recorded persistent decay frames are displayed of Ca0.999 S:Eu2+ 0.001, Ca0.994 S:Eu0.006 Ca0.985 S:Eu0.015 SAED (810),
2+ 2+
SAED (830), and SAED (850) following smartphone flashlight excitation. For the red-emitting phosphor, the
initial emission at time zero is uniformly bright (due to the high PLQY as later demonstrated), but the subsequent
frames demonstrate the varied persistent lifetimes that decrease with the increase in E u2+ doping. It is clear from
the frames that the Ca0.999 S: Eu2+ 0.001 exhibits a longer red persistent luminescence decay that is observable up
to 2 s, whereas the Ca0.985 S: Eu2+0.015 exhibits a very short persistent luminescence decay observable up to only
0.25 s post excitation. The effect of annealing the SAED phosphors in the air is also clearly demonstrated fol-
lowing the smartphone flashlight excitation. Notice that the initial intensity of SAED (810) and SAED (830) at
time zero are higher compared to SAED (850) and that the persistent luminescence decrease with an increase
in the annealing temperature.
Fundamentally, to excite the phosphors with the smartphone flashlight, the absorption (PL excitation) spectra
of the phosphors must coincide with the flashlight spectra. Most smartphone flashlights are based on an indium
gallium nitride light-emitting diode (LED), with an emission peak at 450 nm40. Some of the blue light is converted
to longer wavelengths by phosphors in the coating of the LED which leads to the observed white light color. An
exemplary spectrum of a smartphone-flashlight obtained using a spectrometer (Thorlabs CCS200) coupled with
an optical fiber of 1 mm diameter (Thorlabs FP100URT) is shown in Fig. 2b,c. The excitation spectra coincide
with the absorption tail of the SAED phosphors (monitored at 514 nm) that extends from 250 to 450 nm due
to 4f7–4f65d1 transition of Eu2+ ion41, as displayed in Fig. 2b. Exciting the absorption band with the smartphone
flashlight leads to the observed green broadband emission centered at 514 nm due to 4 f7–4f65d1 transition of E u2+.
Unlike the SAED phosphor, where smartphone-flashlight excitation is absorbed only by the tail of the absorption
spectra, the CaS:Eu2+ phosphor PL excitation spectra (monitored at peak emission of 650 nm) extends up to
600 nm, effectively coinciding with the smartphone-flashlight spectra as plotted in Fig. 2c. Smartphone excita-
tion of this absorption band leads to the observed red broadband emission centered at 650 nm. Similar data for
the Sr1−x S: Eu2+x phosphor, also showing a visible broadband absorption extending up to 575 nm (monitored at
614 nm) for which smartphone-flashlight excitation leads to a broadband E u2+ emission centered at 614 nm is
shown in Supplementary Fig. S1.
2+
Note that while the three phosphors (SAED, Sr1−x S:Eu2+ x and Ca1−x S:Eux ) have Eu ion as the emitter,
2+
different PL excitation and emission spectra are realized since the 4 f ( S7/2) → 4f 5d transition of the E
7 8 6 1
u2+ emit-
ter is strongly affected by the crystal field strength and host material42,43. The x-ray patterns showing that the
phosphors were polycrystalline are also provided in Supplementary Figs. S2–S4 of the supporting information.
The refiring in air did not lead to significant structural changes in the SAED. The increasing concentration of
Eu2+ in CaS does lead to a slight expansion of the lattice noticeable in the XRD data (Fig. S3) as expected for the
significant increase in ionic radius of six coordinated Eu2+ (1.17 Å) versus C a2+ (1.00 Å). This is not so for the
2+ 2+
Sr case whose 1.18 Å ionic radius that matches much better with the Eu substitute. Further discussion is with
the data in the supplementary information. The scanning electron microscope images showing large-grained,
highly agglomerated, and non-uniform microstructures of the SAED, Sr1−x S:Eu2+ x and Ca1−x S:Eux ) are given
2+
in Supplementary Fig. S5.
The steady state PLQY and persistent luminescence of the SAED phosphors and the SAED phosphors were
greatly affected by the annealing step as shown in Fig. 2d. The PLQY of the phosphors was determined according
to the de Mello method44, following the phosphor excitation with a 450 nm LED in an integrating sphere that was
fiber-coupled with a spectrometer. The persistent lifetime of the various phosphors was determined according
to the procedure outlined in Supplementary Fig. S6. In brief, the persistent lifetime was determined by fitting a
region of interest, t1–t2, in the persistent decay curves of the phosphors. The initial fitting point t1 was globally
set at 0.2 s while t2 is the time at which the lifetime extracted from the persistent PL emission video decays to
90%. The phosphors annealed below 830 °C were fitted with a double exponential fit while those annealed above
830 °C together with the red-emitting Ca1−x S:Eu2+ x and Sr1−x S:Eux phosphors fitted with a single exponential
2+
as given in following equation:
2
I = Io + Ai exp(−t/τi ) (1)
i=1
where τi are the characteristic lifetimes, Ai are their respective coefficients and Io is an offset. The average per-
sistent lifetime τ was estimated using:
Scientific Reports | (2022) 12:2100 | https://doi.org/10.1038/s41598-022-05885-6 4
Vol:.(1234567890)
www.nature.com/scientificreports/
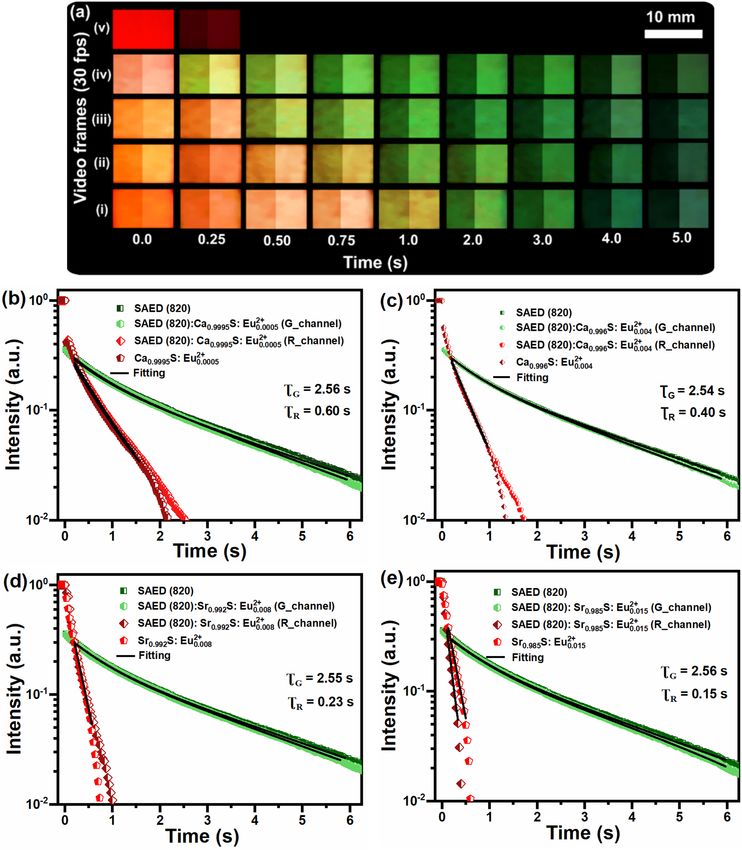
Figure 2. Photoluminescence (PL) properties of the persistent phosphors. (a) Video still frames at indicated
times after smartphone video excitation is stopped for red phosphors (Ca0.999 S:Eu2+ 0.001, Ca0.994 S:Eu0.006 and
2+
Ca0.985 S:Eu2+
0.015) and green phosphors (SAED (810), SAED (830) and SAED (850)) visually demonstrating the
change in persistent lifetime. (b) The PL excitation spectrum (monitored at 514 nm) of SAED (Ref.) alongside
the emission spectrum of a smartphone-flashlight (Smph.ex.) (Black line) and the PL emission spectra after
smartphone excitation. The small overlap of the smartphone excitation with the absorption is just sufficient to
allow smartphone excitation. (c) The PL excitation spectrum (monitored at 640 nm) of CaS:Eu2+ alongside its
PL emission spectrum and that of a smartphone-flashlight. The substantial overlap in the phosphor absorption
and smartphone-flashlight means that it is efficiently excited. The insets in (b,c) show the phosphor emissions
after the smartphone excitation. (d) The steady state PL quantum yield (PLQY) following 450 nm excitation
and persistent lifetime values of SAED samples that are annealed in air for 1 h. (e) The steady state PLQY and
persistent lifetime values of Ca1−x S:Eu2+
x samples for 0.0005 ≤ x ≤ 0.015 mol after 450 nm LED excitation.
Scientific Reports | (2022) 12:2100 | https://doi.org/10.1038/s41598-022-05885-6 5
Vol.:(0123456789)
www.nature.com/scientificreports/
2 2
τ= Ai × τi2 / Ai × τi (2)
i=1 i=1
The SAED (Ref.), SAED (700), SAED (800), SAED (810), and SAED (820) green-emitting phosphors reg-
istered PLQYs above 11 ± 0.5% while the persistent lifetime decreased from 11.7 s to 2.6 s for SAED (Ref.) and
SAED (830) respectively. The annealing step in the air gradually decreased the persistent lifetime, with the
SAED (860) phosphor recording a persistent lifetime of 0.5 s and a low PLQY of 2%. The SAED phosphors
annealed at 840 °C or greater exhibited a PLQY below 6% and their initial emission intensities were weak (see
Fig. 2a SAED (850)). For this reason, they were deemed infeasible for the development of dual-color dynamic
anti-counterfeiting labels as later demonstrated. Nevertheless, the SAED annealed at up to 830 °C created a
series of green-emitting persistent phosphors with a varying lifetime that is sufficient for the demonstration of
dynamic and color-tunable anti-counterfeiting labels authenticatable using a smartphone. The mechanism for
the gradual decrease in both persistent luminescence and PLQY after reannealing above 820 °C is considered in
the following way. After 450 nm excitation, the persistent emission in SAED is proposed to be from a subset of
the substituted Sr sites that can be influenced by nearby Dy3+45,46. Also, in the absence of Dy3+, the oxygen vacan-
cies in the S rAl2O4 create electron traps that are proposed to contribute to the persistent e mission45. Although
the precise understanding of all the various causes of persistent luminescence in SAED is still being refined46,47,
given the concurrent reduction of the persistent lifetime and intensity of emission we postulate that a reduction
of the oxygen vacancies could lead to reduced trap density and depth, and the reduction in intensity might be
related to the previously observed oxidation of the radiative Eu2+ to an inactive Eu3+ ion in the host32,48. One other
possibility is that E u3+ could help funnel energy towards NIR emission from the D y3+49, but this is ruled out by
the observation that the NIR intensity decreases after reannealing (Fig. S7). In addition, the annealing in the air
led to the narrowing of the SAED absorption bands as illustrated in Supplementary Fig. S8, however, neither a
shift in emission spectra nor any new peaks were observed. Further work is warranted to realize green-emitting
persistent phosphors with both high PLQY and strong absorption in the 450 nm region.
The persistent luminescence lifetime and PLQY behavior of the red-emitting phosphor Ca1−x S: Eu2+ x for
(x = 0.0005–0.015 mol) is presented in Fig. 2e. The PLQY first increased gradually with E u2+ doping from 32 ± 1%
for Ca0.9995 S:Eu2+0.0005 up to 39 ± 1% for Ca0.998 S:Eu0.002 . Further doping led to a decline of the PLQY with the
2+
2+
0.015Eu doped CaS phosphor registering a PLQY of 18 ± 1%. While the PLQY exhibited a maximum at a
concentration of 0.002 mol of Eu2+ ions, the persistent lifetime monotonically decreased with an increase in
Eu2+ doping from 590 ms for Ca0.9995 S:Eu2+ 0.0005 to 125 ms for Ca0.985 S:Eu0.015 (see Fig. 2e). Again, the persistent
2+
lifetime was established via a single exponential fit to Eq. (1), in the fitting region defined by t1—t2 shown in
Supplementary Fig. S6. Similarly, in SrS: E u2+, the PLQY remains relatively constant at 37 ± 2% for doping con-
centrations below 0.008 mol of Eu2+ doping but slightly decreases with further doping to 28 ± 1% for 0.015 mol
Eu2+ doping. In the same doping regime, the delayed persistent luminescence lifetimes reduce from 377 to 150 ms
for Sr0.999 S:Eu2+0.001 and Sr0.985 S:Eu0.015 respectively as shown in Supplementary Fig. S9. The persistent lifetime
2+
2+
plots of SAED and CaS:Eu phosphors are also presented in Supplementary Figs. S10 and S11 respectively and
the persistent lifetime data in Supplementary Table S1.
Although a fully conclusive analysis of the mechanism leading to the change in persistent emission lifetime
with Eu2+ concentration in CaS is beyond the scope of the current work, the first hypothesis to consider is that
either (or both) the radiative or (and) the non-radiative channel for the trapped states that lead to the persistent
emission are affected by the Eu2+ concentration. The rate of the radiative channel for the persistent emission
depends on the activation energy required for the trapped state to be stimulated back to an emissive center.
Therefore, if there were a change in this radiative mechanism (i.e., a change in the trap depth) caused by the E u2+
concentration, then this could be measured in the dependence of the persistent emission lifetime on tempera-
ture. The activation energy for the persistent emission is estimated by fitting the temperature dependence of the
persistent emission lifetime for Ca0.999 S : Eu2+ 0.001, Ca 0.996 S : Eu0.004 and Ca 0.992 S : Eu0.008 between 230 and 450 K
2+ 2+
to a simple Arrhenius form (Figure S12). The activation energy so estimated does not significantly change with
the sample series. The activation energy remains small (between 0.05 and 0.1 eV) and constant over the E u2+
concentrations, suggesting that a changing trap depth based on the E u2+ concentration is not responsible for the
observed persistent lifetime tuning. This leaves the hypothesis that the non-radiative deactivation of the trapped
states becomes faster with increasing E u2+ concentration. This is consistent with the decrease in PLQY at the
higher Eu2+ concentrations (Fig. 1e) and the temperature dependence of the integrated PL intensity (Fig. S13).
Irrespective of the precise mechanism of the persistent lifetime tuning, it is certainly adequate for the presented
application.
Color-tunability of the persistent emission with time was realized by physically blending the SAED:CaS:Eu2+
and SAED:SrS:Eu2+ phosphors leading to the realization of red to green emission transition post excita-
tion as shown Fig. 3a. These blended phosphors are composed of SAED (820):Ca0.9995 S:Eu2+ 0.0005 for (i),
SAED (820):Ca0.994 S:Eu2+ 0.006 for (ii), SAED (820): Sr 0.992 S:Eu2+
0.008 for (iii) and SAED (820): Sr0.985 0.015 for
S:Eu2+
(iv) at a ratio of 95:5 wt% of SAED to the red phosphors. Notice that half of these images are partially saturated
for color clarity. The blending ratio of 95:5 wt.% is selected to balance the emission from the CaS and SAED to
red provide a gradual transition from red to green (see Fig. S14 for examples of the transition at other ratios).
The red to green transition time is dictated by the red phosphor blended with SAED (820). The longer the red
persistent lifetime the longer the red to green transition takes and vice-versa. Only the red to green transition
could be realized as the initial emission intensity and steady-state PLQY is higher for all the red phosphors com-
pared to the SAED phosphors. For the SAED (820):Ca0.9995 S:Eu2+ 0.0005 blend, the emission remains red beyond
0.75 s before the transition to yellowish color at 1 s and finally to green. The shortest red phosphor blend,
SAED (820):Sr0.985 S:Eu2+ 0.015 on the other hand only shows a prompt red immediately after excitation which then
transitions to yellow (green and red) at 0.25 s and finally a dominant green at 0.75 s. A failed color-transition is
Scientific Reports | (2022) 12:2100 | https://doi.org/10.1038/s41598-022-05885-6 6
Vol:.(1234567890)www.nature.com/scientificreports/
Figure 3. Tuning change of emission color and persistent lifetime of blended phosphors. (a) Illustration
of color tuning with time using blends of different red and green persistent phosphors. The left half of
each image shows the raw video frame (change in color and intensity), the right half highlights the color
change only by normalizing to a constant intensity. The compositions are: (i) SAED (820):Ca0.9995 S:Eu2+ 0.0005
(ii) SAED (820):Ca0.996 S:Eu2+
0.004 (iii) SAED (820): Sr0.992 S:Eu0.008 and (iv) SAED (820):Sr0.985 S: Eu0.015 at
2+ 2+
95:5 wt.%. The longer the persistent lifetime of the red phosphor the longer the transition takes and vice-
versa. The extracted red and green channels persistent lifetime of phosphors: (b) SAED (820):Ca0.9995 S:Eu2+ 0.0005,
(c) SAED (820):Ca0.996 S:Eu2+
0.004, (d) SAED (820):Sr0.992 S:Eu0.008 and (e) SAED (820):Sr0.985 S:Eu0.015 alongside
2+ 2+
the pure phosphors.
Scientific Reports | (2022) 12:2100 | https://doi.org/10.1038/s41598-022-05885-6 7
Vol.:(0123456789)www.nature.com/scientificreports/
Figure 4. Demonstration of color and pattern changing persistent luminescence anti-counterfeiting labels
following smartphone excitation. (a) Schematic representation detailing the phosphors placed in each of the
7-segment display. (b) Smartphone acquired video frames of interest for four digits of the 7-segment display
described in (a) after 5 s excitation with smartphone-flashlight. The raw video frames are then split in to the red
and green channels. The raw video transitions from ‘8 8 8 8’ in red, to a yellowish (red and green) ‘3 3 3 3’ and
finally to a green ‘7 7 7 7’ at 0.5 s and beyond 1 s respectively. Exploring the red channels reveals that the initial
‘8 8 8 8’ in red, transitions to a ‘3 3 3 3’ and finally to a red ‘7 7 7 7’ at 0.5 s and beyond 1 s respectively. The first
and second transition is due to exhaustion of majority of the red emission emanating from Sr0.985 S:Eu2+ 0.015 and
Ca0.994 S:Eu2+0.006 in segments ①—② and ③—④ respectively. This is different from the green channel transition
where the initial red-channel-concealed ‘8 8 8 8’ transitions directly to a green ‘7 7 7 7’ at 0.5 s as the segments
①—④ contained on SAED (830) and ⑤—⑦ has SAED (820).
also demonstrated using SAED (850):Ca0.985 S:Eu2+ 0.015 for (v) for which the green emission could not be realized.
Note that the SAED (850) had an initial weak emission (see Fig. 2a) as well as being weakly absorbing.
The encoding capacity was expanded by further extracting the color-specific (red and green) persistent
lifetimes of the phosphors as illustrated in Fig. 3b–e. The green emission from SAED (820) phosphor regis-
tered a persistent lifetime of 2.55 ± 0.01 s across all the four samples, a value representing a 2.3% decline in
the average persistent lifetime registered by pure SAED (820) due to re-absorption. On the other hand, the
persistent lifetime of the red-emitting phosphors registered persistent lifetimes of 0.60 s, 0.40 s, 0.27 s, and
0.16 s representing 2%, 4%, 4.5% and 7% persistent lifetime increase for Ca0.9995 S:Eu2+ 0.0005 , Ca0.996 S:Eu0.004 ,
2+
Sr0.992 S:Eu2+
0.008 , Sr0.985 S:Eu2+
0.015 respectively. The red-emitting phosphors with the long persistent lifetime had
the least enhancement while the shortest had the largest. The persistent lifetime of the blends is presented in
Supplementary Table S2.
The increase in the registered persistent lifetime of the red-emitting phosphors is small enough that it does
not pose a problem to designing the color change of labels with the lifetimes expected from the pure material.
One explanation of the slightly enhanced persistent lifetime is some limited reabsorption of SAED emission
by the CaS:Eu2+ and SrS:Eu2+ as their absorption band coincides with the SAED emission. The amount of this
reabsorption will depend on the precise distribution of phosphors in the labels, with slight spatial separation of
the phosphors instead of the intimate mixing presented herein being advantageous to minimize reabsorption.
Nonetheless, the data presented in Fig. 3 (and subsequently) demonstrates that even in this case reabsorption is
minor and that the persistent lifetimes of the red and green emission in blended materials remain close to the
lifetimes of the pure red and green materials.
To demonstrate dynamic and color-tunable anti-counterfeiting phosphors, labels were developed by embed-
ding the blended phosphors in a four-digit seven-segment display as shown in Fig. 4a. Each of the 7-segments
of a digit contained 0.040 ± 0.005 g. The dynamic and color-tunable label following smartphone excitation is
illustrated by the extracted video frames (raw) at the various timestamps together with the coinciding red and
green channel frames obtained by splitting the original raw frames as shown in Fig. 4b. Immediately after the
smartphone flashlight is turned off, the four digits display ‘8 8 8 8’ in red. From the raw video, it’s imperative to
say that the pattern then changes to a yellowish ‘3 3 3 3’ display at 0.5 s after which it changes again to a green
Scientific Reports | (2022) 12:2100 | https://doi.org/10.1038/s41598-022-05885-6 8
Vol:.(1234567890)www.nature.com/scientificreports/
Figure 5. A multi-color-tunable 15-line dynamic barcode registering different dynamic codes following
evaluation of the red and green channel of the emission. From left to right the raw barcode lines have the
following samples SAED (850) in line 11, SAED (840) in line 3, SAED (830) lines 6, 8 and 14, Ca0.999 S:Eu2+ 0.001
(lines 9), Ca0.996 S:Eu2+
0.004, (lines 2 and 12), Ca0.9 S:Eu0.01 (lines 7), and Sr0.99 S:Eu0.01, in line 4, and
2+ 2+
0.006, line 15. Blended phosphors shown in Fig. 3b include phosphors (i) in line 10, phosphor (ii) in
Sr0.994 S:Eu2+
line 5 and line 13. The barcodes remain on (‘1’) when above the threshold parameter and off (dark) when below
after the splitting of the red and green channels. For each barcode, the raw barcode is shown alongside the
processes barcode and the reference barcode for authentication at the various time stamps.
‘7 7 7 7’ after 1 s respectively. The yellowish ‘3 3 3 3’ display occurs when segments ① and ② exhaust most of the
red emission while the final ‘7 7 7 7’ display is due to segments ③ and ④ exhausting most of their red emission.
The anti-counterfeiting label covert features are revealed when the raw video frames are split into red and
green channels. For the red channel, the color transitions from the initial red ‘8 8 8 8’ display to a ‘3 3 3 3’ red
at 0.5 s after the red emission in segments ① and ② gets exhausted. Afterward, the display for this red channel
changes to ‘7 7 7 7’ after the red emission from segments ③ and ④ in each digit gets exhausted. On the other
hand, the green channel, not observable at time zero for the raw video, but observable only after channel split-
ting, changes from a green ‘8 8 8 8’ directly to a ‘7 7 7 7’ after 0.5 s. Note that only two green phosphors are used,
with the longer SAED (820) only being used intentionally to lead to the intended ‘7 7 7 7’ display in segments
⑤—⑦. For smartphone anti-counterfeiting applications, the change of the green channel from ‘8 8 8 8’ channel
directly to a ‘7 7 7 7’ after 0.5 s concealed by the red emission for instance can act as the covert feature. In addi-
tion, multi-level intricacy could be realized from the analysis of the persistent lifetime of the blended phosphors.
These observable changes are similar to the persistent decay of the independent phosphors forming the blends.
The persistent lifetime of the phosphor blends is presented in Supplementary Fig. S16. The persistent lifetime
for the red-emitting phosphors Sr0.985 S:Eu2+ 0.015 and Ca0.994 S:Eu0.006, used in the blends were determined as 0.16 s
2+
and 0.27 s, respectively. The SAED (830) extracted persistent lifetime was determined to be 1.56 s which is a 3.7%
decrease from the persistent lifetime of the pure phosphor.
To enhance the concealment level and increase the number of parameters at disposal to optically code the
anti-counterfeiting labels, dynamic and color-tunable anti-counterfeiting barcodes were developed based on the
single phosphors and blended phosphors as shown in Fig. 5. The barcodes were developed using glass tubes with
an internal diameter of 1 mm and were 10 mm long. The 1 mm internal diameter provided sufficient thickness to
accommodate the weak absorption of the SAED phosphors. The phosphor utilized in each bar, from left to right
is as described in the caption. At a ratio of 95:5 wt.% a single barcode had 0.025 ± 0.005 g. The raw barcode in
the middle shows the video frames following smartphone flashlight irradiation which are then split into the red
and green channels respectively. If the pixels for a channel fall below 12% (~ 30 pixels out of 255 possible pixels
Scientific Reports | (2022) 12:2100 | https://doi.org/10.1038/s41598-022-05885-6 9
Vol.:(0123456789)www.nature.com/scientificreports/
Figure 6. Persistent luminescent emoji images utilizing both color tunability and persistent emission to
transform emoji from an initial wow image after smartphone excitation for 10 s. (a) The wow emoji color
transforms to a green wow emoji. (b) The initial red wow emoji transforms to a green smiley face emoji after 1 s.
(c) The initial red wow emoji transforms to a green sad face emoji after 1 s. The external diameter of the emoji is
3.0 cm.
per channel) then the bar transition from one (bright white lines) to zero (transition to black) for that channel.
The registered barcodes are re-confirmed from the information already obtained from the persistent lumines-
cence decay of the phosphors that is also provided as a ref alongside the frames. At time zero, the red channel
barcode reads ‘110110101111101’ and this transitions to ‘110010001111101’ then to ‘110010001101100’ then
‘000000001100000’ and finally to ‘000000000100000’ at 0.4, 0.8, 1.2, and 1.6 s respectively. On the other hand,
the green channel barcode at time zero is ‘101111010110111’ and transitions to ‘101011010110110’ and then
101011010100110’ and then ‘000011010100110’ and finally to ‘000010000100100’ at times 0.4, 0.8, 1.2, and 1.6 s
respectively. The green and red barcode readings and transitions are therefore completely different, and hence
uniquely concealing the authentication of the label. The 15-bar dynamic and color-tunable barcode, with four
verification timestamps for the red and green channels, for instance, provides for over 40! possible combinations.
In a further experiment, the graphical encryption based on dynamic and color-tunable emoji patterns was
developed with only two phosphor blends as shown in Fig. 6. The emoji patterns are developed by drop-casting
the phosphor blends SAED (820): Ca0.999 S:Eu2+ 0.001 and SAED (900):Ca0.992 S:Eu0.008 to form the emoji. Imme-
2+
diately after smartphone excitation, all the initial images show a ‘wow face’ emoji in red. The ‘emoji face’ is
continuously shown in Fig. 6a even when the color changes from red to green after 1 s as this pattern is based
on the SAED (820):Ca0.999 S:Eu2+ 0.001 phosphor blend only. In Fig. 6b, the upper lip of the emoji is replaced with
SAED (900):Ca0.992 S:Eu2+ 0.008 leading to a green smiley face emoji when the Ca0.992 S:Eu0.008 red emission in the
2+
upper lip and the red emission from the blend are exhausted. The SAED (900) does not emit green due to the
high annealing temperature in the air following smartphone flashlight excitation. A similar approach to the lower
lip leads to a sad-faced emoji as shown in Fig. 6c. To ascertain that the similar transition can be observed over a
wide range of temperatures, videos were also taken at 278 and 318 K (5 and 45 °C). The data shown in Fig. S17
confirm that a similar transition is observed at all temperatures, meaning that the optically unique behavior
can be observed over the range of standard ambient temperatures. These images depict the power of dynamic
and color-tunable anti-counterfeiting labels as a cheap smartphone verifiable anti-counterfeit label in which the
covert graphical feature is observed post excitation.
Conclusion
Dynamic and color-tunable anti-counterfeiting tags excitable and readable with a smartphone were fabricated
using SAED, Ca1−x S:Eu2+ x and Sr1−x S:Eux phosphors. The absorption and emission bands of the phosphors
2+
were in the visible region, and this allowed a smartphone flashlight to excite them after which the smartphones’
camera was used to video-record their persistent emission. For the SAED-based phosphors, it was possible to tune
the persistent decay from 0.5 to 12.6 s via annealing them in the air at between 800 and 860 °C. The persistent
2+
luminescence decay of Ca1−x S:Eu2+ x and Sr1−x S:Eux was tuned in the 120–590 ms range by increasing the Eu
2+
doping concentration from 0.0005 to 0.015 mol. The combination of these phosphors allows labels with various
rates of transition from red to green emission color. Various instances of anti-counterfeiting labels based on these
Scientific Reports | (2022) 12:2100 | https://doi.org/10.1038/s41598-022-05885-6 10
Vol:.(1234567890)www.nature.com/scientificreports/
phosphor combinations were demonstrated and it was shown that they could be excited and authenticated with
a single smartphone. The uniqueness and ease of authentication of these persistent luminescence-based labels is
an attractive prospect for application. Further work to develop green-emitting persistent phosphors with better
absorption at 450 nm (and high efficiency) would be very beneficial to this field. In addition, reduction of particle
size while maintaining efficiency would be of interest to make such phosphors compatible with a larger number
of printing techniques. Development of further emission lines, and potentially also a deliberate distortion of
the persistent lifetimes of given components due to reabsorption are possible routes to enhancing the security
of labels based on this approach.
Experimental section
Materials. The raw materials included the commercial strontium aluminate doped with europium and dys-
prosium, Sr0.95 Al2 O4 :Eu2+
0.02 , Dy0.003, (purity 98%, Sigma Aldrich) referred herein throughout as SAED (Ref.).
3+
Other materials used include CaSO4.2H2O (purity, < 99%, VWR—Alfar Aesar), SrSO4 (Purity 99%, VWR—Alfar
Aesar), Eu2O3 (purity, 99.99%, Sigma Aldrich), and activated carbon, (C). The materials were used without fur-
ther purification.
The commercial SAED phosphor was annealed in various temperatures (700 °C, 800 °C, 810 °C, 820 °C,
830 °C, 840 °C, 850 °C, 860 °C, and 890 °C) to tune the persistent luminescence decay. The ramping rate was
maintained at 8 °C per minute for all the samples, with the maximum temperature being maintained for one
hour after which the phosphors were let to cool to room temperature. The phosphors were then labeled according
to the annealing temperature, SAED (700), SAED (800) SAED (810), SAED (820), SAED (830), SAED (840),
SAED (850), SAED (860) and SAED (890). The commercial reference phosphor is referred to throughout this
document as SAED (Ref.). Phosphors annealed beyond 870 °C had extremely low emissions and were therefore
not useful unless used for blending to ensure composite blends look similar.
The series of Ca1−x S: Eu2+x (0.0005 < x < 0.015 mol) and Sr1−x S:Eux (0.0005 < x < 0.015 mol) phosphors were
2+
prepared via solid-state reaction in a reducing environment using a tube furnace. First, the molar ratio materials
were weighed, then two mol of activated carbon were added. The mixture was then thoroughly grounded for
15 min using a mortar. An appropriate amount of pure ethanol (~ 2 ml) was added to each batch to make a clay-
composite mold of the materials. The materials were then let to dry and then transferred to the tube furnace and
annealed at 1200 °C for 3 h. in a reductive atmosphere (Ar:H2 = 95:5) at a ramping rate of 5 °C/min. The phos-
phors were let to cool to room temperature and then ground to form powders for subsequent characterization.
Seven segment display development. The four-digit seven-segment display (made of a PMMA sheet)
was developed in-house using an ultra-precision milling machine. The seven-segment display numbers were
generated using a SURFCAM traditional software. The numbers were based on a 10 mm by 3 mm segment with
a depth of 0.5 mm. The segment edges were maintained at 90° for all the segments. The boundary between seg-
ments was 0.5 mm. The selected blended phosphors were carefully embedded in the segments pressed to form
the display digits.
Optical barcode development. The dynamic and color-tunable barcodes were developed by filling 1 mm
diameter glass tubes with the phosphors and respective blends and aligning them in a 1 mm spacing. The glass
tubes were then sealed and arranged in glue-taped black paper to form the dynamic barcodes. The barcodes
were then analyzed by exciting them with a smartphone flashlight for 5 s and video-recording the emissions. The
videos were then analyzed in MATLAB to derive the persistence luminescence as a function of time.
Drop casting the graphics. The suspensions were created by first dissolving 5 g of polyvinylpyrrolidone in
a 20 ml mixture of ethanol and water (ethanol:deionized water at 30:70 wt.%) and stirring with a magnetic stirrer
for 1 h until the fluid was clear. The 20 ml portion was then divided into two portions of 15 ml and 5 ml. One
gram of the blended phosphor, SAED (820):Ca0.999 S:Eu2+ 0.001 was put in the 15 ml portion and magnetically stirred
for 30 min until the mixture gained homogeneity. For the 5 ml portion, 0.33 g of SAED (900):Ca0.992 S:Eu2+ 0.008
was added and magnetically mixed for 30 min to obtain a homogeneous mixture. Note that the SAED (900) used
is a non-emitting phosphor, purposely added to have the two portions look-alike the naked eye. The blended
phosphors were then drop cast freehand on glass slides with the emoji patterns being under the glass. During the
process, the glass slides were maintained at 50 °C during the casting stage to speed the drying process.
Characterization. Optical characterization. The PL excitation spectra were recorded using a spectrometer
(Varian Carry 50) in the 600–250 nm range, monitored at 650 nm for Ca1−x S:Eu2+ x 614 nm for Sr1−x S:Eux and
2+
514 nm for the SAED phosphors. The phosphors were placed in 1 mm quartz cuvettes during the measurement.
The PL emission was recorded using a spectrometer (CCS200, Thorlabs) coupled with an optical fiber of 1 mm
diameter (FP100URT, Thorlabs) after 450 nm LED excitation. To calculate the PLQY, an optical setup with a
spectrometer (AvaSpec-HS2048XL, Avantes) coupled with an optical fiber (FP100URT, Thorlabs) to an integrat-
ing sphere (15 cm diameter, Lab sphere) was used. A 450 nm LED, controlled with a benchtop diode controller
(ITC4001, Thorlabs) was used as the excitation source and was directed towards the sample in quartz cuvettes
inside the integrating sphere where several measurements as described by de Mello et al. method were t aken44.
Measurements of the empty sphere, direct and indirect excitation spectra, direct and indirect PL emission spec-
tra, and black background were recorded, from which the PLQY was calculated.
Scientific Reports | (2022) 12:2100 | https://doi.org/10.1038/s41598-022-05885-6 11
Vol.:(0123456789)www.nature.com/scientificreports/
Persistent luminescence lifetime. The persistent lifetime of the phosphors was recorded using a smart-
phone (Galaxy A5(2017), Samsung Electronics) via a third-party app Open Camera (v1.48.1 Code: 77) found
in the Google Play app store. To have control of the exposure and shutter settings, the application programming
interface (API) of the app was changed from the default API to camera 2 API. In this mode, we then set the
spatial resolution of the camera to 1920 × 1080 pixels, acquisition speed to normal, white balance to fluorescent,
and color effect to none. Further, the focus distance was set to 10 cm, the shutter speed set to 1/33 s, (allowing 30
frames-per-second capture), and the ISO to 1450.
The persistent luminescence of the phosphors was then video recorded as follows. The phosphors were placed
in a 1-by-1 cm cube holder and placed at 5 cm from the smartphone, which acted as both the excitation source
and signal-detecting device. For persistent decay measurement, first, the video recording was initiated, then the
smartphone flashlight was put on for 5 s and then off while the video recording continued until all the persistent
luminescent of the excited phosphor was completely exhausted. The measurement was repeated several times for
each of the phosphors and as recorded videos processed in MATLAB to determine the persistent luminescence
decay from the pixel region of interest of the phosphors. The green and red persistent lifetime of the blended
phosphors was determined by splitting the channels from the raw video.
Received: 27 September 2021; Accepted: 17 January 2022
References
1. Economics, F. The economic impacts of counterfeiting and piracy. in Report Prepared for BASCAP and INTA. Recuperado de.
https://www.inta.org/communications/documents/2017_frontier_report.pdf (2017).
2. Gu, Y. et al. Gap-enhanced Raman tags for physically unclonable anticounterfeiting labels. Nat. Commun. 11, 1–13 (2020).
3. Arppe, R. & Sørensen, T. J. Physical unclonable functions generated through chemical methods for anti-counterfeiting. Nat. Rev.
Chem. 1, 1–13 (2017).
4. Arapinis, M., Delavar, M., Doosti, M. & Kashefi, E. Quantum physical unclonable functions: Possibilities and impossibilities.
Quantum 5, 475 (2021).
5. Arppe-Tabbara, R., Tabbara, M. & Sørensen, T. J. Versatile and validated optical authentication system based on physical unclon-
able functions. ACS Appl. Mater. Interfaces 11, 6475–6482 (2019).
6. van der Horst, F., Snell, J. & Theeuwes, J. Finding counterfeited banknotes: The roles of vision and touch. CRPI 5, 1–14 (2020).
7. Yu, X., Zhang, H. & Yu, J. Luminescence anti-counterfeiting: From elementary to advanced. Aggregate 2, 20–34 (2021).
8. Feng, Z. et al. A new kind of nonconventional luminogen based on aliphatic polyhydroxyurethane and its potential application in
ink-free anticounterfeiting printing. ACS Appl. Mater. Interfaces 12, 11005–11015 (2020).
9. Wang, Y.-M., Tian, X.-T., Zhang, H., Yang, Z.-R. & Yin, X.-B. Anticounterfeiting quick response code with emission color of invis-
ible metal–organic frameworks as encoding information. ACS Appl. Mater. Interfaces 10, 22445–22452 (2018).
10. Vahedigharehchopogh, N., Kıbrıslı, O., Erol, E., Ersundu, M. Ç. & Ersundu, A. E. A straightforward approach for high-end anti-
counterfeiting applications based on NIR laser-driven lanthanide doped luminescent glasses. J. Mater. Chem. C 9, 2037–2046
(2021).
11. Yuan, J., Christensen, P. R. & Wolf, M. O. Dynamic anti-counterfeiting security features using multicolor dianthryl sulfoxides.
Chem. Sci. 10, 10113–10121. https://doi.org/10.1039/c9sc03948a (2019).
12. Li, P. et al. Waterborne fluorescent dual anti-counterfeiting ink based on Yb/Er-carbon quantum dots grafted with dialdehyde
nano-fibrillated cellulose. Carbohydr. Polym. 247, 116721 (2020).
13. Zuo, M. et al. Full-color tunable fluorescent and chemiluminescent supramolecular nanoparticles for anti-counterfeiting inks.
ACS Appl. Mater. Interfaces 10, 39214–39221 (2018).
14. Ma, Z. et al. Mechanics-induced triple-mode anticounterfeiting and moving tactile sensing by simultaneously utilizing instantane-
ous and persistent mechanoluminescence. Mater. Horiz. 6, 2003–2008 (2019).
15. Wu, C. et al. Efficient mechanoluminescent elastomers for dual-responsive anticounterfeiting device and stretching/strain sensor
with multimode sensibility. Adv. Funct. Mater. 28, 1803168 (2018).
16. Wang, H. et al. Efficient color manipulation of zinc sulfide-based mechanoluminescent elastomers for visualized sensing and
anti-counterfeiting. J. Lumin. 228, 117590 (2020).
17. Zhang, D., Zhou, W., Liu, Q. & Xia, Z. CH3NH3PbBr 3 perovskite nanocrystals encapsulated in lanthanide metal–organic frame-
works as a photoluminescence converter for anti-counterfeiting. ACS Appl. Mater. Interfaces 10, 27875–27884 (2018).
18. Liu, J. et al. Carbon dots in zeolites: A new class of thermally activated delayed fluorescence materials with ultralong lifetimes. Sci.
Adv. 3, e1603171 (2017).
19. Sun, T. et al. Anti-counterfeiting patterns encrypted with multi-mode luminescent nanotaggants. Nanoscale 9, 2701–2705 (2017).
20. Li, F., Wang, X., Xia, Z., Pan, C. & Liu, Q. Photoluminescence tuning in stretchable PDMS film grafted doped core/multishell
quantum dots for anticounterfeiting. Adv. Funct. Mater. 27, 1700051 (2017).
21. Yang, S. et al. Highly efficient organic afterglow from a 2D layered lead-free metal halide in both crystals and thin films under an
air atmosphere. ACS Appl. Mater. Interfaces 12, 1419–1426 (2019).
22. Chia, T. H. & Levene, M. J. Detection of counterfeit US paper money using intrinsic fluorescence lifetime. Opt. Express 17,
22054–22061 (2009).
23. Kalytchuk, S., Wang, Y., Polakova, K. & Zboril, R. Carbon dot fluorescence-lifetime-encoded anti-counterfeiting. ACS Appl. Mater.
Interfaces 10, 29902–29908. https://doi.org/10.1021/acsami.8b11663 (2018).
24. Lu, Y. et al. Tunable lifetime multiplexing using luminescent nanocrystals. Nat. Photon. 8, 32–36 (2014).
25. Katumo, N., Gao, G., Laufer, F., Richards, B. S. & Howard, I. A. Smartphone-based luminescent thermometry via temperature-
sensitive delayed fluorescence from G d2O2S: Eu3+. Adv. Opt. Mater. 8, 2000507 (2020).
26. Katumo, N. et al. Anticounterfeiting labels with smartphone-readable dynamic luminescent patterns based on tailored persistent
lifetimes in Gd2O2S: Eu3+/Ti4+. Adv. Mater. Technol. 6, 2100047 (2021).
27. Zhou, Y. et al. Long-lived room-temperature phosphorescence for visual and quantitative detection of oxygen. Angew. Chem. 131,
12230–12234 (2019).
28. Ren, W., Lin, G., Clarke, C., Zhou, J. & Jin, D. Optical nanomaterials and enabling technologies for high-security-level anticoun-
terfeiting. Adv. Mater. 32, 1901430 (2020).
29. Ramalho, J. F., Carlos, L. D., André, P. S. & Ferreira, R. A. mOptical sensing for the internet of things: A smartphone-controlled
platform for temperature monitoring. Adv. Photon. Res. 2, 2000211 (2021).
30. Yoon, S. et al. The influence of boric acid on improved persistent luminescence and thermal oxidation resistance of SrAl2O4: Eu2+.
J. Lumin. 167, 126–131 (2015).
Scientific Reports | (2022) 12:2100 | https://doi.org/10.1038/s41598-022-05885-6 12
Vol:.(1234567890)You can also read