Dynamic perfusion CT - A promising tool to diagnose pancreatic ductal adenocarcinoma
←
→
Page content transcription
If your browser does not render page correctly, please read the page content below
Open Medicine 2021; 16: 284–292
Research Article
Inga Zaborienė*, Giedrius Barauskas, Antanas Gulbinas , Povilas Ignatavičius,
Saulius Lukoševičius, Kristina Žvinienė
Dynamic perfusion CT – A promising tool to
diagnose pancreatic ductal adenocarcinoma
https://doi.org/10.1515/med-2021-0228 cutoff point, the estimated probability for the presence of
received July 26, 2020; accepted December 14, 2020 PDAC was 97.69%.
Abstract Conclusions ‒ Basic CT perfusion parameters are valu-
Background and objective ‒ This study deals with an able in providing the radiological diagnosis of PDAC. The
important issue of setting the role and value of the estimated BF and BV parameters may serve as indepen-
dynamic computed tomography (CT) perfusion analysis dent diagnostic criteria predicting the probability of PDAC.
in diagnosing pancreatic ductal adenocarcinoma (PDAC). Keywords: adenocarcinoma, computed tomography,
The study aimed to assess the efficacy of perfusion CT in deconvolution model, pancreas, perfusion
identifying PDAC, even isodense or hardly depicted in
conventional multidetector computed tomography.
Methods ‒ A total of 56 patients with PDAC and 56 con-
trol group patients were evaluated in this study. A local 1 Introduction
perfusion assessment, involving the main perfusion para-
meters, was evaluated for all the patients. Sensitivity, Pancreatic ductal adenocarcinoma (PDAC) is the most
specificity, positive, and negative predictive values for common primary malignancy of the pancreas, accounting
each perfusion CT parameter were defined using cutoff for about 80% of malignant pancreatic tumors and is char-
values calculated using receiver operating characteristic acterized by dismal prognosis. Contrast-enhanced multi-
curve analysis. We accomplished logistic regression to detector computed tomography (MDCT) maintains the
identify the probability of PDAC. fundamental imaging modality for identification, char-
Results ‒ Blood flow (BF) and blood volume (BV) values acterization, and staging of PDAC [1].
were significant independent diagnostic criteria for the Using MDCT as a diagnostic test, approximately 11%
presence of PDAC. If both values exceed the determined of ductal adenocarcinomas are missed, as the density of
the pancreas parenchyma and the tumor may appear very
similar. Differential diagnosis of paraduodenal pancrea-
titis, chronic focal pancreatitis, and pancreatic cancer is
* Corresponding author: Inga Zaborienė, Department of Radiology, also complicated [2]. It has been reported that small or
Lithuanian University of Health Sciences, Eiveniu str. 2, Kaunas,
well-differentiated PDACs lack characteristic CT features;
50009, Lithuania, e-mail: inga_backute@yahoo.com,
inga.zaboriene@lsmuni.lt, tel: +37067505160, +370326640
therefore, these lesions could be missed or misdiagnosed
Giedrius Barauskas: Department of Surgery, Lithuanian University [3–5]. A reliable noninvasive method that allows improving
of Health Sciences, Kaunas, Lithuania, accuracy in diagnosing PDAC is desirable. Perfusion CT
e-mail: Giedrius.Barauskas@lsmuni.lt could be feasible in improving the detection rate and could
Antanas Gulbinas : Institute for Digestive Research, Lithuanian also be useful for better characterization of PDAC. Perfusion
University of Health Sciences, Kaunas, Lithuania,
CT is based on contrast media kinetics in the tumor tissue
e-mail: Antanas.Gulbinas@lsmuni.lt
Povilas Ignatavičius: Department of Visceral and Transplant supplying quantitative information on tissue hemody-
Surgery, University Hospital of Zurich, Switzerland, namics. It has been reported to be a reliable imaging
e-mail: ignatavicius@gmail.com modality differentiating benign and malignant lesions,
Saulius Lukoševičius: Department of Radiology, Lithuanian evaluating response to treatment, even describing angio-
University of Health Sciences, Eiveniu str. 2, Kaunas, 50009,
genesis [6–11].
Lithuania, e-mail: Saulius.Lukosevicius@lsmuni.lt
Kristina Žvinienė: Department of Radiology, Lithuanian University of
Furthermore, this functional imaging could be useful
Health Sciences, Eiveniu str. 2, Kaunas, 50009, Lithuania, in the evaluation of tumor aggressiveness, influencing
e-mail: Kristina.Zviniene@lsmuni.lt treatment strategy, and patient management [12].
Open Access. © 2021 Inga Zaborienė et al., published by De Gruyter. This work is licensed under the Creative Commons Attribution 4.0
International License.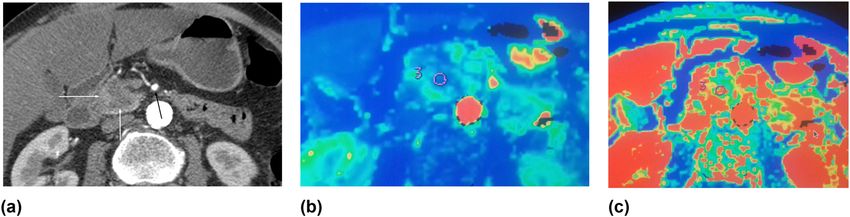
Perfusion CT for pancreatic cancer diagnosis 285
Figure 1: Flowchart of the patient selection process.
This study deals with an important issue of setting smaller ones on the tumor [12]. We placed four ROI on
the role and value of the dynamic CT perfusion analysis different parts of the tumor, ensuring the tumor ROI
in diagnosing pancreatic adenocarcinoma. Early diagnosis remained on the tumor tissue, excluding cystic areas or
of pancreatic cancer is directly associated with increased the main pancreatic duct, and calculated the average
resectability with curative intent. However, in the resect- values of the four basic perfusion parameters.
able solid pancreas tumor, the biopsy is not recommended;
consequently, there is no possibility to unequivocally estab-
lish the diagnosis of cancer preoperatively. Noninvasive
identification of tumors would be desirable in terms of 2 Methods
improved patient selection.
The study aimed to estimate CT perfusion parameters This was a prospective clinical study, in which 242 sub-
in CT-defined tumorous foci and to evaluate if any of jects with suspected PDAC were evaluated from June 2015
these parameters are of value in diagnosing PDAC. to September 2018. All the patients underwent CT ima-
We analyzed the role of perfusion CT basic para- ging with contrast enhancement as a standard protocol
meters in predicting PDAC in our study. Fifty-six patients for confirmation/rejection of the diagnosis.
with PDAC in the head of the pancreas were included and The diagnostic criteria for PDAC were as follows: ill-
all of them underwent perfusion CT imaging. According defined hypoattenuating mass when compared with the
to the literature, shallow breathing during perfusion ima- surrounding parenchymal tissue, abrupt termination of
ging is acceptable [12]. All our patients were breathing the main pancreatic duct (MPD) with upstream dilata-
during data acquisition. It has been shown earlier that tion, double-duct sign, mass effect, and decreased fat
there is no difference in calculating perfusion parameters displacement as compared with the remaining pancreatic
while placing one big region of interest (ROI) or several parenchyma [13].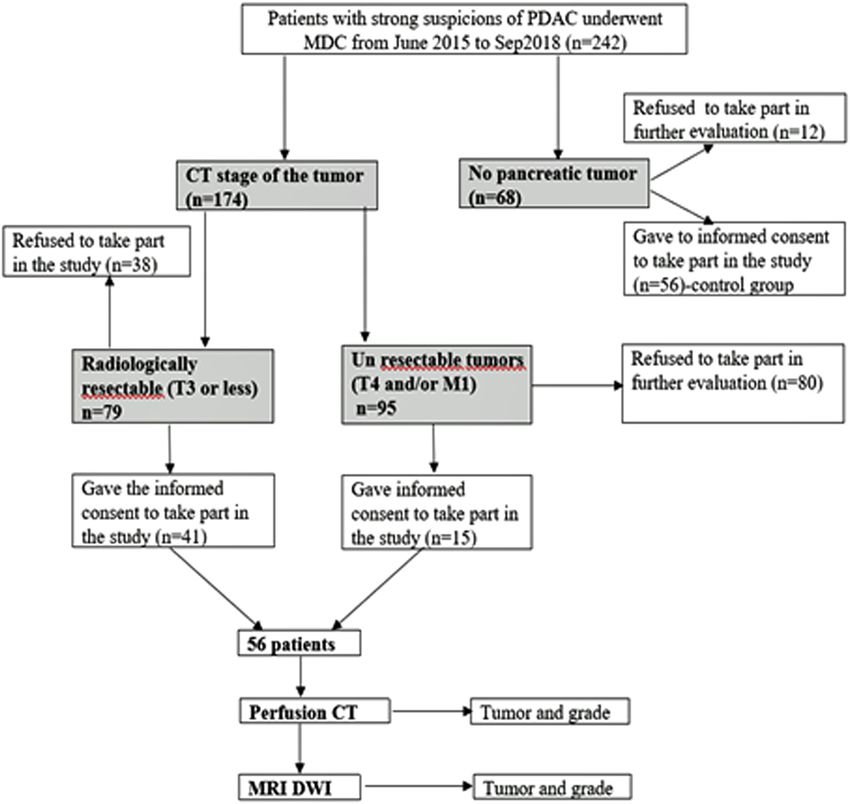
286 Inga Zaborienė et al.
The pancreatic tumor was diagnosed in 174 patients intravenous contrast media (Ultravist 370; Bracco, Milan,
following the MDCT examination. Less than one-third Italy), at a rate of 4.5 mL/s.
(56) of these patients signed informed consent for further The hypodense or isodense mass or areas with mass
evaluation with perfusion CT. In 68 patients, MDCT revealed suspicion were considered as lesions on MDCT and were
no pancreatic tumor. However, 56 of them signed informed analyzed further with perfusion CT. If no mass was
consent for further evaluation with perfusion CT and main- visible, ROI was placed at the site of the MPD abruption.
tained as a control group. The flowchart of the patient selec- The subject was immobilized for 15 min on the table
tion process is shown in Figure 1. to cleanse pancreatic parenchyma of the contrast media,
The exclusion criteria for perfusion CT were as fol- given during MDCT, and to give instructions of slow
lows: patients with impaired renal function, cystic or breathing during p_CT.
hypervascular pancreatic lesions, any type of pancrea- All the subjects had a local perfusion assessment
titis, pancreatic lesion smaller than 1 cm in size (because (based on the deconvolution model of perfusion) invol-
of the disability to put four independent ROIs on the ving an evaluation of blood flow (BF) (mL min−1 100 g−1),
lesion), and patients who refused to sign informed blood volume (BV) (mL 100 g−1 of tissue), mean transit time
consent. (MTT) (s), and permeability surface (PS) (mL min−1 100 g−1).
The Regional Biomedical Research Ethics Committee Pancreatic perfusion was performed within a period
approved the study and all the patients gave their informed of 50 s after a bolus injection of 50 mL of nonionic intra-
consent (study protocol No. BE-2-22, as of 13 May 2015). The venous contrast media (Ultravist 370; Bracco, Milan, Italy) at
patients were managed at the Department of Surgery and a rate of 5 mL/s, applying 120 kVp, 150 mA s, 5 mm slice
the Department of Gastroenterology from June 2015 to thickness, and 300 mm FOV. The total number of p_CT
September 2018. All the study group patients had their images was 792. The lowest possible value of z-axis coverage
PDAC diagnosis verified, by either histopathological exam- was selected to minimize the radiation dose.
ination of surgical specimen or biopsy of the tumor. Raw data images were evaluated at a CT perfusion
software-equipped workstation, using the deconvolution
model (AW Workstation, GE Healthcare). The arterial
input function was determined by placing a circular
2.1 Computed tomography imaging ROI at the abdominal aorta. The area of the ROI was
standardized at 50 mm2. Four round ROIs (50 mm2)
All the subjects underwent an MDCT scan using the GE were placed on the different parts of the tumor and on
light Speed Pro 64 CT (GE Healthcare, Milwaukee, Wis) nontumorous pancreatic tissue for perfusion measure-
scanner and perfusion CT (p_CT) of the tumor and non- ments. The mean value of these four ROIs was calculated
tumorous pancreatic parenchyma. MDCT scanning was for both tumor and nontumorous/fibrotic parenchyma.
performed with a power injector (Ulrich Missouri, Ulrich Image analysis was performed by two independent radi-
GmbH & Co. KG, Ulm, Germany), 80–100 mL of nonionic ologists with 7 and 17 years of experience in abdominal
Figure 2: (a–c) Poorly differentiated (G3) PDAC in the head of the pancreas. Hypodense tumor in the head of the pancreas: (a) contrast-
enhanced CT image, axial plane, arterial phase; hypodense mass in the head of the pancreas is seen (white arrows); no spread to the
peripancreatic fatty tissue is detected; no contact with the superior mesenteric artery (SMA) (black arrow); a radiologically resectable
tumor; (b and c) perfusion CT images of the same patient; third ROI of 4 is shown; (b) significantly reduced BF (29.24 mL min−1 100 g−1) in the
tumor was detected; (c) reduced blood volume of the tumor – 6.13 mL 100 g−1 (ROI). The examination of the surgical specimens revealed
poorly differentiated PDAC (G3).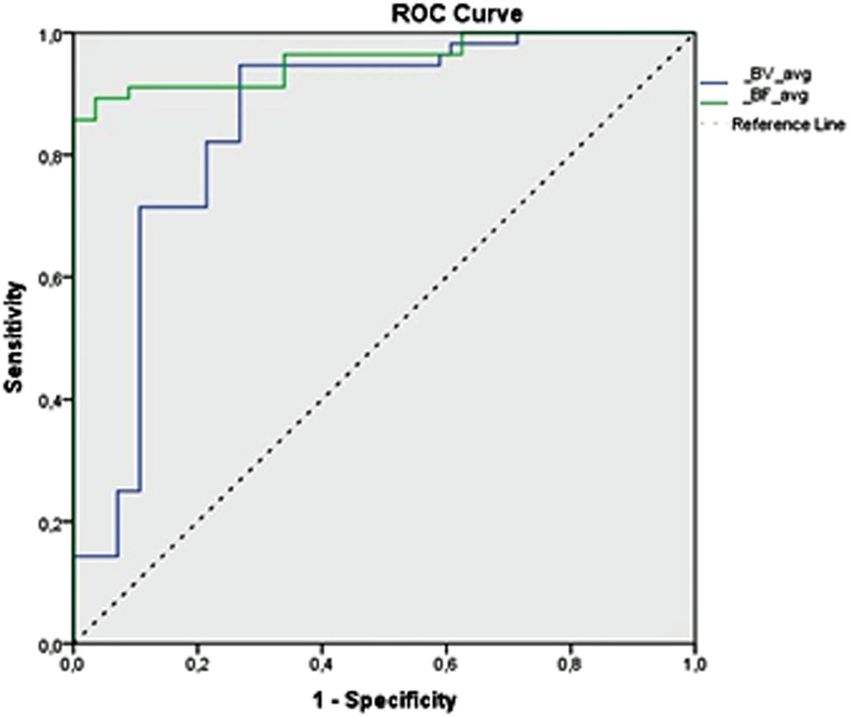
Perfusion CT for pancreatic cancer diagnosis 287
radiology. The calculations were compared and, obser- between the control and study groups. At each step, the
ving no major discrepancies in the obtained results, the variable that minimizes the overall Wilks’ lambda was
mean values of both calculations were used for further entered. We performed logistic regression to identify
analysis. the probability of PDAC. All calculations were performed
Histopathological analysis of surgery specimens or using SPSS for Windows 23.0 software and Microsoft
biopsy material was performed on a routine basis at the Excel 16. The P-value less than or equal to 0.05 was con-
Department of Pathology, Medical Academy, Lithuanian sidered as statistically significant.
University of Health Sciences. The pathologists were
blinded to the perfusion CT results.
Figure 2a–c shows the data of the patient with PDAC
in the head of the pancreas. At the time of imaging, the 3 Results
tumor was resectable and the patient underwent the
Whipple procedure. Histopathological examination revealed
3.1 General group characteristics
poorly differentiated (G3) PDAC. Figure 3a–c shows the data
of the patient with moderately differentiated (G2) PDAC in
The study group included 56 patients with PDAC in the
the head of the pancreas.
head of the pancreas: 22 men (39.3%) and 34 women
(60.7%). The mean age was 66.86 years (11.86). The
mean size of the tumor was 34.98 (9.99) mm (range
13–58 mm). The control group consisted of 56 patients
2.2 Statistical analysis
with nontumorous pancreatic tissue: 27 men (48.2%)
and 29 women (51.8%). The mean age of the patients in
The Kolmogorov–Smirnov test and the Shapiro–Wilk test
this group was 64.86 years (12.26). There was no differ-
were used to determine whether the continuous variables
ence in age or gender between the groups (P = 0.382 and
were normally distributed. The data were expressed as
P = 0.341, respectively).
mean values (SD – standard deviation) or median (in
cases of abnormal distribution, for BF and PS; interquar-
tile range Q1–Q3). Variables conforming to a normal
distribution were compared via the Student’s t-test; 3.2 Perfusion CT parameters
otherwise, the Mann–Whitney U-test was used for com-
parison. Diagnostic accuracy was assessed as the area The median BF and PS values (parameters with abnormal
under the receiver operating characteristic (ROC) plot. distribution) and the mean value (SD) of BV and MTT
Sensitivity, specificity, and positive and negative predic- for the nontumorous pancreatic tissue were 138.129
tive values for each perfusion CT parameter in the pre- (mL min −1 100 g −1 ), 51.223 (mL min −1 100 g −1 ), 16.139
diction of the presence of PDAC were calculated using (6.386) (mL 100 g−1), and 8.961 (4.550) (s), respectively.
cutoff values chosen based on ROC curves. Discriminant The median values of BF and PS for PDAC patients
function analysis was used to identify the differences were 41.740 (mL min−1 100 g−1) and 24.097 (mL min−1 100 g−1);
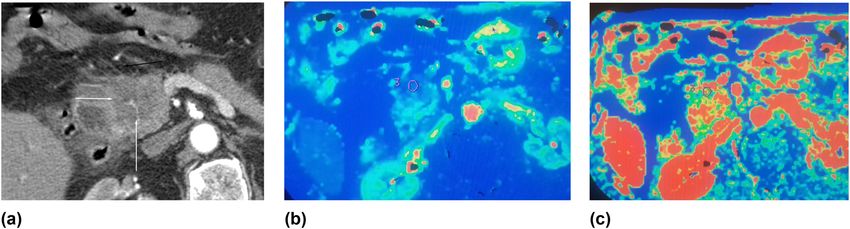
Figure 3: (a–c) Moderately differentiated (G2) PDAC in the head of the pancreas. Contrast-enhanced CT images of PDAC (G2) in the head of
the pancreas: (a) arterial phase – a hypodense tumor in the head of the pancreas (white arrows) with infiltration of the peripancreatic fatty
tissue (black arrow); (b–c) perfusion CT images of the same patient with G2 (moderate differentiated) tumor: (b) reduced BF in the tumor
was detected (blood flow 43.24 mL min−1 100 g−1); (c) reduced blood volume of the tumor – 7.6 mL 100 g−1 (ROI).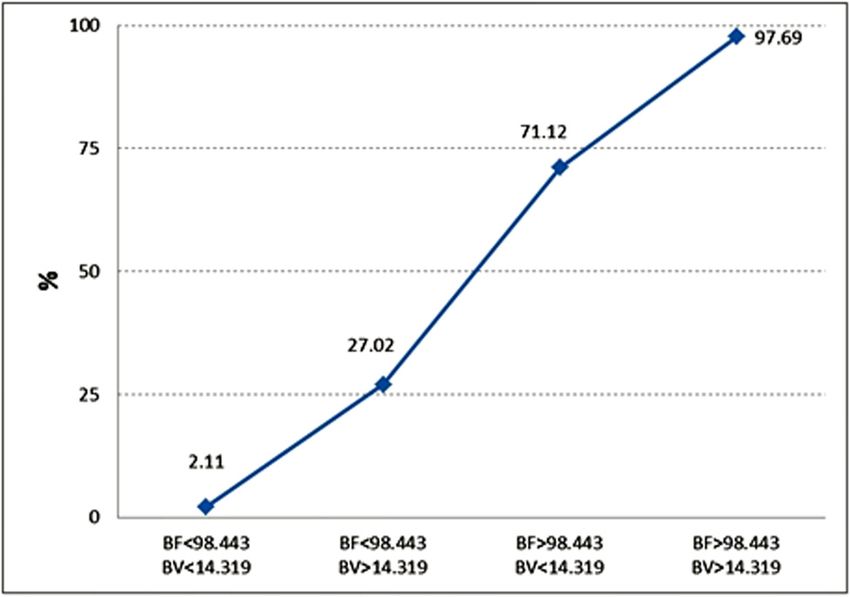
288 Inga Zaborienė et al.
the mean values (SD) of BV and MTT were 7.941 (4.315) BV, MTT, and PS – were included in the stepwise ana-
(mL 100 g−1) and 12.473 (6.273) (s), respectively. lysis to establish the most important ones (Table 4 and
The median values of BF and PS and the mean value of Figure 5), revealing BF and BV as significant indepen-
BV were lower in PDAC compared with the nontumorous dent discriminators.
parenchymal tissue (P < 0.001), and the mean value of MTT The graph shows the prognosticated probability of
was higher in PDAC, compared with the control group (P = PDAC (%) (determined by logistic regression analysis) if
0.001). The distribution between perfusion parameters in the BF parameter, the BV parameter, or both of them
nontumorous pancreatic parenchyma (control group) and exceed the defined cutoff value (BF < 98.443 min−1 100 g−1,
PDAC is presented in Table 1. BV < 14.319 mL 100 g−1). If both the BF and BV values are
We used discriminant function analysis to identify less than the determined cutoff point, the prognosticated
the differences between PDAC and the nontumorous probability for the presence of PDAC is 2.11%; if both values
parenchymal tissue. We included four main perfusion exceed the determined cutoff point, the estimated prob-
variables (BF, BV, MTT, and PS) to establish the most ability for the presence of PDAC is 97.69%.
important ones.
At each step, the variable that minimizes Wilks’
lambda was entered, detecting BF and BV as significant
independent discriminators (Table 2). Fisher’s classifica- 4 Discussion
tion coefficient for classification function was as follows:
ƒtumor = −3.332 + 0.027 × BF + 0.058 × BV. Perfusion CT is a relatively new imaging modality that
has been progressively used for imaging of oncological
Particular cutoff values for BF, BV, MTT, and PS were patients over the last decade [11,14,15]. Based on repeti-
calculated using ROC analysis to practically differentiate tive scanning following intravenous contrast media injec-
PDAC from the nontumorous pancreas tissue. Based on tion, the perfusion technique allows the measurement of
the ROC analysis, the area under the curve for BF and BV functional parameters of tumor vascularity: BF, BV, MTT,
was outstanding and excellent, respectively (Figure 4). and PS. An increasing number of publications report per-
The BF value less than 98.443 mL min−1 100 g−1 was fusion values of the pancreas [16–19].
concomitant to the presence of PDAC with an 89.3% sen- In the present study, we showed that if BF and BV
sitivity and a 96.4% specificity (area under curve = 0.957, values exceed the determined cutoff point, the estimated
outstanding); the BV of less than 14.319 mL 100 g−1 was probability for the presence of PDAC reaches 97.69%.
concomitant to the presence of PDAC with a 94.6% sen- Therefore, estimated BF and BV parameters may
sitivity and a 73.2% specificity (area under curve = 0.852, serve as promising independent diagnostic criteria pre-
excellent). Cutoff points for all perfusion parameters with dicting the probability of PDAC. According to Klauss et al.
their predictive values are presented in Table 3. [20], early detection and curative resection are of utmost
importance in improving the survival rates of PDAC
patients. Therefore, timely diagnosis is extremely impor-
3.3 Independent diagnostic criteria of PDAC tant. MDCT is the modality of choice detecting the tumor
and evaluating its resectability. However, there are
The logistic regression model was adapted to reveal the inde- PDACs that cannot be determined in conventional CT.
pendent diagnostic criteria of PDAC. Four parameters – BF, Prokesch et al. [3] found that “up to 11% of the pancreatic
Table 1: Perfusion CT parameters with SD in normal parenchymal tissue and PDAC
Parameters Nontumorous tissue PDAC P-value
BF (mL min−1 100 g−1); median (IQR) 138.13 (125.42–166.10) 41.74 (32.65–71.98)Perfusion CT for pancreatic cancer diagnosis 289
Table 2: BF and BV values are significant discriminators between groups of patients with nontumorous parenchymal tissue and PDAC
Wilks’ lambda
Exact F
Step Entered Statistic Df1 Df2 Df3 Statistic Df1 Df2 Sig.
1 BF 0.336 1 1 110.000 217.431 1 110.000 P < 0.001
2 BV 0.314 2 1 110.000 118.885 2 109.000 P < 0.001
Abbreviations: BF, blood flow; BV, blood volume.
perfusion CT may potentially serve as such a tool [2,12,21].
Perfusion CT has not been routinely used in clinical practice
yet because of the lack of consensus between radiologists
[17–19]. Despite large heterogeneity of calculated perfusion
CT parameters in the majority of studies, these results
comply with the main idea that BF and BV parameters in
pancreatic cancer are significantly reduced. Cutoff values
are different between the studies, and this may depend on
different data acquisition protocols and different software
packages.
Different calculation methods (one compartment
analysis [maximum slope], two-compartment analysis
[Patlak], deconvolution analysis) for the post-proces-
sing of perfusion CT images demonstrate differences
in the calculated perfusion values between the different
mathematical models [6,13,16,21,22]. To increase the
Figure 4: Receiver operating characteristic (ROC) curve analysis for reliability of CT-perfusion, optimized perfusion CT exami-
blood flow (BF) and blood volume (BV) perfusion parameters. BF nation protocol and standardization of post-processing are
value less than 98.443 mL min−1 100 g−1 (area under the curve essential. To show that the different models deliver com-
[AUC] = 0.957) and BV value less than 14.319 mL 100 g−1 (AUC =
parable results, Schneeweiß et al. [2] compared different
0.852) are shown to be good predictors for the presence of PDAC.
models (maximum slope + Patlak and deconvolution ana-
lysis) in their study with PDAC patients. A moderate–good
Table 3: Analysis of sensitivity, specificity, PPV and NPV, and ROC correlation between perfusion parameters in the dif-
for averaged BF, BV, MTT, and PS for the presence of PDAC ferent models was found; however, the maximum slope
model underestimated BF perfusion. CT perfusion ima-
PDAC BF BV MTT PS ging develops rapidly, regardless of these significant
AUC 0.957 0.852 0.653 0.749 perfusion parameter differences between the different
Cutoff point290 Inga Zaborienė et al.
Table 4: Logistic regression for estimating the probability occurrence of PDAC
B S.E. Sig. Exp (B) 95% C.I. for Exp (B) lower 95% C.I. for Exp (B) upper
BF cutoff 4.737 0.908Perfusion CT for pancreatic cancer diagnosis 291
BV parameters are valuable as independent diagnostic [6] Yadav AK, Sharma R, Kandasamy D, Pradhan RK, Garg PK, Ashu
criteria predicting the probability of PDAC. Seith Bhalla AS, et al. Perfusion – can it resolve the pancreatic
carcinoma versus mass forming chronic pancreatitis conun-
drum? Pancreatology. 2016;16(6):979–87. doi: 10.1016/
Acknowledgments: The authors express their gratitude to
j.pan.2016.08.011.
the colleagues at the departments of Gastroenterology [7] Hartwig W, Schneider L, Diener MK, Bergmann F, Büchler MW,
and Surgery, as well as the technical personnel of the Werner J. Preoperative tissue diagnosis for tumours of the
Radiology department for cooperation. pancreas. Br J Surg. 2009;96:5–20. doi: 10.1002/bjs.6407.
[8] Kandel S, Kloeters C, Meyer H, Hein P, Hilbig A, Rogalla P.
Whole-organ perfusion of the pancreas using dynamic volume
Author contributions: Each named author has substan-
CT in patients with primary pancreas carcinoma: acquisition
tially contributed to conducting the underlying research technique, post-processing and initial results. Eur Radiol.
and drafting this manuscript. Conception (construct- 2009;19:2641–6. doi: 10.1007/s00330-009-1453-z.
ing an idea or hypothesis for research) – G. B., K. Z., [9] Lu N, Feng XY, Hao SJ, Zong-Hui Liang ZH, Jin C, Qiang JW, et al.
and S. L.; design (planning methodology to reach the 64 slice CT perfusion imaging of pancreatic adenocarcinoma
and mass-forming chronic pancreatitis. Acad Radiol.
conclusions) – G. B., K. Z., and P. I.; organizing and
2011;18:81–8. doi: 10.1016/j.acra.2010.07.012.
supervising the course of the article and taking the
[10] Miles KA, Charnsangavej C, Lee FT, Fishman EK, Horton K,
responsibility – I. Z, S. L., A. G., and P. I.; materials and Lee TY. Application of CT in the investigation of angiogenesis
referred patients – K. Z., S. L., and A. G.; data collection in oncology. Acad Radiol. 2000;7:840–50. doi: 10.1016/s1076-
and processing – I. Z.; analysis and interpretation – I. Z., 6332(00)80632-7.
G. B., and P. I.; literature review – I. Z., G. B., and A. G.; [11] Mazzei FG, Mazzei MA, Cioffi Squitieri N, Pozzessere C, Righi L,
Cirigliano A, et al. CT perfusion in the characterisation of renal
reviewing the article before submission for spelling and
lesions: an added value to multiphasic CT. BioMed Res Int.
grammar and also for its intellectual content – G. B., 2014;2014:10. Article ID 135013. doi: 10.1155/2014/135013.
A. G., K. Z., S. L., and P. I. [12] D’Onofrio M, Gallotti A, Mantovani W, Crosara S, Manfrin E,
Falconi M, et al. Perfusion CT can predict tumoral grading of
Conflict of interest: The authors of this article have no pancreatic adenocarcinoma. Eur J Radiol. 2013;82:227–33.
conflict of interest, financial, or otherwise. doi: 10.1016/j.ejrad.2012.09.023.
[13] Horvat N, Ryan DE, La Gratta MD, Shah PM, Kinh Do R. Imaging
for pancreatic ductal adenocarcinoma. Chin Clin Oncol.
Data availability statement: The datasets generated during 2017;6(6):62. doi: 10.21037/cco.2017.11.03.
and/or analysed during the current study are available from [14] Spira D, Neumeister H, Spira SM, Hetzel J, Spengler W,
the corresponding author on reasonable request. Weyhern CH, et al. Assessment of tumor vascularity in lung
cancer using volume perfusion CT (VPCT) with histopathologic
comparison: a further step toward an individualized tumor
characterization. J Comput Assist Tomogr. 2013;37:15–21.
doi: 10.1097/RCT.0b013e318277c84f.
References [15] Klotz E, Haberland U, Glatting G, Schoenberg SO, Fink C,
Attenberger U, et al. Technical prerequisites and imaging
[1] Megibow AJ, Bosniak MA, Ambos MA, Beranbaum ER. protocols for CT perfusion imaging in oncology. Eur J Radiol.
Thickening of the celiac axis and/or superior mesenteric 2015;84:2359–67. doi: 10.1016/j.ejrad.2015.06.010.
artery: a sign of pancreatic carcinoma on computed tomo- [16] Djuric-Stefanovic A, Saranovic D, Masulovic D, Ivanovic A,
graphy. Radiology. 1981;141(2):449–53. doi: 10.1148/ Pesko P. Comparison between the deconvolution and max-
radiology.141.2.7291572. imum-slope 64-MDCT perfusion analysis of the esophageal
[2] Schneeweiß S, Horger M, Grözinger A, Nikolaou K, Ketelsen D, cancer: is conversion possible? Eur J Radiol. 2013;82:1716–23.
Syha R, et al. CT-perfusion measurements in pancreatic car- doi: 10.1016/j.ejrad.2013.05.038.
cinoma with different kinetic models: is there a chance for [17] Kaufmann S, Schulze M, Horger T, Oelker A, Nikolaou K,
tumour grading based on functional parameters? Cancer Horger M. Reproducibility of VPCT parameters in the normal
Imaging. 2016;16:43. doi: 10.1186/s40644-016-0100-6. pancreas: comparison of two different kinetic calculation
[3] Prokesch RW, Chow LC, Beaulieu CF, Bammer R, Jeffrey JR. models. Acad Radiol. 2015;22:1099–105. doi: 10.1016/
Isoattenuating pancreatic adenocarcinoma at multi-detector j.acra.2015.04.005.
row CT: secondary signs. Radiology. 2002;224:764–8. [18] Spira D, Gerlach JD, Spira SM, Schulze M, Sauter A, Horger M.
doi: 10.1148/radiol.224301128. Effect of scan time on perfusion and flow extraction product
[4] Bond-Smith G, Banga N, Hammond TM, Imber CJ. Pancreatic (K-trans) measurements in lung cancer using low-dose volume
adenocarcinoma. MBJ. 2012;16(344):e2476. doi: 10.1136/ perfusion CT (VPCT). Acad Radiol. 2012;19:78–83.
bmj.e2476. doi: 10.1016/j.acra.2011.09.010.
[5] Zakharova OP, Karmazonovsky GG, Egorov VI. Pancreatic [19] Mazzei MA, Squitieri NC, Sani E, Guerrini S, Imbriaco G,
adenocarcinoma: outstanding problems. World J Gastrointest Di Lucia D, et al. Differences in perfusion CT parameter values
Surg. 2012;4(5):104–13. doi: 10.4240/wjgs.v4.i5.104. with commercial software upgrades: a preliminary report292 Inga Zaborienė et al.
about algorithm consistency and stability. Acta Radiol. [24] Xu J, Liang Z, Hao S, Zhu L, Ashish M, Jin C, et al. Pancreatic
2013;54:805–11. doi: 10.1177/0284185113484643. adenocarcinoma: dynamic 64 slice helical CT with perfusion
[20] Klauss M, Stiller W, Pahn G, Fritz F, Kieser M, Werner J, et al. imaging. Abdom Imaging. 2009;34:759–66. doi: 10.1007/
Dual-energy perfusion-CT of pancreatic adenocarcinoma. s00261-009-9564-1.
Eur J Radiol. 2013;82:208–14. doi: 10.1016/ [25] Klauss M, Wolfram Stiller W, Fritz F, Werner J, Kauczor HU,
j.ejrad.2012.09.012. Grenacher L. Computed tomography perfusion analysis of
[21] Goh V, Halligan S, Bartram CL. Quantitative tumor perfusion pancreatic carcinoma. Comput Assist Tomogr. 2012 March/
assessment with multidetector CT: are measurements from April;36(2):237. doi: 10.1097/RCT.0b013e31824a099e.
commercial software packages interchangeable? Radiology. [26] Tan Z, Miao Q, Li X, Li X, Ren, K, Zhao, Y, et al. The primary
2007;242:777–82. doi: 10.1148/radiol.2423060279. study of low dose pancreas perfusion by 640-slice helical CT:
[22] Mazzei MA, Preda L, Cianfoni A, Volterrani L. CT perfusion: a whole-organ perfusion. SpringerPlus. 2015;4:192.
technical developments and current and future applications. doi: 10.1186/s40064-015-0950-6.
Bio Med Res Int. 2015;2015:2. Article ID 397521. doi: 10.1155/ [27] Li HO, Sun C, Xu ZD, Fan Miao F, Zhang DJ, Chen J, et al. Low-
2015/397521. dose whole organ CT perfusion of the pancreas: preliminary
[23] Bisdas S, Konstantinou G, Surlan-Popovic K, study. Abdom Imaging. 2014;39:40–7. doi: 10.1007/s00261-
Khoshneviszadeh A, Baghi M, Vogl TJ, et al. Dynamic contrast- 013-0045-1.
enhanced CT of head and neck tumors: comparison of [28] Aslan S, Nural MS, Camlidag I, Danaci M. Efficacy of perfusion
first-pass and permeability perfusion measurements using CT in differentiating of pancreatic ductal adenocarcinoma from
two different commercially available tracer kinetics models. mass-forming chronic pancreatitis and characterization of
Acad Radiol. 2008;15:1580–9. doi: 10.1016/ isoattenuating pancreatic lesions. Abdom Radiol.
j.acra.2008.05.021. 2019;44:593–603. doi: 10.1007/s00261-018-1776-9.You can also read