ECG Banner Staff Service Study Guide - Edited by Larry H. Lybbert, MS, RN
←
→
Page content transcription
If your browser does not render page correctly, please read the page content below
Banner Staff Service
       ECG
   Study Guide

               Edited by
       Larry H. Lybbert, MS, RN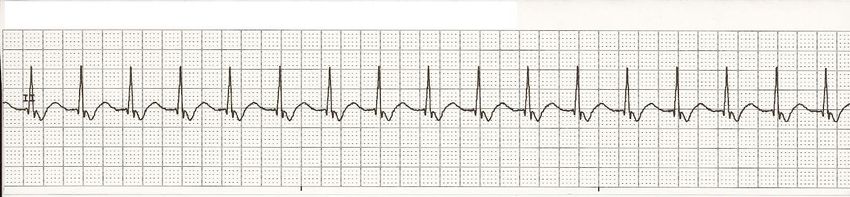
Table of Contents
ECG STUDY GUIDE ................................................................................................................................................... 3
ECG INTERPRETATION BASICS........................................................................................................................... 4
   EKG GRAPH PAPER ..................................................................................................................................................4
   RATE MEASUREMENT ...............................................................................................................................................9
     The Six Second Method ........................................................................................................................................9
     Large Box Method................................................................................................................................................9
     Small Box Method ................................................................................................................................................9
   BASIC EKG RHYTHM ANALYSIS GUIDE ................................................................................................................11
     Rhythm Interpretation ........................................................................................................................................13
     Six Basic Steps for Rhythm Interpretation Summary .........................................................................................13
   NURSING PRIORITIES AND POTENTIAL TREATMENTS ............................................................................................14
     Bradycardia .......................................................................................................................................................14
     Tachycardia .......................................................................................................................................................15
     Cardiac Arrest....................................................................................................................................................16
   BASIC CHARACTERISTICS OF CARDIAC RHYTHMS .................................................................................................17
TYPES OF RHYTHM................................................................................................................................................ 19
   NORMAL SINUS RHYTHM .......................................................................................................................................19
   SINUS BRADYCARDIA .............................................................................................................................................20
   SINUS TACHYCARDIA .............................................................................................................................................21
   PREMATURE ATRIAL CONTRACTIONS (PACS) .......................................................................................................23
   ATRIAL FIBRILLATION ............................................................................................................................................24
   ATRIAL FLUTTER ....................................................................................................................................................25
   JUNCTIONAL RHYTHM ............................................................................................................................................26
   ACCELERATED JUNCTIONAL RHYTHM/JUNCTIONAL TACHYCARDIA ....................................................................27
   ATRIOVENTRICULAR BLOCKS ................................................................................................................................28
   1ST DEGREE AV BLOCK .........................................................................................................................................29
   2ND DEGREE AV BLOCK (MOBITZ TYPE I, WENCKEBACH) ..................................................................................29
   2ND DEGREE AV BLOCK (MOBITZ TYPE II)...........................................................................................................31
   3RD DEGREE AB BLOCK / COMPLETE HEART BLOCK ...........................................................................................32
   VENTRICULAR RHYTHMS .......................................................................................................................................34
   PREMATURE VENTRICULAR CONTRACTION (PVCS)..............................................................................................35
   VENTRICULAR TACHYCARDIA ...............................................................................................................................37
   VENTRICULAR FIBRILLATION .................................................................................................................................38
   ASYSTOLE ...............................................................................................................................................................39
   POLYMORPHIC VENTRICULAR TACHYCARDIA (TORSADE DE POINTES) ................................................................40
   IDIOVENTRICULAR (IVR) .......................................................................................................................................41
   ACCELERATED IDIOVENTRICULAR (AIVR)............................................................................................................42
   PACED RHYTHMS....................................................................................................................................................43
      Pacemaker Summary..........................................................................................................................................46
CONCLUSION ........................................................................................................................................................... 47

                                                                                     2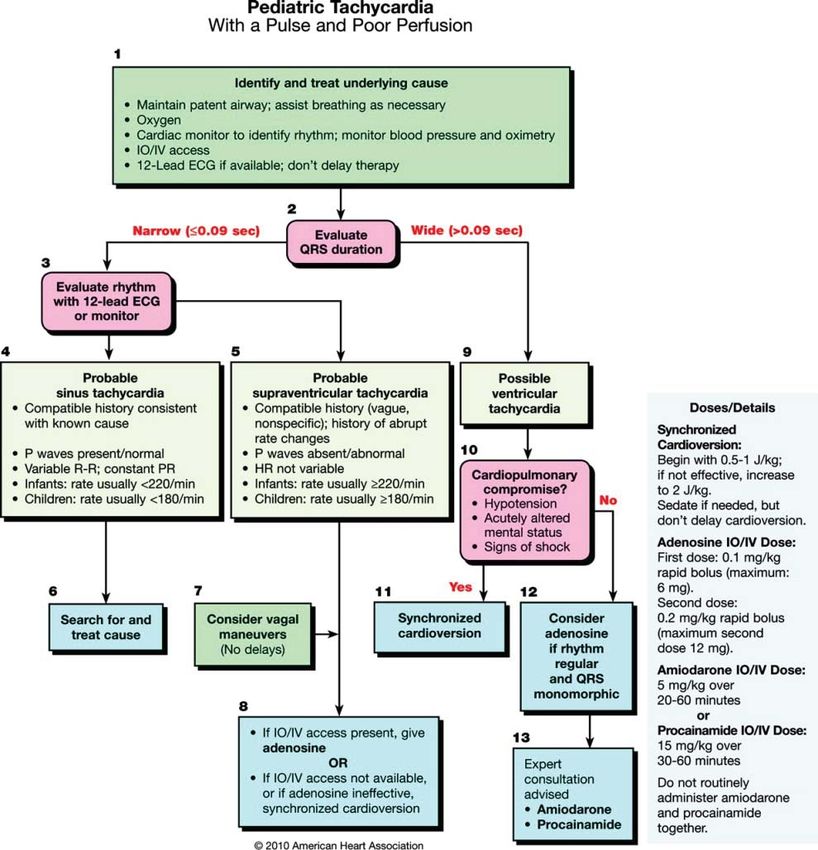
ECG Study Guide
ECG Assessment Testing is an assessment of your basic knowledge and should be completed as part of
your new hire process. Although we are sure that you know the information, you need to study this
information to be prepared to pass the test. Please remember the following guidelines:
The study guide is a good overall review of the components of the ECG waveform and more common
dysrhythsmia. You will need to be able to recognize the four lethal rhythms. Asystole, Ventricle
Tachycardia (VT), Ventricle Fibrillation (VF), and Polymorphic Ventricle Tachycardia (Torsade de
pointes).
Use this study guide and other resource books to review ECG interpretation. You will be expected to
calculate rates properly interpret each strip. Practice measuring your strips in the study guide. The
rhythm strips on the exam are NOT 6 second strips. Use calipers or the attached handout to
determine rates.
Memorize your blocks…there are several rhythm strips on blocks.
Rules for passing the exam
Minimal passing score = 85%
If you do not correctly identify any of the following rhythms, you will be required to retake the exam,
even if your test score is above the passing score.
o Ventricular tachycardia
o Ventricular fibrillation
o Asystole
o Torsade de pointes
If you correctly identify the four lethal rhythms and achieve an overall score of at least 85%, you have
passed the exam.
For Information Purpose Only
The 2010 ECC Adult algorithms for cardiac arrest, bradycardia with a pulse, and tachycardia with a
pulse are included in this study guide. Changes have occurred with the 2010 guidelines, so please take
time to review the following link:
http://guidelines.ecc.org/pdf/90-1043_ECC_2010_Guidelines_Highlights_noRecycle.pdf
Questions, Give us a call.
Larry Lybbert, RN, BSN, MS Angela Stone
Banner Staffing Services Banner Staffing Services
480-684-6428 480-684-6427
Larry.Lybbert@bannerhealth.com Angela.Stone@bannerhealth.com
3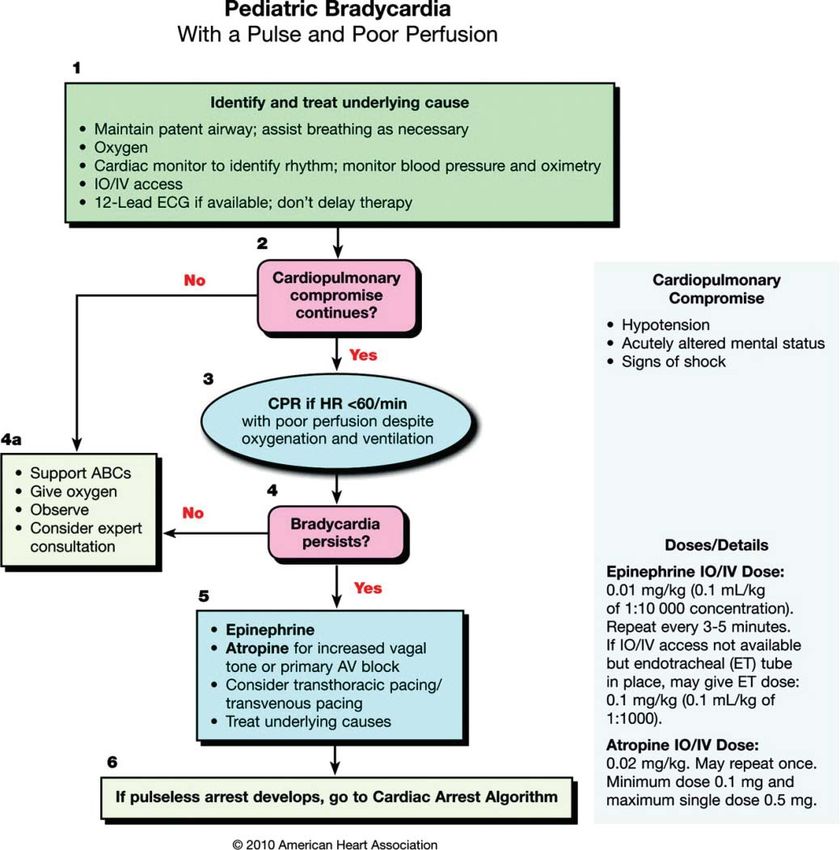
ECG Interpretation Basics
                                        EKG Graph Paper

The paper used to record EKG tracings is grid like in nature and has specific markings utilized to mark
length in seconds. The paper is divided into large and small boxes. Thicker darker lines separate large
boxes; thinner lighter lines separate small boxes.
    x The dark vertical lines are 0.20 seconds apart.
    x The lighter vertical lines are 0.04 seconds apart
    x Each small box is 1mm in size
    x Each small box represents an electrical current that is equal to 0.1 (millivolt) mV
    x One mV is equal to two large boxes

                                                    4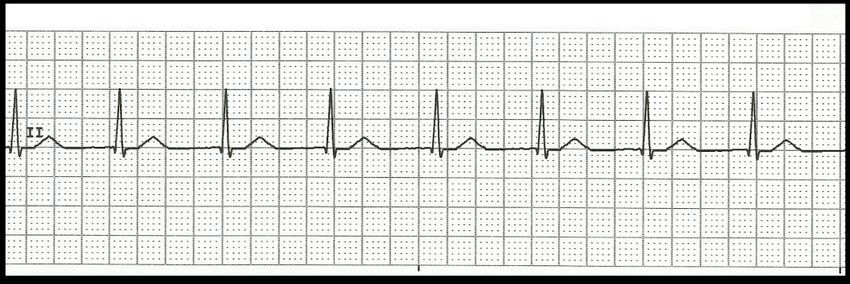
Normally EKG graph paper has thick dark lines at the top or bottom of the paper. In the strip presented
here, the lines are at the bottom of the paper. The space between the lines is equal to 3 seconds. A
standard EKG strip is run over 6 seconds. When printing an EKG rhythm strip the paper prints at a
standard speed of 25 mm per second.

                                                    5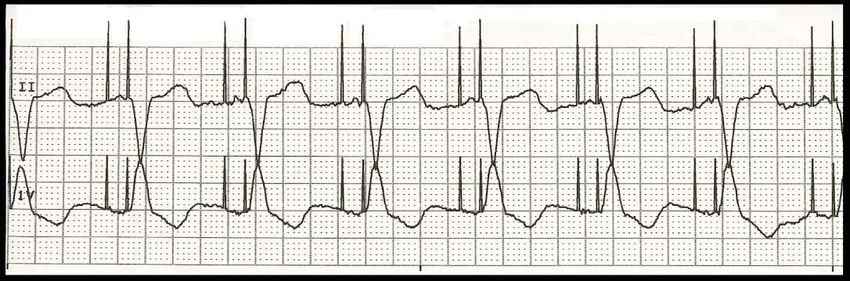
omponents of the Normal EKG Waveform

The EKG is a real-time recording of the hearts electrical activity, produced by depolarization and
repolarization of the hearts cells.

The EKG waveform consists of :
   x P Wave: Represents atrial depolarization
   x QRS: Represents ventricular depolarization
   x T Wave: Represents ventricular repolarization

Intervals are described as the length of time between one waveform and the next.

Isoelectric Line: Flat line of the EKG tracing represents no electrical activity, and is referred to as the
baseline. Deflections above the isoelectic line are positive, and deflections below the isoelectric line are
negative.

P-Wave: The SA node produces an electrical stimulus the P wave, normally upright, usually no more
than 3mm in height.

PRI (PR Interval): Is representative of the spread of the atrial depolarization wave, and the time it takes
for the impulse to conduct through the AV node and to the ventricles. The PRI is marked from the start of
the P-Wave to the beginning of the QRS. The PRI is normally no more than 0.20 seconds in length.

QRS Complex: The QRS represents depolarization of the ventricles and ventricular conduction time of
the electrical impulse. Typically the QRS is narrow with a conduction time of no more than 0.12 seconds.
The QRS is measured from the beginning of the first waveform to the point at which the waveform
returns to the isolectric line. The QRS is made up of:
    x Q-Wave: First negative deflection from baseline (below the isoelectric line),
    x R-Wave: Positive deflection from the baseline (above the isoelectric line).
    x S-Wave: Negative deflection following the R-Wave (below the isoelectric line)
    x R’ (Prime) is a secondary positive wave that may represent abnormal ventricular conduction.

                                                      6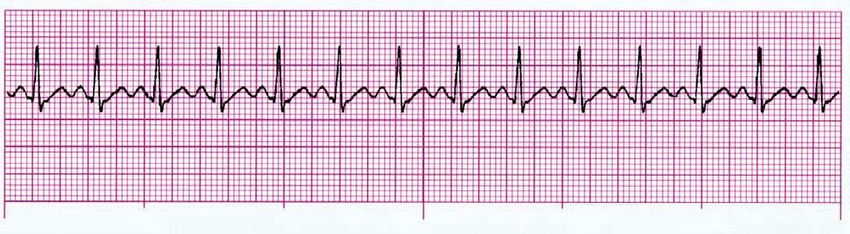
Below are examples of the shapes that the QRS complex may take:

ST-Segment: Represents early ventricular repolarization, and extends from the end of the QRS to the
beginning of the T-Wave, it is normally even with the isoelectric line. A deviation either above or below
the isoelectric line represents myocardial injury or ischemia.

Basic facts of the ST segment.

The ST segment starts at the end of the QRS and ends at the start of the T Wave. The ST segment
represents the early beginning of ventricular repolarization. The portion of the EKG tracing where the
QRS ends and the ST                                                                     segment begins is
called the J Point.

Characteristics: The ST-segment normally remains “Isoelectric” which is the normal baseline of the
EKG. Elevation greater than 1mm in two or more reciprocal leads may indicate injury. Depression greater
than 1mm in two or more reciprocal leads may indicate myocardial ischemia.

T-Wave: Represents ventricular repolarization as the ventricles return to a state of relaxation. The T-
Wave is typically rounded and systematical. The T-Wave is typically upright however, this may vary if
myocardial injury or ischemia is present.

QT-Interval (QTI): The QTI represents the refractory period of the ventricles (The QT interval
represents total ventricular activity), as they depolarize and repolarize. It begins with the first wave in the
QRS complex representing ventricular depolarization, and ends when the T Wave returns to baseline at the
isoelectric line, representing ventricular repolarization.
As rule of thumb, a normal QTI is less than 0.40 seconds. The QTI is directly related to the heart rate.

                                                       7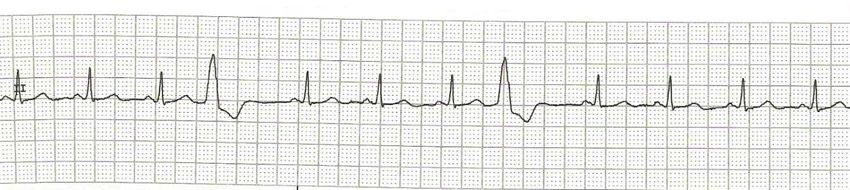
Normal Measurements of the QTI: 0.36-0.40
It is best to measure the QTI in a lead in which the T wave is most pronounced. The normal overall length
of the QTI should be equal to or less than ½ of the R-R interval.

Summary of Heart Measurements:
  x P-Wave: Upright in lead II
  x PRI: < 0.20 Sec
  x QRS: < 0.12 Sec
  x ST-Segment: Even with isoelectric line
  x T-Wave: Upright in lead II
  x QTI: < 0.40 Sec

                                                    8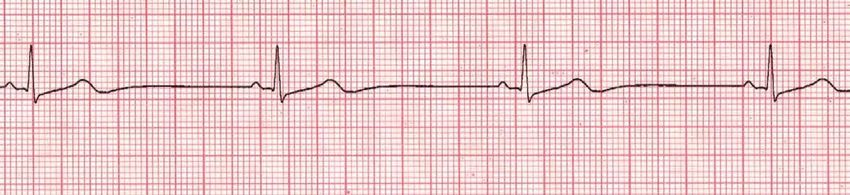
Rate Measurement
       The patient’s heart rate reveals a great deal of information. If the rate is slow (under 60 beats
per minute), we call it bradycardia. If the heart rate is fast (over 100 beats per minute), then it is called
tachycardia.

ECG monitors display the heart rate. When an ECG strip is printed, most printers provide heart rate
information at the top of the strip. Never the less, you might be in a situation where you must calculate the
heart rate from the ECG recording. There are numerous methods and formulas, which can be used to
calculate a heart rate from the ECG. Three methods for heart rate calculation are presented below.

The Six Second Method
This method can be used with either regular or irregular rhythms and provides a rough estimate (but not
precise) of heart rate. Print a 6 second strip (see text box if you are not sure how to do this). Count the
number of R waves in a 6 second strip and multiply by 10. For example, if there are seven (7) R waves in
a 6 second strip, the heart rate is
approximately 70 or (7x10=70). Let’s
give it a try. Look at the rhythm below
and count all the R waves.

Large Box Method

Count the number of large squares between two consecutive R waves. Divide this number into 300 for a
ventricular rate. For example, if there are four large squares between regular QRS complexes, the heart
rate is 75 (300/4=75).

For an atrial rate, count the number of large boxes between two consecutive P waves and also divide into
300.

Small Box Method

This method also uses an “R to R” or “P to P” measurement, but is more precise because we use the
smaller ECG boxes to help us calculate the heart rate. To calculate the ventricular rate, count the number
of small boxes between two consecutive R waves and divide by 1500. To calculate the atrial rate, count
the number of large boxes between two consecutive P waves and divide by 1500. For example, if there
are two small squares between regular QRS complexes, the heart rate is 75 (1500/20 = 75).

                                                        9
Quick Method (used when rhythm is regular)

Find an R wave that falls on a thick vertical line and count the number of boxes until the next R-
wave. The duration between two consecutive R-waves is referred to as the RR interval. Then use the
number range above, counting down for each large box.
 o 1 Box = 300 beats per minute (bpm)
 o 2 Boxes = 150 beats per minute (bpm)
 o 3 Boxes = 100 beats per minute (bpm)
 o 4 Boxes = 75 beats per minute (bpm)
 o 5 Boxes = 60 beats per minute (bpm)
 o 6 Boxes = 50 beats per minute (bpm)

                                                  10
Basic EKG Rhythm Analysis Guide
The ECG tracing provides a variety of clues as to what is happening within the heart. These clues include
heart rate, regularity or irregularity of the rhythm, interval measurements and characteristics of each
individual waveform. Think of the ECG strip as a unique fingerprint in which you are the detective
conducting the investigation. Like a detective, you will need to pay attention to details.
In addition to a detailed analysis, you will also need a “recipe” for ECG interpretation, just like a cook
needs a recipe for a complex dessert. If you follow the interpretation “recipe” each time you analyze a
strip, your skills will grow and your interpretations will be consistently accurate.
Remember to print a 6 second strip (or longer) each and every time you begin an interpretation. Follow
the six basic steps (your recipe) for rhythm interpretation.
When looking at a cardiac rhythm ask yourself the following questions.
1. Calculate heart rate
Calculate both the atrial and ventricular rates. Normally the atrial rate is the same as the
ventricular rate. Is this true in the ECG strip you are analyzing? Remember the normal heart rate
for most individuals falls between the range of 60-80 beats/minute.
Normal Findings: Abnormal Findings:
Ƈ7KH+5VKRXOGEHEHWZHHQ-80 Ƈ+HDUWUDWHVOHVVWKDQEHDWVPLQXWHDUH
beats/minute. typically labeled as slow or bradycardic.
Ƈ7KHDWULDOUDWHVKRXOGEHWKHVDPHDVWKH Ƈ+HDUWUDWHVJUHDWHUWKDQEHDWVPLQXWHDUH
ventricular rate. typically labeled fast or tachycardic.
2. Regularity of the rhythm
The assessment of the regularity of the rhythm - Is the rhythm regular or is it irregular?
To assess the regularity, you will need to place the legs of your calipers on two consecutive R
waves. This is your “R to R” or “R-R” interval. Without moving the width of the calipers, march
through the rhythm as you travel from R wave to R wave. If you do not have calipers, another
method to determine regularity is to make a small mark on a piece of paper over two consecutive
R waves, then move the paper to the next R wave and see if the dots line up/march out.
Do the R waves follow a regular pattern? If so, the ventricular rhythm is called regular rhythm.
Normal ECG rhythms are regular in their pattern.
If the R-R interval varies in the number of ECG small boxes between them, you are dealing with
an irregular rhythm. Do the same type of assessment with the atrial rhythm. Put your calipers at
the beginning (or upslope) of a P wave. Put the other end of your caliper at the beginning of the
next P wave or make a small mark on a piece of paper over two consecutive P waves. This is the
P-P interval. Lift your calipers and begin marching through the strip looking for the pattern of
regularity of the P waves. If the SA node is firing at a constant beat, the P-P interval will be
regular.
Do not estimate. Use an EKG caliber or paper.
11Normal Findings: Abnormal Findings:
The R-R intervals are regular. The R-R intervals are irregular
The P-P intervals are regular. The P-P intervals are irregular.
There is one P for every QRS. There is more than one P for each QRS.
Regular rhythm Irregular Rhythm
Very few rhythms are irregular. For example, atrial fibrillation is always irregular (more on this
rhythm later). Therefore, if your rhythm is regular it cannot be atrial fibrillation.
3. Examine P wave
First, you must go on a “P hunt” and find the P waves. Once you have identified them, assess their
characteristics.
Normal Findings: Abnormal Findings:
P waves should be regular (march out the P-P A P wave is not followed by a QRS complex.
intervals with your calipers).
P waves have a symmetrical shape, usually There are more P waves than QRS complexes.
upright and rounded completely dissociated
P waves should all look alike (uniform) and The QRS complexes are completely
should point in the same direction dissociated from P wave
There should be one P for every QRS (or a
1:1 relationship). The QRS associated with
P-waves
4. Measure PR interval
Remember that the P to R interval represents the time it takes an impulse to travel from the atria
through the AV node. The P to R interval is measured from the beginning of the P wave to the
beginning of the QRS complex. This is a bit confusing as you might think it is a measurement
from the beginning of the P wave to the beginning of the R wave.... but it is actually only
measured from the beginning P to the beginning of the Q wave. Think of it as a “P to Q
measurement” despite the fact that it is called a PR interval.
x
Normal Findings: Abnormal Findings:
The PR interval (or time travel from SA to The PR interval is > .20 seconds (this might
AV nodes) is between 0.12 to 0.20 seconds. indicate delayed travel time from SA to AV
node).
The PR intervals are constant throughout the The PR interval is irregular in measurement
rhythm. (irregular or varying PR intervals may indicate
some type of SA-AV conduction problem and
possible conduction heart block).
125. Measure QRS Complex
The QRS complex represents ventricular depolarization. The QRS complex consists of three
waves: the Q wave, the R wave, and the S wave. It is measured from the beginning of the Q wave
to the end of S wave. Normal ventricular conduction and depolarization takes no more than .12
seconds.
Normal Findings: Abnormal Findings:
All the QRS complexes have uniformity The QRS complexes vary in shape, width and
throughout (the same size, shape and direction.
direction).
All QRS complexes are of equal duration or The QRS complex is >.12 seconds wide.
width.
The R to R interval between each QRS is The R to R interval between each QRS is
regular. irregular.
6. Examine ST segment (should be isoelectric) & Examine T wave (upright, flat, inverted,
spiked)
Normal Findings: Abnormal Findings:
The ST segment should be electrically There is > 1mm ST segment elevation or
neutral (or near neutral) and should be depression from the isoelectric line.
sitting on the isoelectric baseline (no greater
than 1 mm above or below the isoelectric
line is normal).
The T wave is upright whenever the R The T wave is in the opposite direction than the
wave is upright. The T wave deflects R wave.
downward when the R wave is downward.
Rhythm Interpretation
Believe it or not, after completing Step 6, you are ready to make an educated decision on naming
the correct rhythm. Remember to correlate information obtained in Steps 1-6 along with your
understanding of the heart’s electrophysiology. Rather than pure memorization, if you can
integrate the electrophysiology with the rhythm interpretation your patient care priorities and
potential treatments will make a lot more sense.
Six Basic Steps for Rhythm Interpretation Summary
1. Rate (Calculate the heart rate (HR) or note the HR from the
2. Regularity (Measure the regularity or rhythm of the R waves)
3. P-wave Examination. Is there one P wave before each QRS? (there should be)
4. P to R interval (Measure the P to R interval - Is it within normal limits? It is consistent?)
5. QRS width (Measure the duration of the QRS complex)
6. Rhythm interpretation
13Nursing Priorities and Potential Treatments
(Pediatrics Nurses Required); All Other RNs Informational Only
Interpreting the actual ECG rhythm is only the beginning of the assessment and care for your
patient. You cannot be successful in your practice if you only know how to interpret ECG. As
healthcare provider, you must be able to respond with appropriate priorities and understand initial
treatments. Complete comprehensive treatments for each type of ECG rhythm are beyond the
scope of this review guide.
Nurses must make decisions about the patient’s treatment based on information obtained from the
electrocardiogram reading. They must have the ability to read the data quickly so that they can
begin medical interventions.
Bradycardia
Symptomatic bradycardia: Heart rate slower than normal for age orTachycardia
Tachycardia: Heart rate faster
than is normal for the child’s age.
Tachycardia with hemodynamic
instability signs are: altered LOC,
hypotension, poor cap refill, weak
pulses, respiratory failure
Sinus tachycardia- fast rate
depending on age & varies with
activity:
HR < 220 infants
HR < 180 children
Treatment: identify & treat
possible causes (hypovolemic, shock,
fever, anxiety, toxins)
SVT- Does not change with
activity. Common symptoms
are irritability, rapid
respirations, poor feeding, poor
cap refill, pallor, hypotension,
and diaphoresis.
+5LQIDQWV
+5FKLOGUHQ
Treatment: Determine if child is stable vs. unstable. If stable, attempt vagal maneuver (Ice to
face). If unstable do immediate synchronized cardio version.
Initial synch dose: 0.5-1 joule/kg, Subsequent synch doses: 2 joules/kg
Consult cardiology!! Get a 12 lead EKG but do not delay treatment to obtain EKG
For SVT resistant to vagal maneuvers: Adenosine 0.1mg/kg (max 1st dose 6mg) Rapid 2
syringe technique
VT with pulses-Wide QRS. Uncommon in children. HR Normal for age to >200. Treat
underlying causes: possibly due to hyperkalemia, hypocalcemia, hypomagnesaemia, toxins.
Treatment for stable VT w/monomorphic QRS:
Adenosine 0.1mg/kg IV/IO 1st dose (6 mg max)
Adenosine 0.2mg/kg IV/IO 2nd dose (12mg max)
Expert consultation
Amiodarone 5mg/kg over 20-60 minutes
-OR-
Procainamide 15mg/kg over 30-60 minutes
Unstable VT: Synchronized cardioversion 0.5 to 1 J/kg (may increase to 2j/kg if ineffective)
For VT refer to algorithms!!!
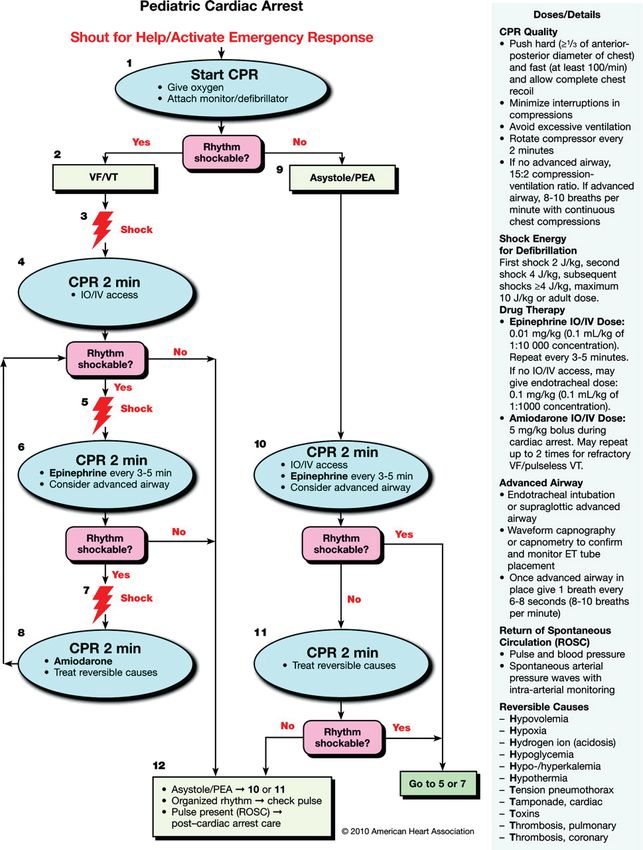
15Cardiac Arrest
Shockable rhythm: Pulseless VT or VF
Start CPR (at least 100 compressions/min with good chest recoil, change compressors Q2 mins)
Assess cardiac rhythm
Shock immediately if VT or VF (2 j/kg 1st dose) (4j/kg subsequent doses repeat every 2 minutes)
Epi 0.1ml/kg every 3-5 minutes
Amiodarone 5mg/kg
DEAD: Defib Epi Amiodarone Defib
Non-shockable rhythm: Asystole/PEA (NO defib…..NO Amio for Asystole or PEA!!)
Start CPR (at least 100 compressions/min with good chest recoil, change compressors Q2 mines)
Assess cardiac rhythm
Epi 0.1ml every 3-5 minutes
Identify & treat reversible causes:
H’s
Hypovolemia
Hypoxia
Hydrogen ion (acidosis)
Hyper-hypokalemia
Hypoglycemia
Hypothermia
T’s
Tension pneumothorax
Tamponade
Toxins
Thrombosis
Thrombosis
16Basic Characteristics of Cardiac Rhythms
P-R QRS
Dysrhythmia Rate Rhythm Comments
Interval Interval
Sinus 60-100 Regular 0.12-0.20 secP-R QRS
Dysrhythmia Rate Rhythm Comments
Interval Interval
Junctional 40-60 RegularTypes of Rhythm
Normal Sinus Rhythm
Rate: 60-100 BMP
PRI: .12-.20 sec
QRS: < .12
QT: < .40
Rhythm: Regular
Source of pacer: SA Node
Characteristics: Normal sinus rhythm (NSR) is the characteristic rhythm of the healthy human heart. NSR is
considered to be present if the heart rate is in the normal range, the P waves are normal on the ECG, and the rate
does not vary significantly. If, however, the R-R interval is variable, the rhythm is called sinus arrhythmia. The
normal heart rate has been considered to be between 60 and 100 beats/min. However, the range (defined by two
standard deviations from the mean) is between 43 and 93 beats/min in men and 52 and 94 beats/min for women
there is also important variability in age in young children. The normal heart rate is 110 to 150 beats/min in infants,
with gradual slowing over the first six years of life. The P waves are upright and precede the QRS complexes. The
PR interval is less than .20 seconds and the QRS complex is .06 - .12 sec.
Nursing Priorities: None
Potential Treatment: None
19Sinus Bradycardia
Rate: < 60 BPM
PRI: .12-.20 sec
QRS: < .12
QT: < .40 May be prolonged with excessively low heart rates.
Rhythm: Regular
Source of pacer: SA Node
Characteristics: This rhythm may be normal for well-conditioned athletes and during sleep. Sinus Bradycardia,
may be caused by several factors such as increased vagal tone from vomiting, bearing down to have a bowel
movement or from medications such as digitalis, calcium channel blockers, beta blockers and many other
antiarrhythmic medications Common with inferior wall MI, obstructive jaundice and increased intracranial pressure
(ICP).
Nursing Priorities: Check your patient’s blood pressure, assess for syncope, and SOB. Patient may need to lie
down to prevent potential falls. Keep in mind that it may be normal for some individuals to have sinus bradycardia
(e.g. athletes).
Potential Treatment: Treatment is only necessary if the patient is symptomatic. Atropine 0.5 –1.0 mg, to a
maximum of 3mg. Consider external transcutaneous pacing. Be prepared to assist the physician with the placement
of an external temporary pacer. Treatment of associated hypotension may also need to be addressed.
20Sinus Tachycardia
Rate: 100-150 BPM
PRI: .12-.20 sec
QRS: < .12
QT: < .40
Rhythm: Regular
Source of pacer: SA Node
Characteristics: Sinus tachycardia is a normal response to stress and exercise. If it is persistent, at rest it may
indicate a more severe underlying problem such as fever, dehydration, blood loss, anemia, anxiety, heart failure,
hypermetabolic states or ingestion of a significant stimulant such as cocaine or methamphetamine. Drugs that can
cause Sinus Tachycardia are atropine, isuprel, epinephrine, dopamine, dobutrex, norepinephrine, nipride and
caffeine. Sinus Tachycardia increases the hearts need for oxygen, decreases ventricular diastolic time and decreases
coronary artery perfusion. Reflexive Sinus Tachycardia is often seen in hypotensive patients, in an attempt to
maintain adequate blood pressure.
Nursing Priorities: Check your patient’s blood pressure, assess for syncope, palpitations, or SOB. Patient may
need to lie down to prevent potential falls. Patient may have lower B/P due to decreased diastolic ventricular filling
time associated with the tachycardia.
Potential Treatment: Asymptomatic: Observation. Symptomatic: Treat the underlying cause (dehydration, anxiety,
etc). Drugs such as beta blockers may be given to slow the HR.
The underlying cause must be identified and treated. Drugs that may be given to slow the heart are: digitalis, beta
blockers, calcium channel blockers, sedatives and various other antiarrhythmic medications.
21Supraventrical Tachycardia
(SVT)
(PSVT)
Rate: > 150 BPM
PRI: Usually < .12 sec
QRS: Narrow, < .12 sec
QT: < .40 sec
Rhythm: Regular
Source of pacer: Atrial re-entry current
Characteristics: Tachycardias with a narrow QRS < .12 seconds and faster than 150 BPM do not originate from
the SA Node, since the upper limit rate for the SA NODE is 150. The rhythms can vary in name from
Supraventricular Tachycardia (SVT), Atrial Tachycardia, or a rhythm that may speed up and slow down called
Paroxysmal Atrial Tachycardia or Paroxysmal Supraventricular Tachycardia. If P waves are visible, the rhythm
may be called Atrial Tachycardia, if no P waves are visible due to a very fast rate, label the rhythm SVT.
The onset of PSVT/PAT is typically abrupt, with the onset being initiated by a premature atrial beat. The
arrhythmia may self-terminate in a few minutes to a few hours.
Nursing Priorities: Check your patient’s blood pressure, assess for syncope, palpitations, or SOB. Patient may
need to lie down to prevent potential falls. Patient may have lower B/P due to decreased diastolic ventricular filling
time associated with the tachycardia.
Potential Treatment: Asymptomatic: Observation. Symptomatic: Cardioversion, Carotid sinus massage
Valsalva maneuver, IV adenosine, IV Verapamil, Oral anti-coagulants for stroke prevention Identify and treat cause
22Premature Atrial Contractions (PACs)
Rate: Typically normal
Rhythm: Underlying rhythm is typically regular with early premature beats
P waves: Atrial depolarization is premature, occurring before the next normal P wave. Since the impulse originates
outside the SA node, the P wave may have a different shape - often notched, peaked or buried in the proceeding T
wave
PR Interval: Maybe normal, shorter or longer than normal PR interval, depending on origin of the PAC
QRS Width: typically normal but may be prolonged if the PAC is aberrantly conducted through the ventricles
Characteristics: The intrinsic pacemaker of the heart is the sinus (SA) node, and normally it initiates each beat.
Pacemaker stimuli can also arise from other parts of the heart – the atria, the AV junction, or the ventricles. The
terms “ectopy” or “ectopic beat” are used to describe these non-sinus beats. Ectopic beats are often premature; that
is, they come in early or before the next sinus beat is due.
A premature atrial contraction results from an ectopic stimulus that arises from somewhere in either the left or the
right atrium, but not in the sinus node. The atria are depolarized from the ectopic stimulus, but the remainder of the
conduction is typically normal through the AV Node-Junction and downward into the bundle branches (i.e. normal
PR and QRS morphology and intervals).
Possible Causes: PACs are very common and may occur in persons with a normal heart or in persons with virtually
any type of organic heart disease. PACs do not imply that a person has cardiac disease and may be seen with
caffeine intake and with emotional stress. Other causes include: Administration of sympathomimeticagents
(epinephrine, theophylline; Electrolyte abnormalities; Myocardial ischemia or injury; Digoxin toxicity;
Hyperthyroidism
Other Types of PACs: There are a few variations from the above description. On occasion, a PAC may not
conduct into the ventricles or the PAC may conduct into the ventricles in an abnormal way.
Nonconducted PACs: If the PAC occurs very prematurely (or close to the preceding T-wave), the early atrial
depolarization might be too early for the right and left bundles to conduct the impulse. This type of PAC cannot be
conducted down into the ventricles. In this situation, look for an early P wave (which might also be buried in the
preceding T wave). The early PAC does not conduct into the ventricles, thus there is no QRS for this one cardiac
cycle.
Aberrantly conducted PACs: If the impulse should happen to travel abnormally through the ventricles, the QRS
may be prolonged. This can happen if either the right or left bundle branches are not ready to depolarize and result
in a temporary block. If the QRS is wide following a PAC, it will be called an aberrantly conducted PAC.
Nursing Priorities: Intervention not typically required; Heart rate may be irregular during episodes of PACs so
assess the pulse for one full minute
Potential Treatments: Asymptomatic: Observation and ECG monitoring for frequency and trends. Explore
potential underlying causes (caffeine intake, stress reduction, myocardial abnormalities, etc).
Symptomatic: Treatment is typically centered around observation and monitoring for increased frequency. • Be
aware that individuals may complain of palpitations or feeling a “skipped” heart beat with an irregular pulse.
Explain to them the reason for these feelings. Increased number of PACs may be a forerunner of the development
of atrial fibrillation or other atrial dysrhythmias.
23Atrial Fibrillation
Rate: Variable
PRI: None
QRS: < .12 sec
QT: < .40
Rhythm: Irregular
Source of pacer: Atrial
Characteristics: Atrial fibrillation is caused by chaotic ectopic or reentry current activity, which causes the atria to
quiver rather than contract. The atria quiver at a high rate producing the fuzzy and garbled wave forms seen where a
flat isoelectric line should be. Atrial fibrillation can generate a ventricular response rate that is controlled or very
fast and can place the patient at risk for hemodynamic instability.
Cardiac output is reduced with the loss of “Atrial Kick” since the atria are not contracting. The ventricular rate my
also be very fast resulting in further decreased cardiac output. In addition, since the atria are not contracting, the
patient is at risk for the formation, of emboli leading to pulmonary embolism or stroke.
Causes: MI, Rheumatic heart disease, COPD, CHF, ischemia chest trauma, CAD and open-heart surgery.
Treatment: Treatment may very. If this is an acute arrhythmia, the patient may be cardioverted, or treated with
beta-blockers, calcium channel blockers, digoxin, amiodarone or procainamide. If this is a chronic rhythm that
would not convert with cardioversion or medications, it is important that the patient be evaluated and possibly
placed on anticoagulation medication before discharge home.
24Atrial Flutter
Rate: Atrial rate is 250-350 bpm. Ventricular rate varies according to AV node conduction.
Rhythm: Atrial regular; ventricular may be regular or irregular (again, depending on AV node conduction).
P waves: Absent. Only flutter or saw tooth looking waveforms
PR Interval: Not applicable
QRS Width: VHFRQGV
Characteristics: Atrial Flutter is a dysrhythmia, which is the result of a flawed reentry circuit within the atria. It is
often described as resembling a sawtooth or picket fence. These flutter waves should not be confused for P waves.
The AV node is a wonderful protective mechanism. Imagine the atria depolarizing at a rate of 250 to 350 bpm. If all
of these atrial depolarizations were conducted down into the ventricle, the patient’s ventricles would likely begin to
fibrillate. Think of the AV node as the central train station where numerous train tracks merge. The central station
only lets some of the trains through to avoid congestion. The AV node helps to protect the ventricles by only
allowing some of the atrial depolarizations to conduct down through the bundle of His into the bundle branches and
on to the ventricles. When the ventricular rate is < 100 bpm, we call this “controlled atrial flutter.” If the ventricular
rate is > 100 bpm, it is labeled “uncontrolled atrial flutter.” Since the ventricles always have more time to fill during
diastole when the HR is under 100, our goal is to have controlled atrial flutter. This can often be accomplished with
drug therapy. In the setting of atrial flutter, coordinated contraction of the atria is absent. The patient has therefore
lost their atrial kick with potential loss of cardiac output and lower blood pressure.
Causes: Acute or chronic cardiac disorder, mitral or tricuspid valve disorder, cor pulmonale, pericarditis, Post MI
complication (usually transient), Hyperthyroidism, Alcoholism, Post cardiac surgery (usually transient)
Nursing Priorities: Check your patient’s blood pressure, assess for syncope, palpitations, or SOB.
Your patient may need to lie down to prevent potential falls.
Patient may have lower B/P due to loss of atrial kick.
Potential Treatments
Asymptomatic: Observation and rate control.
Normal heart function: control ventricular rate by administering beta blockers (esmolol) or calcium channel
blockers (diltiazem or verapamil).
Impaired heart function: control ventricular rate by administering digoxin, diltiazem, or amiodarone.
Symptomatic: If hemodynamically unstable, synchronized cardioversion at 100-200 monophasic joules.
25Junctional Rhythm
Rate: 40-60 BPM
PRI: Absent or variable
QRS: Usually < .12 may be wider depending on pacer site.
QT: < .40 may be prolonged with slower heart rates
Rhythm: Regular
Source of pacer: AV Node/Junction/Bundle of HIS
Characteristics: The AV node is a group of specialized cells and its main function is to delay impulses coming
from the atria to ventricles, thereby allowing the atria more time to completely contract. Between the AV node and
the right and left bundle branches lies the Bundle of His. The area around the Bundle of His is also called the AV
junction (where the AV node and the bundles junction together). This AV junction can function as a pacemaker. It
initiates impulses at a rate of 40 to 60 beats per minute. Under normal circumstances, the sinus node pacemaker is
faster and predominates. If the AV node is not depolarized by the arrival of a sinus impulse within approximately
1.0 to 1.5 seconds, it will initiate an impulse of its own from this junctional area. This is called a junctional escape
complex. It occurs because of failure of the sinus node to initiate an appropriately timed impulse or because of a
conduction problem between the sinus node and the AV junction. A repeated series of such impulses is referred to
as a junctional escape rhythm.
Unusual or Absent P waves: If the AV junction paces the heart, the atria may or may not be stimulated. The
electrical impulse must travel in a backward (retrograde) direction to activate the atria. In Leads II, III, and aVF, the
P wave will be negative (inverted) if the atria are stimulated. Depending on how the atria responds to the junctional
pacemaker, the patient could have a) no P waves; b) an inverted P wave (upside down just preceding the QRS); or
c) an inverted P wave after the QRS (if atrial depolarization occurs after the QRS)..
Causes: Electrolyte imbalance, sick sinus syndrome, digitalis toxicity, interior-wall MI, rheumatic heart disease,
hypoxemia.
Nursing Priorities: Check your patient’s blood pressure, assess for syncope, palpitations, or SOB. Lower blood
pressure may result from loss of atrial kick and bradycardic
Potential Treatments: Observation, Find and treat reversible causes, temporary or permanent pacer, atropine 0.5 –
1.0mg may cause the SA Node to overdrive the AV Node and increase the heart rate. Treatment is only needed if
the patient is hypotensive or presents with hemodynamic instability.
26Accelerated Junctional Rhythm/Junctional Tachycardia
Accelerated Junctional Rhythm
Rate: 60-100 bpm (Remember: if Heart Rate is > 100 it is called Junctional Tachycardia)
Rhythm: Ventricular rhythm is regular
P waves: may be absent or may occur before, during or after the QRS (due to retrograde conduction)
PR Interval: None (impulses are originating from the junction, not the SA node)
QRS Width: VHFRQGV WKHLPSXOVHLVWUDYHOLQJGRZQWKHQRUPDOSDWKZD\VRIWKHULJKWDQGOHIWEXQGOHV
Characteristics: The AV junctional area can “speed up” and pace at a rate faster than 40-60 beats per minute. For
all of the same reasons a person might experience a junction escape rhythm, a person might also experience
enhanced automaticity of the AV junction area. The result is a junctional rhythm, which depolarizes at a rate of 60-
100 bpm. This is an Accelerated Junctional Rhythm. If the rate is greater than 100 bpm the rhythm is called
Junctional Tachycardia (see above). It might be tempting to call the ECG tracing a normal sinus rhythm, but make
note that uniform looking P waves are absent along with a constant PR interval. The SA node is not working and
the junction has taken over as the pacer, only a bit faster than its normal intrinsic rate of 40-60 bpm.
Possible Causes of Accelerated Junctional Rhythm: Digoxin toxicity (most common cause), Hypoxia,
cardiomyopathy, MI, and/or Valve replacement surgery
Nursing Priorities: Check your patient’s blood pressure, assess for syncope, palpitations, or SOB. Lower blood
pressure may result from loss of atrial kick.
Potential Treatments: Asymptomatic: Observation. Symptomatic: Discontinue digoxin therapy. Check potassium
levels. If heart rate becomes faster (100-180 bpm) the rhythm is called Junctional Tachycardia. Now consider
treatment with IV amiodarone, beta-adrenergic blockers (Esmolol, Labetalol, Metoproplol), or calcium channel
blockers.
Junctional Tachycardia
27Atrioventricular Blocks
Atrioventricular blocks (otherwise known as heart blocks) can be divided into three degrees. First-degree heart
blocks are characterized by P to R intervals longer than 0.20 seconds. Second-degree heart blocks are characterized
by some P waves being blocked at the AV node. This results in some P waves occurring without following QRS
complexes. Third-degree heart block is characterized by a complete dissociation between P waves and QRS
complexes.
Nursing Tip: A hint for separating the heart blocks into degrees is that first- and third- degree blocks usually
have regular QRS rates.
Differences Between First-Degree, Second-Degree, And Complete Heart Block
Type of heart block
Feature First degree Second degree, Mobitz Second degree, Mobitz type 2 Complete or third degree
type 1 (Wenckebach)
Electrocardiographic
appearanceb
Rate Generally at intrinsic rate of Atrial rate generally at Atrial rate generally at intrinsic Atrial rate and the
60/min to 100/min intrinsic rate of 60/min to rate of 60/min to 100/min. ventricular rate are always
May be slower 100/min. Ventricular rate Ventricular rate depends on different; atrial is faster
depends on number of number of impulses conducted than ventricular.
impulses conducted through through atrioventricular node:
atrioventricular node; will may intermittently be the same
be slower than atrial rate as atrial rate when impulses are
being conducted. Ventricular
rate will be slower than atrial
rate when impulses are blocked
Regularity of atrial Regular Regular Regular Regular
rhythm
Regularity of Regular Regularly irregular Regularly irregular or irregularly Regular with ventricular
ventricular rhythm irregular rate slower than atrial
Rate. May become
irregular as heart becomes
ischemic
P wave P to P wave is constant P to P wave is constant P to P wave is constant P to P wave is constant but
P waves may be
difficult to see if buried in
the QRS complex or T
wave
P:QRS ratio 1:1 1:1 until block occurs, then 1:1 until block occurs, then 2 or Variable, more P waves
a P wave with a pause more P waves that are followed than QRS complexes
absent of a QRS complex, by a pause without QRS
then cycle restarts with a P complexes. 1:1 conduction may
wave and associated QRS recur or may progress to
complex ventricular asystole or complete
heart block
PR interval (the Constant PR interval but Variable: PR interval PR interval remains constant PR interval is not
primary clue to the prolonged >0.20 s or progressively lengthens until until a block occurs and the QRS consistent. Impulses are
degree of heart block) 200 ms a QRS complex is dropped complex is dropped, resulting in not conducted from the
A pause follows the dropped a pause. When or if conduction atria to the ventricles.
QRS complex, then PR resumes, the PR Visually the PR interval is
interval resets to shorter interval remains constant not constant and does not
interval and the cycle progressively lengthen, “no
repeats, very cyclic pattern”
QRS width Normal1st Degree AV Block
Rate: Variable
Rate: Varies depending on the underlying rhythm
PRI: .20 sec
QRS: .12
QT: < .40 May be longer with slower heart rates.
Rhythm: Atrial and Ventricle regular
Source of pacer: SA Node
Characteristics: First-degree AV block is simply a delay in passage of the impulse from atria to ventricles. Unlike
its name (which can be confusing), first-degree AV block is not an actual “block,” but rather a delay in conduction.
This conduction delay usually occurs at the level of the AV node. Remember that in normal sinus rhythm, the time
LWWDNHVWKH6$QRGHWRILUHGHSRODUL]HWKHDWULDDQGWUDQVPLWWRWKH$9QRGHLVVHFRQGV,QILUVWGHJUHH$9
EORFNWKHSDWLHQWKDVD35LQWHUYDORIVHFRQGV,IWKHSDWLent’s underlying rhythm is sinus bradycardia, but the
PR interval is .24 seconds, the interpretation would be “sinus bradycardia with a first-degree AV block.”
Causes: Acute inferior MI, right ventricular infarction, increased vagal tone, ischemic heart disease, digitalis
toxicity, beta-blockers, amiodarone, calcium channel blockers, electrolyte imbalances, rheumatic heart disease or
myocarditis.
Nursing Priorities: Observe for lengthening PR intervals or development of more serious heart blocks.
Potential Treatment: Treatment for first-degree heart block is usually unnecessary as it is typically, asymptomatic.
Treatment typically aims to correct the underlying cause. Consult with physician if PR interval is lengthening.
Discuss holding medications which slow A-V conduction.
292nd Degree AV Block (Mobitz Type I, Wenckebach)
Rate: Atrial regular; Ventricular rate is slightly slower. Typically between 60-90 bpm
Rhythm: Atrial regular. Ventricular irregular due to dropped P waves.
P waves: Upright and normal. Some P’s are not followed by a QRS (more Ps than QRSs)
PR Interval: Progressively longer until one P wave is not followed by a QRS complex. After the blocked beat, the
cycle starts again
QRS Width: VHFRQGV
QT: < .40 May be longer with slower heart rates.
Characteristics: Second-degree AV block- Type I is unique in that it has three different names, and all three are
used interchangeably (just to keep us all on our toes!). Second degree AV Block- Type I is also called Mobitz I or it
can be referred to as Wenckebach. Do not let this confuse you as all three names mean the SAME rhythm. For
simplicity, we will call this rhythm “Wenckebach.” Wenckebach is characterized by a progressive prolongation of
the PR interval (so the key to diagnosing this rhythm is by careful examination of each PR interval). The SA node
is healthy and fires on time, thus the P to P intervals are regular. Impulses traveling through the AV node take
longer and longer to fully conduct until one impulse is completely blocked. The SA node continues to fire right
on time (regular P to P intervals) and the cycle of prolongation of PR intervals continues as the pattern is repeated.
The repetition of this pattern results in “group beating,” (e.g. three conducted sinus beats with progressively
lengthening PR intervals and a fourth sinus beat that is NOT followed by a QRS). Beats that are successfully
conducted have a normal QRS width. Because QRS complexes are periodically dropped, the ventricular rhythm is
irregular. This block almost always occurs at the level of the AV node (rarely at His bundle or bundle branch
level), is typically a transient rhythm, and prognosis is good.
Causes: Acute inferior MI, right ventricular infarction, increased vagal tone, ischemic heart disease, digitalis
toxicity, beta-blockers, amiodarone, calcium channel blockers, electrolyte imbalances, rheumatic heart disease or
myocarditis.
Nursing Priorities: Check the patient’s blood pressure and other patient vital signs (often they are normal). Assess
the patient for possible causes.
Potential Treatment: Most of the time this rhythm produces no signs and symptoms and requires no treatment. If
needed 2nd degree Type I AVB will respond to atropine if the patient becomes bradycardic and hypotensive.
Temporary pacing should also be considered. Find and treat reversible causes, and observe for progression into
higher forms of block.
302nd Degree AV Block (Mobitz Type II)
Rate: Atrial regular. Ventricular rate is typically ¼ to ½ the atrial rate (depending on the amount of blockage in
conduction)
Rhythm: Atrial regular (P-P is regular). Ventricular irregular
P waves: Upright and normal. Some Ps are not followed by a QRS (more Ps than QRS)
PR Interval: The PR interval for conducted beats will be constant across the strip
QRS Width: VHFRQGVIRUFRQGXFWHGEHDWV
QT: .40 May be longer with slower heart rates.
Source of pacer: SA Node
Characteristics: Second degree AV blocN7\SH,,LVDOVRUHIHUUHGWRDV0RELW],, RQO\WZRQDPHVWKLVWLPHſ
This form of conduction delay occurs below the level of the AV node, either at the bundle of His (uncommon) or
the bundle branches (common). A hallmark of this type of second-degree AV block is that there is a pattern of
conducted P waves (with a constant PR interval), followed by one or more non-conducted P waves. The PR interval
does not lengthen before a dropped beat. Remember that the P waves that are successful in conducting through have
a constant PR interval. Since the SA node is firing in a regular pattern, the P to P intervals again march through in a
regular pattern (P-P is regular). Since not all P waves are conducted into the ventricles, the R to R intervals will be
irregular and the ventricular response (HR) may be in the bradycardia range. When the block occurs at the bundle
of His, the QRS may be narrow since ventricular conduction is not disturbed in beats that are not blocked. If the
blockage occurs at the level of the bundle branches, conduction through the ventricles will be slower therefore
creating a wider QRS complex (>.12 seconds).
Mobitz II is associated with a poorer prognosis, and complete heart block may develop. Causes are usually
associated with an acute myocardial infarction, severe coronary artery disease or other types of organic lesions in
the conduction pathway. The patient’s response to the dysrhythmia is usually related to the ventricular rate.
The QRS complex is typically abnormal (wider than .12 seconds) due to the bundle branch block. The block may
be in a ratio of 2:1 (two P waves for every QRS), 4:3, 3:2.
Causes: Can be caused by damage to the bundle branch system following an acute anterior AMI. This is not caused
by medications or increased vagal tone
Nursing Priorities: Check the patient’s blood pressure. Assess the patient’s symptoms. Note: Mobitz II has the
potential to suddenly progress to complete heart block or ventricular standstill; have a temporary pacemaker
nearby!
Potential Treatment: Asymptomatic: Observation and monitoring only. Hold drugs that can slow AV node
conduction. Notify physician. Obtain supplies for pacing should this become necessary. Symptomatic: If
symptomatic bradycardia is present, apply transcutaneous pacemaker and collaborate with physician for insertion of
transvenous pacer wire. Administer a dopamine infusion if patient is hypotensive. Note: Atropine must be used
with great caution (if at all) with this rhythm. Atropine will increase the sinus note discharge, but does not improve
conduction through the AV node, (the location of this block is lower in the conduction system). Acceleration of the
atrial rate may result in a paradoxical slowing of the ventricular rate, thereby decreasing the cardiac output.
313rd Degree AB Block / Complete Heart Block
Rate: Atrial rate is normal. Ventricular rate is slower. 40-60 bpm if back-up pacer is from the junction or 20-40
bpm if back-up pacer is from the ventricles
PRI: No relationship between P waves and QRS complex.
QRS :LGWK
VHFRQGVLIFRQWUROOHGE\WKHMXQFWLRQ
!VHFRQGVLISDFHGE\WKHYHQWULFOH.
QT: May be < .40 seconds if it is a junctional rhythm or may be wider (> .40 sec) with slower ventricular rhythms.
P waves: Upright and normal.
Rhythm: Rhythm: P-P is regular; R-R is regular (but the two are independent functions)
Source of pacer: Variable. Will be below the atria, since the connection between the SA Node and AV Node has
been severed. Usually Junctional or Ventricular in origin.
Characteristics: Third-degree AV block is also called complete heart block. This type of dysrhythmia indicates
complete absence of conduction between atria and ventricles (the atria and the ventricles are not communicating
with one another). The atrial rate is always equal to or faster than the ventricular rate in complete heart block. The
block may occur at the level of the AV node, the bundle of His, or in the bundle branches. As in second-degree AV
block, this distinction is not merely academic since pathogenesis, treatment, and prognosis may vary considerably,
depending on the anatomic level of block.
When third-degree AV block occurs at the AV node, a junctional escape pacemaker frequently will initiate
ventricular depolarization. This is usually a stable pacemaker with a rate of 40 to 60 beats per minute. Since it is
located above the bifurcation of the bundle of His, the sequence of ventricular depolarization usually is normal,
resulting in a normal QRS. This type of third-degree AV block can result from increased parasympathetic tone
associated with inferior infarction, from toxic drug effects (e.g., digitalis, propranolol), or from damage to the AV
node.
When third-degree AV block occurs below the junction, it is most often due to a block involving both bundle
branches. The only escape mechanism available is in the ventricle distal to the site of block. Such a ventricular
escape pacemaker has an intrinsic rate that is slow, less than 20-40 beats per minute. Like any depolarization
originating in a ventricle, the QRS complex will be wide. It is not a stable pacemaker, and episodes of ventricular
asystole are common.
Remember that the rhythm strip reflects two separate processes that are taking place. The SA node continues to
control the atria and typically fires at a rate of 60-80 bpm. Since the atria and the ventricles are not communicating,
one of the two remaining back-up intrinsic pacemakers will take over. Either the junction will pace the ventricles
(rate 40-60 bpm) or the back-up ventricular pacer will discharge (rate 20-40 bpm).
When there are two separate pacemakers controlling the upper and lower chambers of the heart without regard to
each other, the situation is called AV disassociation (this is not a “rhythm” but a “condition” and the umbrella term
AV disassociation is often used).
On the ECG, you will see normal P waves marching regularly across the strip. The P-P intervals are regular. You
will also see QRS complexes at regular intervals. The unique feature is that the P waves and the QRS complexes
will not be “talking to each other.” There is no relationship between the P and the QRS waveforms. The PR interval
will be totally inconsistent and you may even see P waves superimposed in the middle of QRS complexes.
There will be more P waves than QRS complexes (because the intrinsic rate of the sinus
32You can also read