Economic and Strategy Viewpoint - January 2019 - For professional investors and advisers only - Fundresearch
←
→
Page content transcription
If your browser does not render page correctly, please read the page content below
For professional investors and advisers only.

Economic
and Strategy
Viewpoint
January 2019
3
2018 review: A tough year for investors
– We look back at a year full of challenges for investors as trade wars came into effect
and Europe endured a mini Italian debt crisis, while parts of the emerging markets
were hit by tighter dollar liquidity and political risk.
– 2018 was a poor year for investors as both US equities and Treasuries
underperformed cash – a very rare event. Away from the US, there were places
to hide in other developed market government bonds, along with safe haven
Keith Wade
currencies like the Japanese yen and the Swiss franc. The Mexican peso was also
Chief Economist and
an unlikely winner in 2018.
Strategist
13
(44-20)7658 6296
Three themes for 2019 and some black swans
– Growth concerns and tightening liquidity weighed on markets in 2018 and look set
to continue in 2019. As the European Central Bank ends QE, we estimate that global
liquidity will contract further this year, keeping pressure on some of the riskier areas
of finance.
– Investors will look for governments to boost growth through fiscal policy and in
emerging markets will seek relief from a stronger dollar as the Fed brings the
tightening cycle to a close. We also note that following the de-rating at the end of
Azad Zangana 2018, equity markets are better positioned for disappointment than a year ago.
Senior European Economist
– Black swans include another eurozone crisis, the UK remaining in the EU, military
and Strategist
action and Trump not running for re-election.
(44-20)7658 2671
Chart: Both bonds and equities underperformed in 2018
Equity returns distribution Bond returns distribution
2012
2015 2004
2011 2016 Positive years : 108 (73%) 2001 Positive years : 100 (85%)
2007 2014 Negative years : 40 (27%) 2017 1983 Negative years : 18 (15%)
2005 2012 2016 1974
1994 2010 2015 1973
1992 2006 2006 1964
1987 2004 2005 1954
1984 1993 2017 2003 1949
1978 1988 2009 1996 1948
1970 1986 2003 1980 1939
1960 1979 1999 1979 1938
2018 1956 1972 1998 1977 1935
Craig Botham
2000 1948 1971 1996 1972 1930 2010
1990 1947 1968 1983 1968 1929 2007
Emerging Markets
1981 1923 1965 1982 1965 1923 1992
1977 1916 1964 1976 2013 1963 1920 1990
Economist 1969
1962
1912
1911
1959
1952
1967
1963
1997
1995
1961
1953
1918
1917
1988
1981
(44-20)7658 2882 1953 1906 1949 1961 1991 2018 1952 1916 1975
2001 1946 1902 1944 1951 1989 1987 1946 1915 1966
1973 1939 1899 1926 1943 1985 1978 1944 1914 1957
1966 1934 1896 1921 1942 1980 1967 1943 1913 1945 2014
1957 1932 1895 1909 1925 1975 1959 1942 1912 1940 2002
1941 1929 1894 1905 1924 1955 1958 1941 1911 1936 2000
1940 1914 1892 1901 1922 1950 1956 1937 1910 1934 1998
1920 1913 1889 1900 1919 1945 1955 1933 1908 1932 1997
2002 1903 1910 1888 1897 1918 1938 1958 2013 1951 1928 1906 1927 1993 2011
1974 1893 1887 1882 1886 1898 1936 1935 2009 1950 1909 1905 1926 1984 1991
1930 1890 1883 1881 1878 1891 1927 1928 1999 1947 1907 1903 1925 1971 1989 2008
2008 1917 1884 1877 1875 1872 1885 1915 1908 1954 1994 1931 1904 1901 1924 1960 1976 1995
1931 1937 1907 1876 1873 1874 1871 1880 1904 1879 1933 1969 1919 1902 1900 1922 1921 1970 1986 1985 1982
-50 to -40 -40 to -30 -30 to -20 -20 to -10 -10 to 0 0 to 10 10 to 20 20 to 30 30 to 40 40 to 50 50 to 60 -10 to -5 -5 to 0 0 to 2.5 2.5 to 5 5 to 10 10 to 15 15 to 20 20 to 25 25 to 30 30 to 35
Total Return, % Total returns, %
Note: Equity total returns using S&P500 from 1873, and bond total returns taken from US 10-year
Piya Sachdeva Treasuries from 1900. Source: Thomson Reuters Datastream, Global Financial Data, Schroders
Economics Group, 2 January 2019.
Japan Economist
(44-20)7658 6746
Economic and Strategy Viewpoint January 2019 22018 review: A tough year for investors
“If you can look into the seeds of time, and say which grain will grow and
which will not, speak then unto me.”
Banquo in Macbeth by William Shakespeare, 1606.
At this time of year, we like to take a step back and review the performance of markets
and the lessons we can learn for the coming year. 2018 began much as 2017 had
ended. Risk assets continued their march upwards, while government bonds
continued to see selling and rising yields. Though there had been plenty of political
noise in 2017, investors managed to navigate the Twitter minefield and continue to
push equities higher.
However, by February of last year, investors started to lose their nerve. Political noise
was turning into action, notably with the introduction of tariffs which marked the
start of the US-China trade war. It was a poor year for investors who held almost
anything other than cash. Both equities and bonds generated negative returns, which
has only previously happened twice before since 1900.
Green shoots withered in spring
The year started The year began with the US federal government shutdown for two days as a result of
with a US federal a dispute over Deferred Action for Childhood Arrivals. A risk that is still live today for
government early 2019, and still linked to migration though this time through the infamous wall.
shutdown, A pugnacious US appeared willing to take on all comers, with trade tariffs applied to
followed by steel, aluminium, solar panels and washing machines early on. The EU, Canada and
around of tariffs China responded in kind. This would, however, prove only a taste of things to come,
started by the US with Washington releasing its first list of proposed China specific tariffs in April.
Elsewhere in the world, after months of negotiations, Angela Merkel's CDU/CSU
coalition agreed to re-establish their previous coalition government with the Socialist
party (SPD) following a failure to agree terms with the Green party and the centre
right Free Democrats (FDP). However, the reformation of the previous government,
which had performed so poorly in the 2017 election, led to a further deterioration in
poll ratings.
In emerging markets (EM), Jacob Zuma resigned as president of South Africa after
nine years in power after intense pressure from his own ANC party over corruption
allegations. His deputy, Cyril Ramaphosa, took over and helped to boost optimism,
supporting South African equities and the rand. However, it did not take long before
populist rhetoric about land expropriation started to hurt sentiment.
Russia saw fresh Hopes that a Trump presidency might ease pressure on Russia were dealt a blow as
sanctions in the country saw fresh sanctions. The botched assassination attempt of former
Russian double agent Sergei Skripal and his daughter Yulia led to chaos in the small
response to
English city of Salisbury, and later, the tragic death of a member of the public.
assassination
attempts in the UK Finally, the ominous beginnings of crises in Argentina and Turkey were apparent by
April, with currency weakness building as concerns mounted over government policy.
Summer sizzled with political heat
In May, after 88 days of negotiations, a new populist coalition government took
power in Italy. The right wing League party joined forces with the far left Five Star
Movement under an agreement to reverse recently introduced pension reforms, to
reduce migration, and to dramatically expand fiscal policy. Investors took fright,
causing Italian bond yields to rise sharply and Italian equities to fall in value.
Economic and Strategy Viewpoint January 2019 3Italian politics was June saw the first ever meeting between the leaders of the US and North Korea, at a
summit in Singapore. The summit resulted in a statement agreeing to the
heating up by the
denuclearisation of the Korean peninsula, new peaceful relations, and follow up talks.
summer, while
Talk of the Nobel Peace Prize followed, though President Trump would ultimately
North Korea was be disappointed.
coming in from
the cold Over the summer, Japan was struck by a series of natural weather disasters. A
combination of earthquakes, heavy flooding, extreme heat and typhoons caused
hundreds of casualties and economic activity to contract in the third quarter.
Mexico's election saw left wing populist Andres Manuel Lopez Obrador (AMLO)
emerge victorious. Earlier in the year concerns over an AMLO victory had weighed
somewhat on Mexican assets, but these worries seemed to have been set aside by
election day, with the stock market rallying on the back of the result. It was possibly,
optimism that AMLO would be more pragmatic than originally feared that drove the
rally, though events since then would suggest this was misplaced.
Autumn sees mixed trading and news
The UK government finally decided on what it wanted from the EU as part of its Brexit
negotiations. Dubbed the Chequers Agreement, Prime Minister Theresa May's plan
was meant to be a compromise between a soft and hard Brexit. However, few people
liked the plan (including the EU), leading to several high profile resignations from
her cabinet.
Australia’s former prime minister Malcolm Turnbull resigned from parliament at the
end of August, having lost support in the Liberal party. A week later, Scott Morrison,
the treasurer, won a close internal ballot and became the new prime minister.
In Europe, new emissions standards were introduced following the diesel emissions
scandal, applying to all new cars sold in September. This caused a huge backlog of
supply for manufacturers, with anecdotal evidence suggesting testing times taking
twice as long. European industrial production and retail sales slumped as a result,
causing more concerns over the state of the economy.
In Japan, Prime Minster Abe won his ruling party leadership election, keeping him on
track to become the longest serving PM in Japanese history. He reaffirmed his plan
to hike VAT to 10% in 2019, alongside announcing several measures to soften
the blow.
Argentina and The crises in Argentina and Turkey reached their denouement, with the former
Turkey returned to turning to the IMF for assistance and the central bank in the latter capitulating, with
a return to orthodox, and aggressive, monetary policy. Concerns do however remain
the spotlight for
about the policy intentions of Turkey's President Erdogan.
the wrong reasons
In a rare piece of good news, the replacement for NAFTA, called the USMCA, was
agreed on 1 October, ending months of uncertainty and putting to rest fears that
trade barriers would be erected between the North American nations.
An eventful winter puts risk assets in a deep freeze
As winter was beginning to set in, Italian politics returned to the fore. The coalition
government submitted its draft budget to the European Commission which included
a modest fiscal easing programme. The 2019 deficit target was lower than initially
thought in the summer, but still above the tolerance levels of the budgetary rules.
The Commission rejected the budget proposal and threatened to begin the process
that would eventually lead to penalties for Italy. However, just as the year was
drawing to a close, the Italian government sheepishly backed down and reduced the
deficit target to comply with the Commission.
Economic and Strategy Viewpoint January 2019 4By winter, Italy Elsewhere in Europe, President Macron hit a new low in opinion polls as the French
population fell out of love with the modern centrist reformer. Dubbed the “Emperor
was rowing with
of Europe”, his critics complained of a leader that was only interested in helping the
the European
rich. Tensions rose and spilled over into huge national protests under the “gilets
Commission, jaunes” (‘yellow vests”) movement, which were initially sparked in reaction to fuel duty
Macron was facing increases, but became a symbol of a greater populist revolt. Demonstrations and
the “gilets jaunes”, strikes disrupted output and hit tourism in the final quarter, but the damage will not
Theresa May was be clear until the new year.
fighting for
Across the border in Germany, the historic moment came when Chancellor Angela
survival
Merkel announced that she would step down as CDU party leader, and that she would
not contest the next federal election. An internal contest followed which resulted in
the election of Annegret Kramp-Karrenbauer as the new leader and default favourite
to become the next chancellor. Often referred to as “mini-Merkel” due to her close
relationship with the current chancellor, she is expected to allow Merkel to see out
her term, but begin to form a new vision for her potential leadership.
The frost melted away in the Brexit negotiations as the UK and EU agreed on the
terms of the Brexit divorce. The deal would lead to a transition period until the end
of 2020, with the future relationship yet to be negotiated. A backstop agreement was
bolted on to temporarily solve the Irish border issue; however, the clause which
requires a ‘mutual review mechanism’ to end the backstop met a frosty reception in
Westminster. So much so that Theresa May faced (and won) an internal party
leadership challenge, and in the end was forced to delay the parliamentary vote on
the agreement until the new year.
The “Trump of the Another market positive election in the Americas saw Jair Bolsonaro romping to
Tropics” stormed victory in Brazil's October election as the far right candidate defeated the
establishment parties on an anti-corruption platform. Markets are hopeful he will
to victory in Brazil,
deliver much needed pension reform, but time will tell whether he can build the
as the actual
political alliances necessary in a highly fragmented legislature.
Trump lost control
of the House of The US mid-term election results were largely as expected. The Democrats took
Representatives control of the House, but the Republicans retained control of the Senate. The result
meant that future fiscal easing is less likely unless it benefits Democrat supporters or
policies. A preview of the fight likely in 2019 began with yet another federal
government shutdown as Trump was denied funding for his “border wall”.
Just after the mid-term elections, President Trump sought a political ‘win’ on the
international stage at the G20 summit in Argentina, in the form of a temporary trade
truce with China. This delayed further tariff escalation by 90 days while the two sides
conduct further talks; existing tariffs remain in place. While a positive for market
sentiment, it was not immediately clear whether a compromise was feasible.
Central banks continued to tighten policy gradually
Central banks Monetary policy continued to be tightened over 2018 as the US Federal Reserve (Fed)
raised its interest rate target range four times to between 2.25-2.50%. Appointed in
were a rare source
February, new Fed chairman Jerome Powell continued along the same path as his
of stability and
predecessor, despite complaints from President Trump in the second half of the year.
consistency in In the last meeting of 2018, although the Fed lowered its forecast for future rate
2018, even if they increases, investors had been looking for a more soothing tone from its chairman.
were tightening Equity markets sold off sharply as Powell said in his press conference that he did not
policy see the central bank changing its “autopilot” policy in reducing the size of the Fed's
balance sheet.
Meanwhile, the European Central Bank (ECB) decided to taper its quantitative easing
programme through 2018, with an end to purchases in December. Though interest
Economic and Strategy Viewpoint January 2019 5rates remained unchanged, the Bank issued forward guidance that it expects interest
rates to remain unchanged at least through the summer of 2019. Watch this space.
The Bank of England managed to hike once this year, but uncertainty over Brexit
clouded the outlook. As for the Bank of Japan, policymakers widened the targeted
range of the 10-year government bond yield driven by concerns about the side effects
of prolonged monetary easing.
The People's Bank of China went against the global trend and eased policy, not by
The People's Bank
cutting rates but through further reductions in the reserve requirement ratio, which
of China bucked it cut 250 bps over 2018, and through open market operations.
the trend by
loosening policy, Most other emerging market central banks enacted rate hikes during 2018, in part as
though not by a reaction to the tighter policy emanating from the Federal Reserve. Deserving of a
special mention though is Turkey, where rates were hiked 1425 bps to 27% over the
cutting rates
course of the year, as the country's crisis escalated. In India, rates saw modest hikes
but the bigger news was the resignation of the central bank governor Urjit Patel in
December for “personal reasons” following disagreements with the government over
the transfer of central bank funds to the government's coffers and the central bank's
tough stance on asset quality issues across the financial sector.
Finally, there was a late surprise for investors as the Swedish Riksbank announced
that it would raise its main policy rate from -0.50% to -0.25% in January. Most
economists had not anticipated the move, but the policy committee noted that the
global economy is now entering a phase of more subdued growth and signalled that
it is in no rush to lift the rate into positive territory. Clearly it is still waiting for the ECB
to make its move.
Cross-asset performance comparison
Looking across the major asset classes, only US cash made a positive return (2%) in
2018. Yet again, commodities were the worst performing asset class (-11.2%), though
closely followed by the MSCI World equities index (-8.2%). The best non-cash asset
class was US Treasuries, although they too failed to generate a positive return as
interest rates rose (-0.1%).
With sentiment clearly poor, it was strange to see the lower risk investment grade
credit bonds (-3.5%) underperform their lower quality and riskier counterpart – high
yield bonds (-3.3%). It seems that reduced issuance by those companies that fall into
the high yield category helped support the asset class relative to investment
grade credit.
Lastly, gold also had a poor year as rising real interest rates sapped demand for the
precious metal (-1.7%).
Chart 1: 2018 Cross-asset performance (USD)
2018 was a tough
year for investors
as cash was the
only major asset
class to provide a
positive return
Source: Thomson Datastream, Schroders Economics Group. 2 January 2019.
Economic and Strategy Viewpoint January 2019 6The usual seasonal patterns failed to materialise in 2018. “Sell in May and go away,
come again on St. Leger Day” (12 September) has often helped investors avoid
summer sell-offs, which are often linked to a lack of liquidity during a quieter trading
environment. However following the old adage would have cost investors a further
3.5 percentage points loss on holdings in the MSCI World equity index (in addition to
the actual 8.2% loss).
Moreover, many investors were left disappointed in December as the “Santa rally”
also failed to materialise. In fact, December 2018 was the worst December
performance for the MSCI World equity index on record (since 1970). Had investors
simply sold at the end of November, they would have avoided the 7.6% loss that
followed. The next biggest December decline was in 2002 (-4.8%). Paying greater
attention to events rather than seasonal patterns would have helped greatly last year.
When comparing the performance of US equities and Treasury bonds against their
2018 was only the
history, the S&P500 posted a negative and below average return (data since 1873 –
third year since
see chart on front page) while Treasuries also had a negative and below average year
1900 where both (data since 1900 – chart on front page).
US equities and
Treasuries Though there were both optimists and pessimists at the start of 2018, we doubt
generated a anybody predicted that both equities and government bonds would have generated
negative returns. In fact, 2018 was only the third year since 1900 where both equities
negative return
and bonds underperformed cash. The previous two occasions were in 1931, towards
the start of the Great Depression, and in 1969, the year of the start of the Vietnam
war and the last time there was a big fiscal stimulus during a period of expansion.
Comparing equity market performance
2018 was a poor year for equity investors, with all major indices netting a loss when
In equity markets,
cast in both local currency and US dollar terms. The best performer was the US
the US NASDAQ
NASDAQ index (-2.8%). This came despite a strong start to the year thanks to what
was the best of a seemed to be the unsinkable FAANG stocks (Facebook, Apple, Amazon, Netflix,
poor bunch, but Google – now Alphabet). A simple average price index of the five tech giants was up
the German DAX 43.4% on 30 August, but ended the year only up 6.9%. Data breaches and flagging
was the worst sales hit the five, which were trading on gravity defying multiples to begin with.
performer
The worst performer of all was the German DAX30 index, down -18.3% in local
currency and -23.1% in US dollars (USD). The German index suffered from being both
a cyclical index, but also by having a relatively high level of exposure to Asia, which
was suffering from the trade war.
The less cyclical European indices fared better, including the French CAC40 (-8% in
local currency and -12.8% in USD) and the UK FTSE All-Share (-9.5% in local currency
and -15.3% in USD).
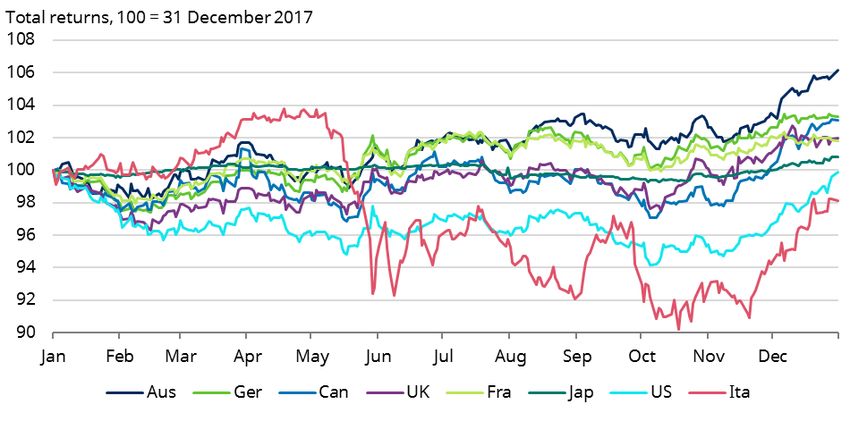
Economic and Strategy Viewpoint January 2019 7Chart 2: Equity markets performance (total returns in USD)
Source: Thomson Reuters Datastream, Schroders Economics Group. 2 January 2019.
In emerging markets (EM), while the overall index was down 14.3%, this masked
considerable dispersion, particularly in dollar terms. Turkey was the year's worst
performer, thanks to a collapse in the lira, with equities losing investors 57.6% in
dollar terms. The best performing market, Brazil, was still down for the year, but only
just at a less painful 0.2%.
The dominant common theme for EM equities in 2018 was trade wars,
as demonstrated by chart 3 below. Taking April, when the US first mooted
China-specific tariffs, as a starting point, there is a striking correlation between
equity performance in EM and a country's exposure to the US-China trade
war, as measured by value added to China-US trade. Less exposed economies
managed to eke out small positive price gains, though as discussed currency
moves still saw a negative overall return in dollar terms.
Chart 3: Trade war fears came to dominate EM equities
In EM, markets
with high exposure
to the US-China
trade war were the
hardest hit
Source: OECD, Thomson Reuters Datastream, Schroders Economics Group. 2 January 2019.
Comparing currency market performance
Currency markets ended 2018 largely reflecting the anxieties of investors. The US
dollar started the year weaker, helping to boost risk assets, however by April the
greenback was on the rise once again, ending the year up on a nominal trade
weighted basis (+4.9%). The initial rise over the summer reflected the stronger US
economy, however by the autumn, the strong US dollar started to reflect concern in
the global economy (chart 4).
Economic and Strategy Viewpoint January 2019 8The euro had a reasonably steady year, with a temporary dip coinciding with the
Italian elections. Overall, the euro finished 2018 slightly up (+0.6%). As for the British
pound, it was a volatile year with some upside support from the Bank of England
raising rates, but sterling ended 2018 with a slump caused by the lack of resolution
on Brexit (-0.6%).
Chart 4 and 5: Currency performance in developed markets
2018 was another
strong US dollar
year, as safe
haven currencies
did best, while
commodity
currencies
fared worst
Source: Thomson Reuters Datastream, Schroders Economics Group. 2 January 2019.
There was a clear trend of investors favouring safe haven currencies, while shunning
commodity driven currencies (chart 5). The best performing currency (including
versus the US dollar) was the Japanese yen (+7%), while the Swiss franc also
performed well (+3.7%). The worst performing major currency this year was the
Australian dollar (-6.4%) followed by the Canadian dollar (-6.2%) – both heavily reliant
on commodity exports, which suffered in 2018.
In emerging markets, the strength of the dollar combined with some idiosyncratic
risks, meant that even after including carry very few currencies generated a positive
dollar return. Chart 6 shows the three best performing currencies, and of those only
the Mexican peso ended the year in positive territory with a return of nearly 6%
against the dollar. Malaysia and Thailand were the best of the rest, losing investors
only 1% or so. Mexico's good year arose chiefly from improving political sentiment as
investors took an optimistic view of the prospects of an AMLO presidency, and as
NAFTA uncertainty was reasonably favourably resolved with a new trade deal.
Charts 6 and 7: Best and worst of EM FX
The Mexican peso
was the best
performing EM
currency, with
Turkish lira
providing the
scares for the year
Source: Bloomberg, Schroders Economics Group. 2 January 2019
Economic and Strategy Viewpoint January 2019 9Turning to the worst performers (chart 7), the Turkish lira had a particularly painful
year, though it managed to erase much of the losses with a year-end rally. The
currency's rollercoaster ride was heavily linked to central bank action (and lack of it)
amidst fears of political interference. Comments from President Erdogan proved as
catalytic for Turkish assets as those of his American counterpart did for
US investments.
Comparing debt market performance
While US Treasuries failed to generate a positive return in 2018, a number of other
government bonds managed to remain in the black (chart 8). 10-year Australian
government bonds returned +6.2%, thanks to the high yield on offer at the start of
the year.
German Bunds were the next best performers (+3.3%), helped by the mini crisis in
Italy. Speaking of which, Italian BTPs had a wild and volatile year as shown in chart 8.
Despite ending the year only down 1.9%, at the peak of the crisis in October, BTPs
were down -9.8%! Regardless of the rebound since, BTPs were the worst performing
major government bond market of 2018.
Chart 8: Government debt returns
Though US
Treasuries were
down on the year,
other DM
government bonds
shielded investors
from the malaise in
risk assets
Source: Thomson Reuters Datastream, Schroders Economic Group. 2 January 2019.
Canadian bonds (+3%), UK gilts (+2%), French OATs (+1.8%) and even Japanese
government bonds (+0.8%) all managed a positive return. This suggests that
government bonds broadly still have a place in portfolios as hedges for risk assets,
although greater care is required in making those investment choices.
EM dollar denominated sovereign debt as a whole had a bad year, with the EMBI
index losing 5.3% for investors. The only sovereign offering a positive return was
Brazil, which rallied after the election to squeeze out a 0.8% gain for 2018. For much
of the year Turkey was the definite laggard thanks to its economic and currency crisis,
at one point losing more than 20%, but a strong second half rally erased much of the
losses to leave returns down 5.3% for the year.
Economic and Strategy Viewpoint January 2019 10Chart 9: An uninspiring year for hard currency EM debt
Only Brazilian $ total returns, ytd
government bonds
5%
(USD) generated a
positive return in 0%
EM debt space
-5%
-10%
-15%
-20%
-25%
Jan 18 Apr 18 Jul 18 Oct 18
Brazil Russia Mexico S Africa Indonesia EMBI Turkey
Source: Thomson Reuters Datastream, Schroders Economics Group. 2 January 2019.
Lessons from 2018
Having reviewed events and performance of markets over the past year, we highlight
a few lessons worth considering for 2019:
– While central banks care about markets, they do not set policy for the sole
purpose of pleasing investors. Sometimes, markets are too expensive, and
central bankers will see a correction as normal, rather than a signal that
something is “wrong”.
– Trade wars have far-reaching effects that will only be fully appreciated many
years after the fact. Not only is intermediate trade being impacted, but
eventually we will see trade substitution which will benefit some of the trade
competitors to the US and China.
– Investors should pay more attention to fundamentals and events rather than
seasonal patterns for stock markets. Selling in May would have hurt portfolios in
2018, while the “Santa rally” turned out to be the worst December performance
for global equities since 1970.
– Government bonds are still useful for hedging against downside risks. However,
investors must look beyond US Treasuries to find the best returns, particularly
in the new political environment. Other safe havens, like the yen, Swiss franc,
and Bunds, are worth a second look.
– Political risk is still as important as ever for investor sentiment. It can cause
short-term downside risks such as Italy and Turkey, or longer-term shifts such
as the US-China trade war. It can also provide upside risk as seen in Brazil.
– Finally, Bitcoins still have no place in an investor's portfolio (see our comments
in last year's edition). The crypto currency is down -72.5% in 2018, despite a
significant increase in participation from reputable financial services institutions.
Economic and Strategy Viewpoint January 2019 11Chart 10: Was 2018 the nail in the coffin for Bitcoin?
Source: Thomson Reuters Datastream, Schroders Economics Group. 2 January 2019.
Economic and Strategy Viewpoint January 2019 12Three themes for 2019 and some
black swans
Our review of the past year makes for sobering reading, with US equity and
government bond markets both returning less than cash. Such an outcome has only
been registered on three previous calendar years since 1900 and highlights the
challenge for investors in the current environment (see chart front page). Two factors
have been important in delivering this outcome and will shape market performance
in 2019.
Growth concerns
Global growth First, global growth disappointed and remained a concern as trade tensions
disappointed in escalated. At the start of 2018 expectations were high as a result of the synchronised
2018 recovery in global activity in 2017. As we noted at the time though, the hurdle for
positive macro surprises in 2018 had become greater, making the potential for gains
more limited for equity markets. Whilst the actual outcome for global growth in 2018
is likely to be similar to that in 2017, relative to expectations, 2018 was a
disappointment (see chart 11). Although the shortfall was not great, equity markets
had become priced for a continuation of positive news judging from the level of
market valuations and this stacked the odds against equities.
Chart 11: Global growth expectations and the equity market: 2018 vs. 2017
Source: Thomson Reuters Datastream, Schroders Economics Group, 17 December 2018.
As we went through the year, the world economy experienced a slowdown in export
growth in part related to the threat from the trade wars, but also linked to the
strength of the US dollar in our view. Economists produced a wide range of estimates
for the impact from the US-China trade dispute and whilst we disagree with the more
extreme numbers, there is evidence that the damage will extend beyond exports with
capital spending also affected by the increased uncertainty associated with trade
tensions.
Of course, the disappointment on global growth does not account for the
underperformance of sovereign bonds for which we would look at the second factor:
the tightening of global liquidity.
Tightening liquidity
And liquidity The US Federal Reserve (Fed) raised interest rates four times in 2018 taking the Fed
tightened funds target range to 2.25 to 2.50% and, although the yield curve has flattened, bond
Economic and Strategy Viewpoint January 2019 13yields are higher as a result of the rise in short-term rates. Furthermore, for the first
time in ten years, cash yields more than underlying inflation and thus holds its value
in real terms (chart 12).
Chart 12: Cash rates rise above inflation and equity yields in the US
Source: Thomson Reuters Datastream, Schroders Economics Group, 2 January 2019.
Cash is also attractive relative to equity, with the interest rate rising above the
Cash has become
dividend yield on the S&P 500 for the first time since 2008 (Chart 12). Whilst this does
more attractive in
not mean that equities are expensive (as dividends can be expected to grow in the
real terms and future), it does reduce the search for income which has been driving investors into
relative to equity risk assets since the financial crisis and the collapse in interest rates.
The rise in US rates has had a wider impact through the effect on dollar borrowing
costs. Recent analysis from the Bank for International Settlements (BIS) highlights the
increased importance of dollar funding since the global financial crisis. Dollar
strength has clearly squeezed liquidity in Asia and Latin America where dollar rates
drive funding costs.
In addition to the rise in short rates, liquidity has been withdrawn via the Fed's
programme of reducing its balance sheet, often referred to as quantitative tightening
(QT). According to the BIS, the Fed's holdings of US Treasuries fellby more than two
percentage points, to 15% of total marketable securities in 2018, about five
percentage points below the 2014 peak.
We discuss our outlook for equities below, but first highlight some key themes
for 2019.
Theme 1. Liquidity ebbs and exposes the over-leveraged
Going forward, global liquidity is likely to slow further as, alongside a continuation of
the Fed's QT, the European Central Bank brings its asset purchase programme to an
end, as confirmed at its last policy meeting. These moves mean that the Bank of Japan
is the only central bank actively engaged in QE in 2019. Intervention by the People's
Bank of China and the Swiss National Bank in foreign exchange markets may
continue, but the net result is that the overall level of liquidity is set to ebb in 2019
(see chart 13).
Economic and Strategy Viewpoint January 2019 14Chart 13: Global liquidity set to fall
Central bank
liquidity to peak
Source: Thomson Reuters Datastream, Schroders Economics Group, 20 December 2018.
The question is how much impact will this have on bond yields? We never expected
bond yields to return to pre-QE levels given the changes in the world economy since
the policy began. The slowdown in productivity and greater regulation of the banking
system mean equilibrium real rates will be lower. Furthermore, central banks will still
have some control over the curve via short-term policy rates and forward guidance.
Nonetheless, we had expected a greater impact from Fed QT in 2018 and as US
Treasury yields rose earlier in the year this appeared to be playing out. However,
more recently Treasury yields have fallen back and although higher than at the start
of the year, with 10-year yields currently below 3% the impact has been less than we
expected.
The flow of funds data suggests that this reflects increased demand for Treasuries
from households, private sector pension funds and government retirement funds.
Overseas buyers have also contributed. Higher yields have no doubt helped, but the
appetite for Treasuries has proved greater than expected particularly from those with
long-term liabilities.
The end of the ECB's asset purchase programme will be another test for the bond
markets as the central bank has had a significant impact, in markets where it was by
far the largest buyer. We would expect upward pressure on yields; however, it would
seem that the impact would be felt most by those outside the region, who benefited
from the original asset purchase programme as investors moved out of core
European markets. That means peripheral eurozone, some emerging markets and
also lower grade corporate credit. The riskier areas tend to suffer as liquidity tightens
as we have seen in emerging markets in 2018: as Warren Buffett said “It is only when
the tide goes out that you discover who's been swimming naked”.
Theme 2. The return of emerging markets
It may seem odd following on from theme 1, but emerging market assets can make
a comeback in 2019. Tightening global liquidity and trade wars will not help; however,
if our forecast is correct and the Fed decides to pause the tightening cycle in June
2019, there is a good argument to be made for the dollar to weaken. This would
relieve the pressure on dollar borrowers and emerging markets. Arguably, those
markets may already be discounting the worst, with both equities and foreign
exchange having fallen significantly (chart 14).
Economic and Strategy Viewpoint January 2019 15Chart 14. Emerging market assets are pricing a weaker trade environment
Emerging markets
are discounting a
slower
environment
Source: Thomson Reuters Datastream, Schroders Economics Group, G0008, 2 January 2019.
Macro developments will be important though and it may well need another bout of
monetary and fiscal stimulus from China to be the catalyst for investors to return to
the region. This would help to alleviate concern over another collapse in global trade
as seen in 2007-08. However, whilst US-China trade will slow, unless the trade war
goes global there is no reason to expect an outright contraction in trade as activity
should be diverted elsewhere.
Theme 3. Populist pressures means governments turn to
fiscal policy
The past year has reminded us how weak underlying growth in the world economy
has become. The phrase “secular stagnation” is being heard again. Without the
engine of US or Chinese demand, global activity tends to slow to a pace well below
pre-crisis norms. Europe and Japan tend to blow with the global trade winds rather
than generate their own domestic demand.
The US outperformed in growth terms in 2018 as a result of President Trump's fiscal
Governments
policy stimulus. Others are taking note. The most striking example has been in
looking for a quick France, where President Macron caved in to populist demands for lower taxes after
fix are turning to several days of riots. Italy has been subject to more rigour from the European
fiscal policy Commission, but has now gained agreement for a more expansionary budget in
2019. The UK is planning a fiscal boost in the event of a hard exit from the EU.
Meanwhile, as mentioned above, look out for more fiscal policy stimulus in China.
Japan may well be the exception with an increase in the consumption tax scheduled
for October 2019. However, even here measures are being taken to offset the impact
and following the announcement of the FY19 budget it looks like increased spending
will offset the extra revenue.
The key point is that governments seeking growth are no longer making economic
reforms to increase competition or make labour markets more flexible. The approach
today is to deliver a quick fix through a tax cut, increased public spending or
regulation such as a rise in the minimum wage rate. Some of these measures are
warranted and overdue, but governments are no longer strong enough to withstand
populist pressures for a fiscal solution. This will mean greater public borrowing as
the US is already finding with the budget deficit approaching 4% of GDP this year,
which is remarkable for an economy with its lowest rate of unemployment since 1969.
At this stage of the cycle the budget should be close to balance if not in surplus.
Economic and Strategy Viewpoint January 2019 16How are these themes likely to shape market performance in 2019?
Coming back to our review of the factors behind the weakness of markets this year:
growth concerns and tighter liquidity. Clearly we still have concerns about the latter
(theme 1), but recognise that governments will look to offset the macro effects
through fiscal policy (theme 3).
On the growth front, our base case forecasts for 2019 are slightly below consensus
and we see trade tensions rumbling on, suggesting that concerns over activity will
persist. However, markets may already be pricing in much of the bad news with
historic price earnings multiples now below their rolling averages (chart 15). This of
course is no guarantee of positive returns in 2019, but means that markets are better
positioned for disappointment and hence potentially more resilient to shocks than
this time last year.
Chart 15. Equity markets have de-rated
Global equity market PE (MSCI) Emerging Markets PE (MSCI)
Source: Thomson Reuters Datastream, Schroders Economics Group, G0042, 2 January 2019.
Black swans
This is an opportunity to think the unthinkable. We already use scenario analysis to
calibrate the known unknowns. Black swans, however, are the unknown unknowns.
By definition, we cannot anticipate them. However, we can think of four events
which are plausible, but not being given much weight by markets.
Eurozone crisis 2
As argued above, the single currency area will feel the effect of tighter liquidity as the
The eurozone does ECB ends QE. The worst outcome would be another Greek-style crisis. However, it is
not have the not clear that Europe has the mechanisms to prevent such an occurrence as it is yet
mechanisms to to complete the banking union and is not a fiscal union. President Macron has
contain a crisis proposed a fund to support growth in such circumstances, but this has yet to
be created.
Peripheral bond markets have breathed a sigh of relief with the recent agreement on
the Italian budget for the coming year, but the drama is likely to play out again in
2019 given the aims of the populist coalition. Any signs of crisis would cause the ECB
to delay rate rises and even restart QE, but remember that it is often only through a
crisis that the EU makes progress by creating the necessary support for reform.
Economic and Strategy Viewpoint January 2019 17No Brexit
This seems inconceivable given the time and energy currently being poured into
sorting a withdrawal agreement. However, “no Brexit” is the only outcome that will
not require a vote and with MPs seemingly hell bent on rejecting the current deal on
offer and the EU refusing to talk further, there must be a possibility that the
government cancels Article 50 and stays in the EU. It could certainly become a
bargaining chip if PM May needs to win over the Commons.
Military action
There are plenty of hot spots which could ignite in 2019. The proxy war in the Middle
East could become an actual war between Saudi Arabia and Iran. China has ambitions
for Taiwan and across the region. The recent departure of defence secretary James
Mattis indicates a more isolationist US, creating opportunities for others to fill the
void. If Trump was to fully destabilise the UN, then Russian adventurism could return.
Trump does not run for re-election in 2020
Although it is often difficult to read the president's intentions, he appears to be
Trump may have
constantly campaigning and setting himself for a second term. However, he will have
other plans
to see off the Mueller investigation on involvement with Russia in the 2016 election.
Furthermore, he is already the oldest person to be elected president, taking office at
the age of 70 and would be 78 if he served a whole second term. Health may be a
factor. Or, he could simply decide to do something else: there has been talk of him
founding a media empire – Trump TV anyone?
Economic and Strategy Viewpoint January 2019 18Schroders Economics Group: Views at a glance
Macro summary – January 2019
Key points
Baseline
– Global growth is expected to reach 3.3% in 2018, before moderating to 2.9% in 2019 and 2.5% in 2020.
Inflation is forecast to rise from 2.3% in 2017 to 2.9% in 2018 and 2019, then falling to 2.7% in 2020.
Meanwhile we continue to expect an escalation of the US-China trade war next year.
– US growth is forecast at 2.9% in 2018 and 2.4% in 2019. With core inflation rising, we expect two rate hikes
in 2019, taking the Fed funds to a pause at 3% by mid-2019. However, as US fiscal stimulus fades and the
economy slows to 1.3% 2020, the Fed is forecast to cut rates twice. The Fed should halt quantitative
tightening in 2020.
– Eurozone growth is forecast to moderate from 1.9% in 2018 to 1.6% in 2019 as the full effects from the US–
China trade war hits European exporters. Inflation is expected to remain under 2%, with higher energy price
inflation in 2018 replaced by higher core inflation in 2019. The ECB is likely to end QE this year, before raising
interest rates twice in 2019 and twice again in 2020. The refinancing rate is forecast to reach 1% and the
deposit rate to reach 0.5% by the end of 2020.
– UK growth is likely to pick up to 1.4% and 1.5% in 2019 and 2020 from 1.2% this year. The risk of a no-deal
Brexit should mean that the deal passes parliament ahead of a transition period that preserves the states
quo of single market and customs union membership. Inflation is expected to fall to 1.8% in 2019 thanks to
an expected rise in sterling, but stronger growth is expected to push inflation up to 2.1% in 2020. Meanwhile,
staying on hold for the rest of 2018, the BoE is expected to hike twice in 2019 and twice in 2020 (to 1.75%).
– Growth in Japan should stay fairly constant in 2019 at 1% from 0.9% this year, however activity should be
volatile owing to the consumption tax hike. A slow recovery should follow resulting in no growth in 2020.
Despite or expectation for much lower inflation in 2019, we expect the BoJ to make another tweak to yield
curve control next year and ultimately raising rates to 0% at the end of 2020.
– Emerging economies should slow to 4.5% in 2019 and 2020 from 4.8% this year. We are optimistic that for
most of the BRIC economies domestic factors can outweigh global problems in 2020. But China should
continue its secular decline, exacerbated by trade wars and the PBoC should continue to ease.
Risks
– Risks are tilted toward stagflation with the highest individual risk going on the deflationary US recession
2020 scenario where the Fed overtightens in 2019. An outcome which would probably see a vacancy for the
chair of the Fed.
Chart: World GDP forecast
Source: Schroders Economics Group, 26 November 2018. Please note the forecast warning at the back of the document.
Economic and Strategy Viewpoint January 2019 19Schroders Baseline Forecast
Real GDP
y/y% Wt (%) 2017 2018 Prev. Consensus 2019 Prev. Consensus 2020
World 100 3.3 3.3 (3.3) 3.2 2.9 (3.1) 3.0 2.5
Advanced* 61.4 2.2 2.3 (2.3) 2.3 1.9 (2.0) 2.0 1.3
US 26.5 2.2 2.9 (2.8) 2.9 2.4 (2.4) 2.6 1.3
Eurozone 17.2 2.4 1.9 (2.0) 1.9 1.6 (1.7) 1.6 1.2
Germany 5.0 2.5 1.6 (1.9) 0.0 1.4 (1.7) 1.5 1.3
UK 3.6 1.7 1.2 (1.2) 1.3 1.4 (1.3) 1.5 1.5
Japan 6.7 1.7 0.9 (1.0) 0.9 1.0 (1.0) 1.1 0.0
Total Emerging** 38.6 5.1 4.8 (5.0) 4.8 4.5 (4.8) 4.6 4.5
BRICs 25.3 5.7 5.7 (5.8) 5.7 5.5 (5.6) 5.6 5.4
China 16.7 6.9 6.6 (6.6) 6.6 6.2 (6.2) 6.3 6.0
Inflation CPI
y/y% Wt (%) 2017 2018 Prev. Consensus 2019 Prev. Consensus 2020
World 100 2.3 2.9 (2.8) 2.9 2.9 (2.7) 2.7 2.7
Advanced* 61.4 1.7 2.1 (2.2) 2.0 2.0 (2.1) 1.8 1.9
US 26.5 2.1 2.6 (2.8) 2.5 2.7 (2.6) 2.1 2.4
Eurozone 17.2 1.5 1.8 (1.8) 1.8 1.6 (1.6) 1.6 1.5
Germany 5.0 1.7 1.9 (1.9) 1.9 1.8 (1.8) 1.9 1.7
UK 3.6 2.7 2.5 (2.4) 2.5 1.8 (2.2) 2.1 2.1
Japan 6.7 0.5 1.0 (0.9) 1.0 0.5 (1.3) 0.9 1.1
Total Emerging** 38.6 3.3 4.2 (3.7) 4.2 4.2 (3.7) 4.0 4.0
BRICs 25.3 2.2 2.7 (2.7) 2.8 3.3 (3.2) 3.0 3.0
China 16.7 1.6 2.2 (2.1) 2.2 2.6 (2.4) 2.3 2.4
Interest rates
% (Month of Dec) Current 2017 2018 Prev. Market 2019 Prev. Market 2020 Market
US 2.50 1.50 2.50 (2.50) 2.80 3.00 (3.00) 2.66 2.50 2.51
UK 0.75 0.50 0.75 (0.75) 0.91 1.25 (1.25) 1.10 1.75 1.23
Eurozone (Refi) 0.00 0.00 0.00 (0.00) 0.50 (0.50) 1.00
-0.31 -0.25 -0.04
Eurozone (Depo) -0.40 -0.40 -0.40 (-0.40) 0.00 (0.00) 0.50
Japan -0.10 -0.10 -0.10 (-0.10) 0.05 -0.10 (-0.10) 0.08 0.00 0.09
China 4.35 4.35 4.35 (4.35) - 4.00 (4.00) - 3.50 -
Other monetary policy
(Over year or by Dec) Current 2017 2018 Prev. 2019 Prev. 2020
US QE ($Tn) 4.2 4.4 4.0 (4.0) 3.4 (3.4) 3.1
EZ QE (€Tn) 2.4 2.2 2.4 (2.4) 2.4 (2.4) 2.4
UK QE (£Bn) 435 435 445 (445) 445 (445) 445
JP QE (¥Tn) 545.5 521 552 (549) 572 (563) 592
China RRR (%) 15.50 17.00 14.00 15.00 12.00 14.00 11.00
Key variables
FX (Month of Dec) Current 2017 2018 Prev. Y/Y(%) 2019 Prev. Y/Y(%) 2020 Y/Y(%)
USD/GBP 1.27 1.35 1.35 (1.30) -0.2 1.42 (1.35) 5.2 1.38 1.4
USD/EUR 1.14 1.20 1.16 (1.14) -3.4 1.21 (1.18) 4.3 1.25 1.2
JPY/USD 109.7 112.7 112 (110) -0.6 110 (108) -1.8 108 -1.8
GBP/EUR 0.90 0.89 0.86 (0.88) -3.2 0.85 (0.87) -0.8 0.91 0.9
RMB/USD 6.87 6.51 7.05 (6.90) 8.3 7.20 (7.00) 2.1 7.40 7.0
Commodities (over year)
Brent Crude 53.1 55 73.6 (73.6) 34.1 71.7 (73.2) -2.5 68.1 -5.1
Source: Schroders, Thomson Datastream, Consensus Economics, January 2019
Consensus inflation numbers for Emerging Markets is for end of period, and is not directly comparable.
Market data as at 31 December 2018.
Current forecast updated November 2018. Previous forecast refers to August 2018.
* Advanced markets: Australia, Canada, Denmark, Euro area, Israel, Japan, New Zealand, Singapore, Sweden, Switzerland,
United Kingdom, United States.
** Emerging markets: Argentina, Brazil, Chile, Colombia, Mexico, Peru, China, India, Indonesia, Malaysia, Philippines, South Korea,
Taiwan, Thailand, South Africa, Russia, Czech Rep., Hungary, Poland, Romania, Turkey, Ukraine, Bulgaria, Croatia, Latvia, Lithuania.
Economic and Strategy Viewpoint January 2019 20Updated forecast charts – Consensus Economics
For the EM, EM Asia and Pacific ex Japan, growth and inflation forecasts are GDP weighted and calculated using
Consensus Economics forecasts of individual countries.
Chart A: GDP consensus forecasts
2018 2019
Chart B: Inflation consensus forecasts
2018 2019
Source: Consensus Economics (2 January 2019), Schroders.
Pacific ex. Japan: Australia, Hong Kong, New Zealand, Singapore.
Emerging Asia: China, India, Indonesia, Malaysia, Philippines, South Korea, Taiwan, Thailand.
Emerging markets: China, India, Indonesia, Malaysia, Philippines, South Korea, Taiwan, Thailand, Argentina, Brazil, Colombia, Chile,
Mexico, Peru, South Africa, Czech Republic, Hungary, Poland, Romania, Russia, Turkey, Ukraine, Bulgaria, Croatia, Estonia,
Latvia, Lithuania.
The forecasts included should not be relied upon, are not guaranteed and are provided only as at the date of issue. Our forecasts are based on our own assumptions
which may change. We accept no responsibility for any errors of fact or opinion and assume no obligation to provide you with any changes to our assumptions or
forecasts. Forecasts and assumptions may be affected by external economic or other factors. The views and opinions contained herein are those of Schroder
Investments Management’s Economics team, and may not necessarily represent views expressed or reflected in other Schroders communications, strategies or
funds. This document does not constitute an offer to sell or any solicitation of any offer to buy securities or any other instrument described in this document. The
information and opinions contained in this document have been obtained from sources we consider to be reliable. No responsibility can be accepted for errors of
fact or opinion. This does not exclude or restrict any duty or liability that Schroders has to its customers under the Financial Services and Markets Act 2000 (as
amended from time to time) or any other regulatory system. Reliance should not be placed on the views and information in the document when taking individual
investment and/or strategic decisions. For your security, communications may be taped or monitored.
Economic and Strategy Viewpoint January 2019 21Schroder Investment Management Limited
1 London Wall Place, London, EC2Y 5AU
Tel: + 44(0) 20 7658 6000
schroders.com
@Schroders
Important information: This document is intended to be for individual investment and/or strategic decisions. Past performance is
information purposes only and it is not intended as promotional not a reliable indicator of future results, prices of shares and income
material in any respect. The material is from them may fall as well as rise and investors may not get back the
not intended as an offer or solicitation for the purchase or sale of any amount originally invested. Schroders has expressed its own views in
financial instrument. The material is not intended to provide, and this document and these may change. Issued by Schroder Investment
should not be relied on Management Limited, 1 London Wall Place, London, EC2Y 5AU, which
for, accounting, legal or tax advice, or investment recommendations. is authorised and regulated by the Financial Conduct Authority. For
Information herein is believed to be reliable but Schroders does not your security, communications may be taped or monitored. EU04102.
warrant its completeness or accuracy. No responsibility can be
accepted for errors of fact or opinion. Reliance should not be placed
on the views and information in the document where takingYou can also read