Year in review Te Tau Kua Hipa - Tauranga City Council
←
→
Page content transcription
If your browser does not render page correctly, please read the page content below
02
Year in review
      Te Tau Kua Hipa
YEAR IN REVIEW   11

Council planning and
reporting cycle
REPORTING ON OUR PROGRESS                    WHAT IS A LONG-TERM PLAN?                       WHAT IS AN ANNUAL PLAN?

Every year council produces                  The LTP is our guiding document,                In the two years between adopting
an annual report to provide the              providing detail on many of our                 our LTPs, we develop annual plans.
community, the mayor, councillors,           activities. It sets our vision, direction,      Essentially, these provide an update
and staff with a summary of the work         budgets and work plans for the                  to what we agreed through the LTP
completed during the year. It aims           following 10 years. It also describes           by highlighting any changes to our
to provide a transparent insight into        our financial strategy, details our             budgets and work plans for each
our operations and decision-making           performance measures, and provides              year. For any significant or material
processes.                                   the rationale for our activities,               changes, we consult with the
                                             amongst other things.                           community. This process allows us to
This annual report covers the period
                                                                                             make sure that our budgets and work
1 July 2018 to 30 June 2019, which is        The LTP is an important reference for
                                                                                             plans are flexible enough to respond
the first year of our current Long-term      people requiring information about
                                                                                             to the needs of our community and
Plan 2018-28 (LTP).                          our activities.
                                                                                             the demands of growth.
In between annual reports, we                The current LTP was finalised in June
produce regular reports to our               2018, after substantial community
Finance, Audit and Risk Committee to         input.
track our progress against targets and
budgets.

                                                                              Year 1

                                                                                                           You are
                                                                                                            here

                                                        Long-term Plan
                          Annual report                                                   Annual report

                     Year 3

                                          Annual plan                         Annual plan

                                                                                  Year 2

                                                         Annual report
12   ANNUAL REPORT 2018/19

     Highlights and challenges
     During the past year, we have successfully completed many projects
     and initiatives. We have had the highest expenditure ever on our
     capital programme as we respond to the fast growth that our city
     continues to experience. We have also had to manage a number of
     issues and challenges.

                             FINISHING THE SOUTHERN PIPELINE

                             The completion of the Southern Pipeline wastewater project this year was a huge
                             achievement. This project spanned 15 years from inception to completion. It centred
                             on installing a large wastewater pipe that future-proofs our city and protects our
                             environment. The pipeline redirects some of the city’s wastewater to the treatment
                             plant at Te Maunga, relieving the burden on the Chapel Street treatment plant, which
                             allows this plant to improve its performance.

                             The project has successfully given our city’s wastewater network some much-
                             needed capacity and reduces the risk of sewer overflows into Tauranga Moana.

                             It also enables the continuing growth of southern and western areas of Tauranga and
                             Ōmokoroa in the western bay.

                             NEW AIRPORT TERMINAL

                             We have completed the first stage of the $13.9 million upgrade of the Tauranga
                             Airport terminal, providing a better experience for people entering one of the main
                             gateways to our city. The upgrade doubles the floor area of the terminal to 3,800
                             square metres, making room for a larger lounge, a bigger café, and new check-in
                             area and facilities. The expansion will accommodate an increase in Air New Zealand
                             passengers and encourage other airlines to fly in and out of Tauranga.

                             URBAN FORM AND TRANSPORT INITIATIVE

                             The continued growth of our city has put pressure on our infrastructure and highlights
                             the importance of planning for future growth areas. To address this, this year our
                             council, along with our SmartGrowth partners and the New Zealand Transport Agency
                             (NZTA) formed the Urban Form and Transport Initiative (UFTI). UFTI aims to develop a
                             long-term, integrated masterplan for urban development and transport that aligns with
                             the government’s new transport policy statement and urban growth agenda. UFTI will
                             coordinate some 20 to 30 western Bay of Plenty projects that are already underway,
                             but are getting limited traction due to lack of investment. Some of these projects are
                             critical for easing congestion and unlocking housing supply.
YEAR IN REVIEW   13

FOUR PROJECT REVIEW

We commissioned a report into four high-profile projects which did not meet
community expectations. Three of these projects were led by the council - the
Greerton Village traffic safety improvements, the creation of Te Papa o Ngā Manu
Porotakataka in Mount Maunganui, and the redevelopment of Kulim Park. The fourth
project was the Mount Maunganui Surf Lifesaving Club’s clubroom replacement.

The review found several common issues relating to delivery and engagement, and
council is acting on recommendations for organisational improvements.

The recommendations included:

•   commencing a programme to change the culture of the organisation from the
    current task focus to one that puts the community at the forefront of the service
    provision

•   that staff be required to prepare project management plans that are fit-for-
    purpose for all projects that are significant in terms of cost or impact on the
    community, and for those that involve multiple arms of the staff organisation

•   that the council engage a consultant specialising in stakeholder engagement
    and communications to review the way in which these functions are carried out
    and to propose an effective delivery model and structure for the future

•   that staff be required to review the scope and costs of projects throughout the
    project development cycle to ensure that the community is not given unrealistic
    expectations about project outcomes

•   that staff be provided with clear guidance on the scale and circumstances of
    projects that need to be reported to the council.

Progress so far includes:

•   A structural reorganisation with a focus on community and customer service

•   The development of an Infrastructure Project Lifecycle process to ensure better
    project reviews, at appropriate milestones, with the relevant project stakeholders

•   Linking cost estimate and scope review to consultation

•   An independent review of the communications and engagement functions within
    council.

We are aiming to improve on these areas in the next financial year (2019/20).

WAIĀRI WATER SUPPLY SCHEME

With populations growing along the Mount Maunganui to Pāpāmoa coastal strip,
and in Te Puke, we need to supply enough water to enable land development and
serve 35,000 family homes.

This year we reached a milestone in our $145 million Waiāri Water Supply Scheme
by starting construction of the first pipeline, connecting the reservoir at the
intersection of Poplar Lane and Te Puke Highway with the Eastern Reservoir on
Welcome Bay Road. This will form a key part of our infrastructure to help cater for
the growth of our city.

The project involves developing a facility to take water from the Waiāri Stream, a
water treatment plant in No. 1 Road, Te Puke, and an underground pipeline from the
plant to Pāpāmoa. The project is due for completion in late 2021.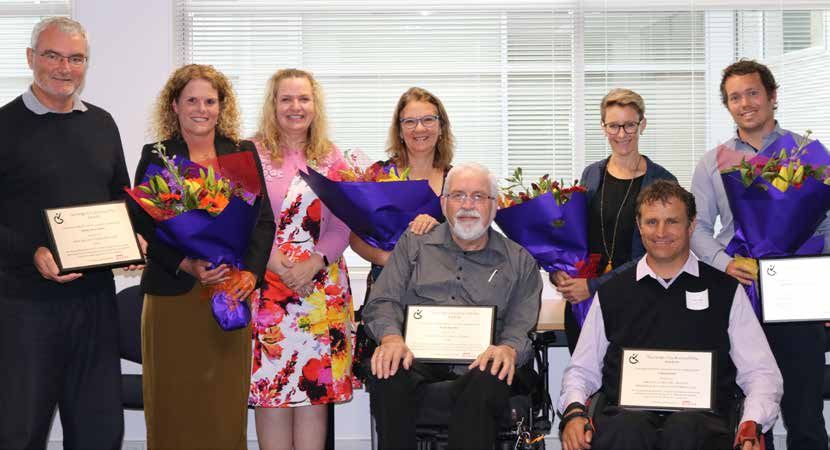
14 ANNUAL REPORT 2018/19
BELLA VISTA
Council bought all 21 Bella Vista properties from affected homeowners in late 2018
after the development failed and problems were found with the houses and sections.
We paid $14 million to settle with the homeowners and received an insurance pay-
out of $10.5 million, leaving a difference of $3.5 million (amounts inclusive of GST).
Since early 2019, we have been salvaging, repairing, removing or demolishing
the Bella Vista properties. This involves removing the upper levels of homes from
16 properties on Lakes Boulevard, and clearing the site. The removal process is
currently expected to finish in late 2019. The remaining five homes on Aneta Way are
being repaired and will be sold on their existing sections.
KERBSIDE WASTE
Another highlight was our commitment to environmental sustainability and in
particular, the planned introduction of a kerbside waste collection service. Nearly 70%
of the kerbside waste our city sends to landfill can be recycled or composted.
In October 2018, we introduced an interim kerbside glass collection service after
private collectors stopped accepting glass for recycling. During the next seven
months, nearly 2,200 tonnes of glass was diverted for recycling and was prevented
entering landfill.
The ‘put-out’ rate of kerbside glass waste was higher than estimated and we aim to
meet this higher demand for the next year. This is good news, because it indicates that
our community wants to manage waste responsibly.
We are planning to introduce a full kerbside collection service in 2021 that includes
recyclable waste, food scraps and rubbish. These targeted rates-funded services will
build on the glass service, encouraging Tauranga residents to recycle more and send
less waste to landfill. These recycling efforts will help us use less of the world’s non-
renewable resources, improving our community and our environment.
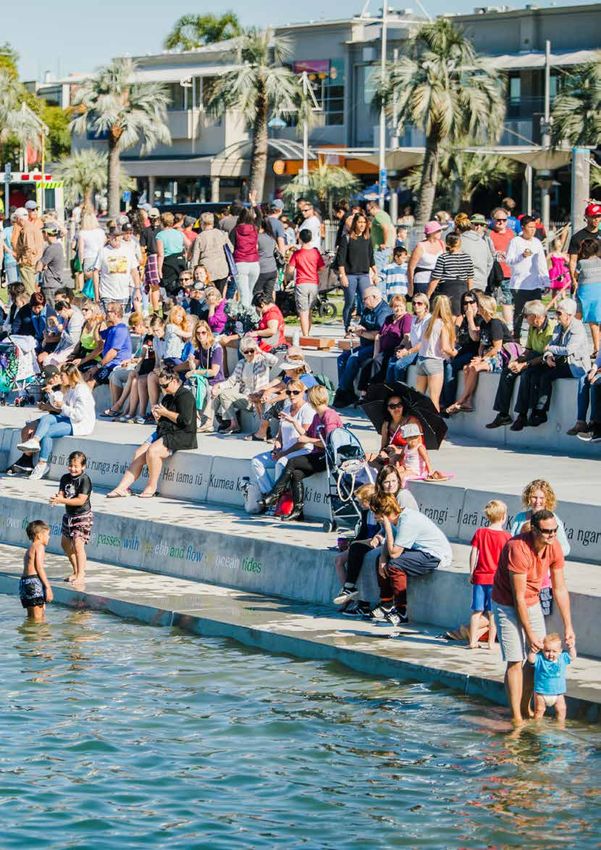
Kopurererua Valley walking and cycling path
Invitation to official opening and community event
OPENING OF A WALKWAY AND CYCLE WAY IN THE KOPURERERUA VALLEY
We finished upgrading the popular Kopurererua Valley walking and biking path, sealing
6km of track to make it easier, safer and more comfortable for people riding bikes
between The Lakes and Tauranga city centre.
The upgrade cost $600,000, with 51% coming through NZTA from central
government’s $390 million programme to make it easier for Kiwis to walk and
cycle around New Zealand.
You are invited to join Hon Julie Anne Genter, Associate When: Sunday 14 July 2019
Minister of Transport, to officially open the Kopurererua
Valley walking and cycling path in Tauranga. Time: 9:45am for a 10:00am start
(until around midday)
A 6km rough gravel path through the Kopurererua
Valley has been upgraded and sealed to create a safer
and easier route between The Lakes and the central
Where: Faulkner Street entrance to
Kopurererua Valley Reserve
A CHALLENGE WITH DEVELOPMENT CAPACITY
city. This project was partner funded by Tauranga City (Tauranga)
Council and the NZ Transport Agency.
The opening ceremony will be followed by a community
Parking: Faulkner Street area
(on-street parking)
The supply of land and infrastructure to support growth is a high priority.
event with competitions, spot prizes, a sausage sizzle RSVP: Monday 8 July, 2019
and a chance for everyone to give the track a go. kvalleyinvite@tauranga.govt.nz
During the next one to three years there will be an undersupply of around 1,000
homes. The development shortfall is expected to increase in later years. Several
EVENT
FA
U T RE
ET factors are contributing to this. They include natural hazard risks, requirements for
LK S TAURANGA
HUMBE
NE E
R
ST
RE C
LA
RK zoning changes, dependence on landowners releasing land, and dependence on state
HOSPITAL
TW
ET
R CRE
highway planning and funding.
EN
29
ET
TI
SH
ET
RE
TW
S
ST
H
EN
AV
K
TY
O
E
CO
FI
AD
The issue is compounded by changes in legislation, such as the removal of Special
R
ST
AD RO
AV
RO N
O
E
C ER
AN
ZA
C
AM Housing Areas. We are working with central government and NZTA, and are aligning
GATE PA ourselves with the government’s urban growth agenda.
YEAR IN REVIEW    15

PLANNING OF URBAN GROWTH AREAS AT TE TUMU AND TAURIKO WEST

To help resolve the short-term housing supply challenges, we are finalising structure
plans (a type of spatial plan) for the Te Tumu and Tauriko West urban growth areas.

However, both of these projects face significant delays and risks. This is partly
because we rely on partner agencies and their long-term planning. For example,
the notification of the plan change for Tauriko West relies on NZTA timeframes for
the planning of the State Highway 29 corridor. For Te Tumu, providing access to
this area requires significant investment in the state highway network and we are
awaiting a decision from the Māori Appellate Court to provide a pathway to allow for
development.

INTENSIFICATION OF THE TE PAPA PENINSULA

We have been looking at ways to accommodate growth in existing areas to
complement the planning of greenfield areas such as Te Tumu and Tauriko West.

We consider the Te Papa peninsula from Sulphur Point to Greerton to be appropriate
for increased density. However, our existing planning rules have not led to the
intensification that we need.

Planning is underway to encourage a variety of housing types including duplexes
and low to medium rise developments (for example, terraced housing). This will
require a high level of engagement with the community, especially Te Papa residents
and landowners.

THE UNIVERSITY OF WAIKATO CAMPUS OPENS IN TAURANGA

Teaching commenced at the new university campus at the start of the academic year,
in February 2019. An official opening was held in April to thank stakeholders who
supported the development. The campus features collaborative social learning areas,
customisable teaching spaces, a 200-seat lecture theatre, multi-function spaces
including a noho centre with sleeping facilities and commercial kitchen, a 24-hour
computer lab, and a café.

We have supported this development by gifting Durham Street land and partnering
with other supporters of the development including the Bay of Plenty Regional Council
and the Tauranga Energy Consumer Trust (TECT).

This important development will enhance the range of qualifications and study options
available to students in the Bay of Plenty while contributing to the vibrancy of our city
centre.

CLIMATE CHANGE MITIGATION AND ADAPTATION PLANNING

Last year was marked by a surge in organisations declaring a climate change
emergency. We identified resilience to environmental changes and natural disasters as
a key priority in our LTP and have been focussing on climate change mitigation and
adaptation planning.

We employed an Energy and Carbon Manager to update our Energy Management
Plan and Energy Policy and measure Council’s greenhouse gas footprint. We also
employed a specialist to manage the resilience project. This aims to provide robust
infrastructure and informed land use planning to improve the city’s resilience to natural
hazards.
16   ANNUAL REPORT 2018/19

              Our performance snapshot
                                                        Our city continues to grow

       People continue to come                               They’re building homes                                  We continue to see
             to Tauranga                                      to live in although at a                             commercial investment
                                                            slower rate than last year

                                                                                                                                                     $
                                                                  607            +        1,076
                                                               additional                   new
                                                               residential               dwelling                       407             =       $360m
          2014          2019           2024                    allotments                consents                  commercial                 investment in
         121,800       136,840        147,620                    created                  issued                building consents                the city

                  $845m                                               Which is good for our jobs and our economy

             total visitor spend
                  an increase of 5.5%                         5.0%            Growth in employment vs national average of 3.0%
                                                                              (as at 31 Dec 2018)

                                                              4.8%            GDP growth vs national 3.2%
                                                                              (as at 31 Dec 2018)

                                                              2.3%
                                                                              Business unit growth vs national average of 0.7%
                                                                              (as at 31 Dec 2018)

            78%                      22%                      4.4%            Unemployment vs national 4.6%
                                                                              (as at 31 Dec 2018)
     of that spend is by       of that spend is

                                                              4.0%
      domestic visitors        by international                               Growth in employment in knowledge intensive industries* vs national 2.9%
                                    visitors                                  (as at 31 Dec 2018)

                                But the rate of growth is putting pressure on our city

                         On our water supply                                                    On our roads and travel times

                                                                                               Our city has
            Second consecutive year                                                             equity of 5.9%                increase
                                                                                            $3.3b
              of water restrictions                                                                               in traffic flows
                                                                                                             (March 2018 to March 2019)

       And on our future development capacity                                            And property prices continue to go up

        Pyes Pa
         West
                  Wairakei         Newest suburbs                                             Average house value now
                                    Pyes Pa West
           65%
                      38%
                              65% built/consented and
                             Wairakei 38% built/consented
                                                                                                    $730,000                                   $

     * (Knowledge intensive = minimum 25% workforce qualified to degree level and minimum 30% workforce employed in professional, managerial, scientific and
     technical occupations)
YEAR IN REVIEW   17

                We have strengthened our focus on investment in key
                            infrastructure for the future

      We spent                                                     And

   $55m
on transport infrastructure
                                                         $90m
                                    on new stormwater, water and wastewater infrastructure.
     projects this year
                                  This included $14m to complete the Southern Pipeline and $20m and
    (this includes $17m           $14m to advance the Te Maunga wastewater treatment plant upgrade
   NZTA-funded projects)                    and the Waiāri Water Supply Scheme respectively.

                                    Our revenue from                       And capital subsidy
    We spent a record           development contributions                     revenue was

 $206m                                                                     $22m
                                  and vested assets was

  on capital expenditure.
                                    $52m
                                This is $2m more than last year.           primarily from NZTA

    Our total operating
      revenue was                 Our net debt is                            And delivers a

 $229m                            $441m
                                                                         debt-to-revenue
                                                                             ratio of
    including $167m rates
 revenue and an overall rates
       surplus of $300k.
                                   which is $1m less
                                     than budget                            176%
               But this will continue to put pressure on our long-term
                                financial sustainability

   $4.6b                            Council’s debt
                                     equates to
                                                                         Standard & Poor’s
                                                                         credit rating now

                                  $7,766                                  AA-
 total assets owned by
Council which includes
 recreational facilities
 owned by Bay Venues                per rating unit
        Limited.
18 ANNUAL REPORT 2018/19
Financial overview
The 2018/19 financial year has seen continued population growth in
Tauranga well above the national average. Population growth has
been reflected in the growth in residential rating units during the year,
which has increased by 2.6% through to our 2019/20 Annual Plan.
MANAGING OUR GROWTH INTO THE FUTURE
The challenge of ongoing population growth is reflected on ways to develop a more compact urban form. We need
in the requirements for new infrastructure to service to build upwards instead of outwards, in new growth areas
our growth areas and to manage increased utilisation and in existing urban areas.
of our existing infrastructure. Investment has begun on
As we fill our existing land areas set aside for development,
our new water treatment plant at Waiāri and associated
our subdivision impact fee revenue is reducing. Building
water supply network. Increased capacity for wastewater
activity is also reducing with the number of consents for
treatment at Te Maunga and the upgrade of our wastewater
new dwellings down from the highs of 2017 and 2018 to
outfall is also underway.
1,076 dwellings for the 2019 financial year. As a result, the
Our current growth areas at Pyes Pa West and Wairakei revenue received from development contributions is 20%
are rapidly being filled, with Pyes Pa West over 65% lower than last year at $26.6m. Two thirds of this revenue
consented and Wairakei over 38% consented. We have was from local development contributions charged on
commenced structure planning for our next growth areas at subdivision.
Tauriko West and Te Tumu and in parallel, we are working
Development Contributions Revenue
40
35
30
25
$ Millions
20
15
10
5
0
2009 2010 2011 2012 2013 2014 2015 2016 2017 2018 2019
Citywide Development Contributions Local Development ContributionsYEAR IN REVIEW 19
Residential building consents continue to reflect population growth but the number of consents continues to reduce.
New Dwellings Issued Thousands
2,000 160
140
No. New Dwellings Issued
1,500 120
100
Population
1,000 80
60
500 40
20
0 0
2009 2010 2011 2012 2013 2014 2015 2016 2017 2018 2019
New Dwellings Issued Population Growth (Estimated)
Building consents issued and value of investment $ Millions
No. Building Consents Issued
3,000 1,000
2,500
800
Consent Value
2,000
600
1,500
400
1,000
500 200
0 0
2015 2016 2017 2018 2019
Value of Investment ($) Building Consents Issued
PRESSURE ON INFRASTRUCTURE AND AMENITIES, CAPITAL INVESTMENT REQUIRED
The growth of our population puts continued pressure on $14m and a total project cost of $107m. Infrastructure to
our existing infrastructure and amenities. new growth areas at Pyes Pa and Wairakei accounted for a
further $20m.
For a second summer, water restrictions have been applied
because of the high level of usage from population growth Council agreed Housing Infrastructure funding (HIF)
and dry weather. Prior to 2017, water restrictions had not for Waiāri in the form of an interest-free loan. The first
been required for the previous 17 years. drawdown of this loan of $8.3m was undertaken in
May 2019. A total loan of $106m has been approved.
Our capital expenditure last year has been the highest
Government approved a further $52m loan to upgrade
ever achieved by our council. New capital investment is
the Te Maunga wastewater treatment plant, which is also
still required to meet the demand for infrastructure. Major
required to cater for our growing population. Although
investment to meet the demands of growth accounted
some expenditure has commenced on Te Maunga ($20m),
for $70m of the year’s capital programme. Significant
the first drawdown of the HIF loan to fund this expenditure
growth projects included the Waiāri Water Supply Scheme
is expected to occur early in the next financial year.
($14m spent this year) and Te Maunga Wastewater ($20m
spent this year). The new wastewater asset, the Southern Non-growth funded capital totalled over $100m of spend
Pipeline, was completed this year with expenditure of and covered a broad range of investments from a new20 ANNUAL REPORT 2018/19
airport terminal ($8m) to transportation projects (cycle Our total debt grows as we borrow more to cover the
ways and Harington Street carpark) and digital upgrades to costs of capital delivery. Some of the cost is covered by
support council business. NZTA funded $17m towards our development contribution revenue or depreciation which
transportation projects this year. The cost of purchasing reduces our borrowing requirements. The graph below
the properties at Bella Vista is included in this capital shows the growing value of our annual capital delivery and
spend (insurance proceeds offset $10.5m (including GST) the associated increase in our net debt.
of the Bella Vista acquisition cost).
Renewals remained steady at $23m for the year.
$ Millions New Capital Delivery and Net Debt $ Millions
$250 $500
$450
$200 $400
Capital Delivery
$350
$150 $300
Net Debt
$250
$100 $200
$150
$50 $100
$50
$0 $0
2009 2010 2011 2012 2013 2014 2015 2016 2017 2018 2019
Financial Years
Vested Assets TCC Capital Delivery Net Debt
OPERATIONAL RESULTS
The underlying operating result (operating revenue less Unbudgeted expenditure on Bella Vista, related to the
operating costs) is favourable to budget. It shows a deficit investigation and relocation of people, which was funded
of $12m against a budgeted deficit of $16m. Across from the corporate risk reserve.
most operations, council aims for a balanced budget so
The legal costs associated with the Bella Vista prosecution
we collect revenue to fund operational expenditure. The
were funded from rates surplus.
budgeted deficit is due to a couple of specific cases where
council does not budget to collect operational revenue to The purchase and remediation of Bella Vista properties will
cover costs. These include: be funded from insurance receipts and sale proceeds, and
is loan-funded in the interim.
• the non-funding 51% of transportation depreciation
($6.5m) to reflect the amount of renewal cost covered Overall, there is a small surplus of rates collected to cover
by NZTA operating costs. This surplus was due to slightly higher
rating units than were estimated at the time of the rates
• the loan-funded operational expenditure for items such
resolution and lower expenditure.
as capital grants to other organisations and structure
planning that council has agreed to loan-fund
SURPLUS BEFORE TAX
• funding expenditure from a reserve, for example, risk
The reported surplus is $60m (before tax) for the year
reserve, bio solids reserve, and the stormwater reserve
including asset revenue and investment property revaluations.
are funded over time to cover periodic rather than
The two items driving this variance from budget were much
annual costs.
lower vested assets ($26m unfavourable variance) and other
The deficit is favourable to budget as expenditure on expenses ($27m). Lower vested assets reflect delayed timing
structure planning has been deferred to next year. in the vesting of significant assets at Hairini and Wairakei.
Increased revenue from rates, finance revenue and NZTA Other losses include asset adjustments after revaluation and
grants have offset higher operational costs. write offs ($7m primarily in waters and roading), and valuationYEAR IN REVIEW 21
of interest rates swaps ($20m). The “loss” of $20m reflects picked up $16m of what should have been growth-funded
lower market interest rates at balance date. debt. Based on current projects (excluding the Southern
Pipeline) it is expected that a further $43m of growth debt will
OUR CREDIT RATING NOW AA- need to be picked up by ratepayers in the future.
Standard and Poor has upgraded our credit rating in October The Southern Pipeline project was completed above the
2018 from A+ to AA -. Amongst other factors the upgrade budgeted cost (on which development contribution charges
reflects a lower debt-to-revenue ratio than previously were set), and there will therefore be an under-collection of
forecast. This improved rating provides slightly lower debt development contributions. Where under-collection occurs,
servicing costs. the debt moves to become rate-funded debt. The amount of
development contributions received for the Southern Pipeline
COUNCIL ASSETS AND DEBT is yet to be calculated but will result in a transfer of some
growth debt identified above becoming rates debt.
We have had the highest expenditure ever on our capital
works programme to build and renew infrastructure and
RISK MANAGEMENT FUND RESERVE
amenity assets. Total capital expenditure (excluding land
sales) was $206m (including the purchase of Bella Vista The risk management fund is a council created reserve (i.e.
properties and other property purchases) along with $25m set up voluntarily). It was established in order to help manage
of new assets vested by developers. This year our road and council’s financial risk and to fund unforeseen events. The
water infrastructure assets were revalued. The revaluation of reserve is generally funded from a direct allocation from
infrastructure assets has increased our physical assets by rates, set by the mayor and councillors. There have also been
$322m. Council’s total assets are $4.5b compared to $4.1b occasions (as in 2018) where the rates surplus has been
in 2018. transferred into the reserve.
Overall net debt has increased to $441m which is a net Since 1 July 2013 the reserve has been used to fund:
increase of $92m on last year. - Leaky home and weathertight home provisions
The cost of council borrowings in 2019 is funded 27% - Removal of staff from Willow Street administration
from growth (Development Contributions and Housing building, which has since been demolished
Infrastructure Fund (HIF), 70% from rates and 3% through
User Fees (for example, Airport, Bay Venues Limited, - Bella Vista operating costs.
and Parking). The reserve is currently in deficit. This means that payments
that are anticipated to be required in the future are higher than
Growth funded capital projects are initially funded by
funds that have been collected in the past. At some point
borrowing with the repayment of principle and interest
future ratepayers are expected to have to fund these costs.
recovered over time from development contributions.
However, there is a risk that the development contributions The balance of the risk management fund at June 2019 is
we collect are not sufficient to fund the full costs of this debt a $15.5m deficit. This is due to a provision for weathertight
and interest. When there is under-collection of development (leaky) homes of $19m that has not been paid out but
contributions the cost of servicing and repaying growth represents an amount we believe is likely to be paid out in
funded debt falls to the ratepayer. To date ratepayers have the future.
$ Millions Breakdown of Debt Funding
550
500
450
400
350
300
250
200
150
100
50
0
2015 2016 2017 2018 2019
Growth Debt HIF Debt Rate Funded Debt Growth Debt Transferred to Ratepayer
Portion of Growth Debt likely to require transfer to Ratepayer User Fees Funded Debt22 ANNUAL REPORT 2018/19
COUNCIL GRANTS AND COMMUNITY CONTRACTS
We support, with grants and community contracts, a range of other organisations that deliver services and benefits to the
Tauranga community.
Tauranga City Council Support for External Organisations above $39,000
Actual Actual
2018/19 2017/18
$’000 $’000
Bay Venues Limited*1 6,758 6,713
Tourism Bay of Plenty* 2
2,127 1,482
Art Gallery 943 929
BOPLASS Ltd 307 274
Creative Bay of Plenty 304 326
The Elms Foundation 225 188
Mainstreet Organisations*3
Tauranga Mainstreet 327 311
Mount Mainstreet 171 163
Greerton Mainstreet 116 111
Pāpāmoa Mainstreet 50 50
Priority One 1,228 990
Sport BOP 364 349
Surf Lifesaving *4 975 867
Bay Oval Trust 0 774
Chamber of Commerce 59 58
Citizens Advice Bureau 60 55
Export BOP 0 55
BOP Film 75 75
Venture Centre 277 398
The Incubator Growing Art & Culture Charitable Trust 113 0
Recycling /Waste Minmisation initiatives*5 39 0
Community Development match fund & civic grants and donations*6 135 0
Collaborative initiatives*7 75 0
Tauranga Hockey Association 600 0
Harbourside Netball Centre 250 0
15,578 14,168
*1 Support for Bay Venues Limited includes capital and operating grants and payments. It includes the renewals grant of $3.4m (2018: $3.6m) which
was funded from the depreciation reserve held by Tauranga City Council, but excludes the rate funded contribution to the depreciation reserve of
$4m (2018:$3.9m)
*2 Includes $493k (2018: $491k) for the Visitor Information Centre contract.
*3 Mainstreet organisations are funded from Targeted rates on the relevant commercial businesses.
*4 Includes contribution towards re-development of the Mt Maunganui Lifeguard Centre and start-up contribution towards the Pāpāmoa Surf Rescue
Base.
*5 Includes $20k to the Good Neighbour Food Rescue Project.
*6 Includes 36 community grants through the Community Development Match Fund.
*7 Includes support to The Kollective and the Tauranga Youth Development Team
This year reporting has included the Arts and Culture Strategy Funding to The Incubator and the Community Match Fund.
Other lines included showing a nil spend for 2018 are new initiatives or had no spend in 2018.YEAR IN REVIEW 23
Our financial accounts are consolidated with the accounts The Mainstreet organisations represent commercial
of two of our Council Controlled Organisations, Bay Venues interests in four main town centres of Tauranga:
Limited (BVL) and Tauranga Art Gallery. The largest of
• Tauranga city centre
these entities is BVL, which owns and operates recreation
and community facilities on behalf of council, including the • Mount Maunganui
Trustpower Arena, Baywave and the University of Waikato • Greerton
Adams Centre for High Performance. BVL has total assets • Pāpāmoa
of $120m. The Tauranga Art Gallery has total assets of
$10.2m, consisting mainly of the art gallery itself and the Council levies a targeted rate at the amount agreed by the
underlying land. Mainstreet organisations to support their operations.
Council has a 50% interest in Tourism Bay of Plenty In addition to these grants and community contracts, we
(TBOP) and also provides TBOP an operational grant which support other organisations and groups that deliver both
is funded from commercial rates, and a service delivery community events and major events, and community
contract to operate the Visitor Information Service. initiatives. Our contribution to events this year totalled
$734k. Details of the events supported are provided in the
City Events activity in section 5 - Groups of Activities.
TRENDS IN OUR CORE FINANCIALS
The table below summarises five years of key financial data. Operating revenue and expenditure have increased over the
past five years with continued population growth. Debt levels decreased with the sale of Route K for $61m to NZTA in
2015. Debt levels are now increasing again due to the significant demand for new infrastructure to meet the demands of
population growth.
Tauranga City Council five year performance summary ($ millions)
2015 2016 2017 2018 2019
Rates Revenue * 1
131 138 145 155 167
Other Revenue 65 66 73 55 62
Operating Expenditure 174 191 201 223 242
Operating Surplus/(Deficit) 22 13 17 (13) (12)
Development Contribution Revenue 19 27 36 33 27
Capital Expenditure*3 90 106 145 142 206
Capital Subsidies*5 9 6 8 33 22
Gross External Debt 330 316 355 370 458
Net External Debt 304*2 297 301 349 441
Fixed Assets (Net Book Value) *4 3,266 3,404 3,535 4,000 4,333
*1 Including water by meter revenue.
*2 Net Debt includes the GST portion from NZTA for the sale of Route K ($9.3m). Adjusted Net Debt to eliminate this transaction is $304m.
*3 Capital expenditure less vested assets and excluding land sales.
*4 Fixed Assets include physical assets, property, plant and equipment, forests, investment property and non current assets held for sale.
*5 Capital subsidies are predominantly from NZTA for local roading infrastructure.
Limits 2015 2016 2017 2018 2019
Proportion of Rates to Operating Revenue 63.7% 64.7% 63.4% 64.4% 66.7%
Net External Term Debt to Total Assets 9.2% 8.3% 8.0% 8.5% 9.8%
Net External Debt per Rateable Property 5,676 5,603 5,541 6,223 7,766
Net Interest Expense to Operating Revenue < 20% 11.7% 10.1% 8.4% 7.9% 7.4%
Net Debt to Operating Revenue < 250% 164% 155% 151% 167% 176%
Net Interest Expense to Rates Revenue < 25% 16% 13% 11% 11% 11%
Rates increase after growth *6 including
water by meter 5.9% 3.4% 2.6% 3.9% 5.4%
Rates increase after growth including water Varies each
by meter - Limit year 4.0% 3.7% 3.9% 4.0% 5.8%
*6 Growth factors of 1.2% in 2015, 1.8% in 2016, 2.5% in 2017, 3.1% in 2018, 2.6% in 201924 ANNUAL REPORT 2018/19
WHAT DID RATES AND USER FEES PAY FOR OVER THE PAST YEAR?
Rates and user fees and charges cover the operational (day-to-day) costs of running a city. This includes providing core
services and ensuring infrastructure is maintained. About 69% of all of our operating expenditure is covered by rates. The
remainder is covered by user fees and charges and subsidies from other organisations, particularly NZTA.
The rates graph shows the services that rates fund. Over half of rates (55%) were spent on roads and water infrastructure
(transportation, wastewater, water supply and stormwater), and about 29% of total rates funded our city’s libraries, parks
and recreation, and other community facilities.
2018/19 Rates Distribution = $167m
Governance 3%
17% Parks and recreation
Corporate services -5%
Recreation - Bay Venues Limited 6%
City and infrastructure
3% planning
14% Resource recovery
Water supply 3% and waste
Culture and
6% community
Economic
2% development
6% Libraries
Wastewater 16%
Monitoring,
4% regulation and
response
Transportation 12% 13% Stormwater
*Rates requirement for each activity are offset by net interest not allocated to activitiesYEAR IN REVIEW 25
WHAT DID OUR NEW DEBT PAY FOR OVER THE LAST YEAR?
Capital expenditure pays for buying or building new assets, renewing existing assets and improving them to deliver a
better service. The majority of our capital works programme was spent on our core network infrastructure (transportation,
wastewater, water supply and stormwater), which accounted for 70% of our capital expenditure this year. Key projects that
were delivered or are ongoing are identified further below.
2018/19 Capital Expenditure = $206m
Airport 4% 2% City Centre
Parks and recreation 5% 3% Digital services
1% Libraries
Water supply 12% 1% Marine facilities
14% Other
Wastewater 21%
10% Stormwater
Transportation 27%
*Capital Expenditure Excluding Vested Assets and Land Sales26 ANNUAL REPORT 2018/19
CAPITAL EXPENDITURE
The following projects represent significant projects in terms of actual expenditure and public profile.
Budget
Actual 2018/19
Activity Project
2018/19 Annual Plan
$m $m*
Wastewater Te Maunga WWTP Upgrade and Outfall Pipeline $20.0 $33.4
Transportation Harington Street Carpark $13.4 $18.6
Water Supply Waiāri New Water Supply $14.1 $17.0
City Centre Civic Rebuild $5.7 $11.4
Transportation and three waters Eastern Corridor $12.2 $11.2
Transportation Cycleways and Pedestrian Underpasses/Overbridges $7.7 $12.0
Wastewater Southern Pipeline Wastewater Trunk Main $13.6 $10.8
Digital Services Digital Services: Software System Investment $5.3 $7.9
Transportation and three waters Kennedy Road Infrastructure $8.1 $5.9
Airport Airport Upgrade: Terminal Extension $7.8 $6.9
Transportation LED Streetlighting Upgrade $1.2 $4.6
Reservoir Development: Water Supply Joyce Rd,
Water Supply Eastern, Pyes Pa and Welcome Bay $1.8 $1.6
Various activities Other Growth Projects $8.3 $32.3
Various activities Other Level of Service Projects $63.9 $84.2
Various Activities Renewal of Tauranga City Council Assets $23.1 $28.2
Various Activities Adjustment Projects -$72.0
Total Capital Expenditure Excluding Vested Assets and Land Sales $206.2 $213.9
* Budget excludes carry forward budgets from 2017/18 that were not rebudgeted as part of the Long Term Plan.YEAR IN REVIEW 27
28   ANNUAL REPORT 2018/19

           Non-financial performance

               68%                                        24%                                           8%
                                                       of measures not                            of measures unable
         of measures achieved                              achieved                                  to be assessed
             100 measures                                36 measures                                  12 measures

                                                 All targets achieved for

            5                            Cemeteries              Environmental Protection          Parks and Recreation

        activities

                                                        Wastewater                       Water Supply

                                       We exceeded a number of our targets

         476,000 passengers through                    250,479 visitors to the                500 participants in adult
                 the airport.                            Historic Village.                      cycling programmes.
              Target was 381,000                         Target was 175,000                          Target was 200

                                                    78,921 record occupancy at             144 education facilities engaged
        45 youth events held on public
                                                   Mount Maunganui Beachside                  in Resource Wise Schools
                 open space.
                                                           Holiday Park.                            programme.
                 Target was 10
                                                         Target was 72,000                           Target was 30

                                                                                                  86 programmes
        17 waste reduction workshops               34,627 participants in library
                                                                                            imbedding Tauranga heritage
         delivered to the community.                       programmes.
                                                                                              topics of Tikanga Māori.
                 Target was 10                           Target was 22,000
                                                                                                     Target was 50

                                                                         629 heritage items loaned
                                  8 exhibitions or displays
                                                                          to schools through the
                                 of our Heritage Collection.
                                                                        Hands On Tauranga service.
                                        Target was 2
                                                                                 Target was 250
YEAR IN REVIEW 29
We didn’t meet 24% (36) of our targets
15 measures were within 1-10% of their target
Emergency Regulation Resource Recovery
Management Monitoring and Waste
24%
While emergency Our regulation Performance in resource
management was monitoring activity has recovery and waste has
overall positive, we performed well, we been positive, we have
missed two targets by missed two targets not achieved two targets
more than 40% due to by over 20% due to relating to Certified
only recently recruiting reducing patrols of Emissions Measurement
the required roles, freedom camping sites and Reduction Scheme
however the missed as we found a high level certification and
targets do highlight of compliance through completing actions from
the need to increase the year, and due to a our Energy Management
training of our staff. reduction of attendance Action Plan as this work
of school patrols is still in progress.
following reprioritisation
of resources.
We could not assess 8% (12) of our targets for
reasons that included
N/A
Data not yet Source of information Information that has not
being available being no longer available been captured
Examples: Example: Examples:
8% • Airport and marine
precinct customer
• The AA no longer
provide a tourism
• Customer
satisfaction
satisfaction surveys review and therefore, surveys for council
due in Q2 2019/20 the Mount Maunganui delivered events
Beachside Holiday
• Quality of ride • New people
Park will use the Net
of sealed road counters required
Performer Score in
measured by an to record visits
future.
external provider to community
due in Q4 2019/20. libraries.30 ANNUAL REPORT 2018/19
Non-financial performance
summary
We achieved 68% of our non-financial performance measures.
Council delivers a range of different activities and We have 148 performance measures that cover the
services to the community. We strive to deliver the high range of our 27 activities. For the 2018/19 year, 12 of
level of service that the community expects from us. these were unable to be reported on, either due to data
being unavailable (such as census data being released
Our non-financial performance measures are set
only every five years), or because there was no directly
through the LTP and outline the level of service and
comparable result from previous years.
performance targets for all our activities.
Of the remaining 136 measures, we achieved 100. This
Throughout the year, we monitor our performance
represents 74% of the measures we are able to report
to ensure we are achieving these, and report back
on, or 68% of all our performance measures.
the results quarterly and annually. We use a range
of technical measures such as our compliance with
bacteriological standards for drinking water quality, to
perception-based measures such as the percentage of
residents that feel safe in their neighbourhood after dark.
Non-financial performance summary
12 Measures 8%
36 Measures 24%
68% 100 Measures
Achieved
Not achieved
Not measuredYEAR IN REVIEW 31
Non-financial performance by activity
Airport 1 4
Animal Services 1 3
Arts and Heritage 2 4
Baycourt 3 2
Beachside 1 1 1
Building Services 2 2 1
Cemeteries 2
City Centre 1 2
City Events 1 2 3
City Planning and Infrastructure 1 2
Community Development 3 5
Economic Development 1 4
Elder Housing 1 1
Emergency Management 1 3 5
Environmental Planning 1 1 1
Environmental Protection 6
Governance 1 2
Libraries 1 2 5
Marine Facilities 1 1
Marine Precinct 1 1 4
Parks and Recreation 6
Regulation Monitoring 3 1
Resource Recovery and Waste 3 8
Stormwater 1 4
Transportation 1 4 8
Wastewater 5
Water Supply 10
0 2 4 6 8 10 12 14
Achieved Not achieved No data available32 ANNUAL REPORT 2018/19
YEAR IN REVIEW 33
City events
Our city hosted many events during the past year, with a significant
number of these supported by our Event Funding Framework and/
or facilitation services. There were many highlights, notably the
nationally recognised Anchor AIMS Games, celebrating its 15th
year, and the Field of Remembrance, Homecoming Exhibition and
Centenary Service commemorating the centenary of Armistice Day.
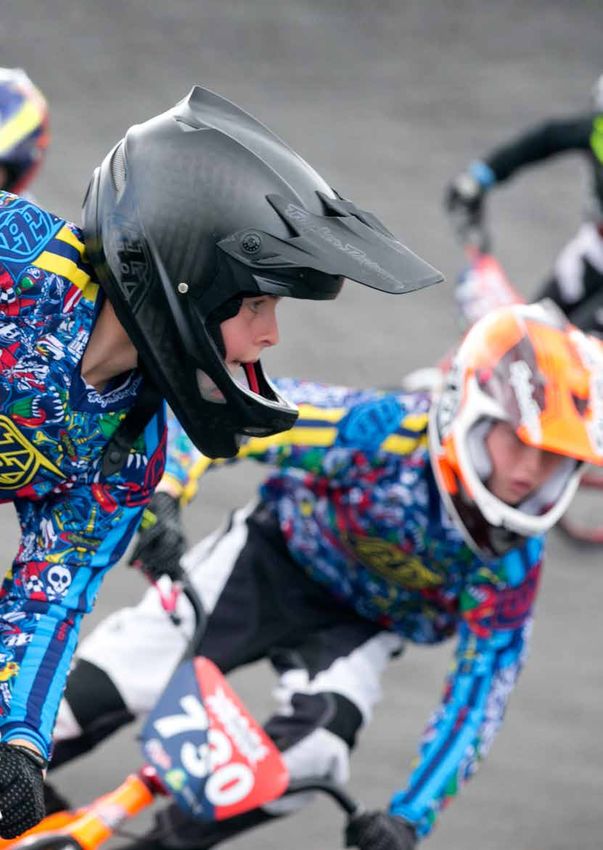
ANCHOR AIMS GAMES
We welcomed yet another successful Anchor AIMS Games in 2018, with more
than 20,000 competitors, officials and supporters descending on Tauranga for
six days. This is the largest international sporting event for 11 to 13 year olds in
the southern hemisphere and we are proud to host and part-fund these games
in our city each year, in collaboration with the AIMS Games Trust, Sport Bay of
Plenty and the four Western Bay Intermediate Schools. What began 15 years
ago as a small festival of sport is now considered the premier international
sporting championship for intermediate and middle schools throughout the
country. The tournament was recognised this year with the Outstanding Event
award from Recreation Aotearoa.
ARMISTICE CENTENARY COMMEMORATIONS – FIELD OF
REMEMBRANCE, HOMECOMING EXHIBITION AND CENTENARY SERVICE
11 November 2018 marked the centenary of the armistice, when the First World
War finally gave way to peace after four years of brutal conflict.
We created a ‘Field of Remembrance’ to honour our fallen, consisting of 109
white crosses installed at dawn in the lead-up to Armistice Day. The months
that the First World War lasted were carefully translated into a period of 28 days
to represent the time when the soldiers from Tauranga died. Between October
and November, cadets from units including the Western Bay of Plenty Cadet
Unit brought out crosses carrying the names of the men from Tauranga who did
not return from the war. The crosses were relocated to Memorial Park for the
Armistice Day commemoration service.
The waterfront also hosted an exhibition called ‘Homecomings: From Tauranga
to the Trenches’ that told the stories of local soldiers who made it back to
Aotearoa.
The commemoration culminated with the Armistice Day Centenary Service at
11am on 11 November at Memorial Park.34 ANNUAL REPORT 2018/19
A snapshot of events delivered, funded or
held in our spaces and places
2018
07 08 09
July August September
Tauranga Coffee Festival Mount Maunganui Half Marathon Groundswell Festival of Innovation
Winter Nights Winter Lights Groundswell Festival of Innovation Run Beneath The Stars
Matariki Kite Day Anchor AIMS Games
Vegan Vibes
Cherry Blossom Festival
Pedal Pāpāmoa
Tauranga International Marathon
10 11 12
October November December
HoopNation Bay of Plenty Garden and Art Festival Tinman Triathlon
2018 New Zealand Gymnastic City To Surf TECT National Sevens
Championships Armistice Centenary Our Christmas
Tauranga Moana Tauranga Tangata Commemorations – Field Of A Night Before Christmas
Festival Remembrance, Homecoming
Exhibition and Centenary Service Trustpower Christmas Party On The
Waterfront
Brewers Park Summer Series
Mount Monster
Tauranga Beach Polo
New Year’s Eve – Community
Celebrations (Pāpāmoa, Tauranga
city centre and Matua) and midnight
fireworks
International Summer of CricketYEAR IN REVIEW 35
2019
01 02 03
January February March
New Zealand Beach Volleyball Water Polo On The Waterfront TSB National Surf Life Saving
Championships Championships
Generation Homes Womens Triathlon
Mount Maunganui Beach Volleyball Festival of Disability Sport
Waitangi Day Dawn Service
Open The Bay of Plenty Gin Festival
Barrett Homes Open of Surf
International Summer of Cricket ‘Gincredible’
NZ Open Swim Series – Sand to Surf
Fat Freddy’s Drop concert Oceans 19 – Surf Life Saving NZ
Weetbix Kids TRYathlon Under 14 National Championships
We Run The Night Half Marathon
National Remembrance Service
Sikh Community Street Parade
Food for Thought
One Love Festival
Diner en Blanc
Mount Festival of Multisport
Tauranga Moana Pride Picnic
Sprint Marra Triathlon
20th Tauranga Multicultural Festival
04 05 06
April May June
ANZAC Day Civic Memorial Service Plunket Buggy Fun Run Armageddon Expo
National Jazz Festival Shakti In The Park TEDx Tauranga
Tattoo and Art Extravaganza Mount Runner and Walkers Half
Marathon
Tauranga Pay What You Want Half
Marathon36 ANNUAL REPORT 2018/19
Awards and recognition
We received the following awards and commendations during 2018/19.
Award Association Received for
Outstanding Event 2018 Recreation Aotearoa Anchor AIMS Games 2018 (in partnership
with the AIMS Games Trust and Sport
Bay of Plenty)
Bikes at Work and School Award New Zealand Transport Agency and Tauranga City Council E-Bike Initiative
Cycling Action Network
Outstanding Project Award Recreation Aotearoa Kopurererua Valley restoration (in
partnership with Ngai Tamarāwaho)
Leadership Award for Road Safety New Zealand Local Authority Traffic Travel Safe initiative
Institute
Leadership Award for Sustainability New Zealand Local Authority Traffic Smarter Transport Choice initiatives
Institute
Best of Parks Green Flag Award Recreation Aotearoa TECT All Terrain Adventure Park (in
partnership with Western Bay of Plenty
District Council)
Merit in the Outstanding Park 2018 Recreation Aotearoa Mauao Historic Reserve (owned by the
category Mauao Trust and managed by Tauranga
City Council)
TripAdvisor 2019 Certificate of TripAdvisor The Historic Village
Excellence
Judges’ Choice Award Bay of Plenty Property People Awards – The ‘Access to Water’ project
Property Council New Zealand
TripAdvisor 2019 Certificate of TripAdvisor Mount Maunganui Beachside Holiday
Excellence Park
Gold Sustainable Tourism Business Qualmark Mount Maunganui Beachside Holiday
Award and 4 Star Plus Holiday Grade Park
Gold Sustainable Tourism Business Qualmark Baycourt
AwardYEAR IN REVIEW 37 Community awards The 2018 Tauranga Accessibility Awards facilitated by Tauranga City Council’s Disability Advisory Group, were judged by MP Jan Tinetti and Councillor Leanne Brown, and were awarded by Mayor Brownless at the Community & Culture Committee on 9 October 2018. Award Most Inclusive Community Event Award Anchor AIMS Games 2018 Most Inclusive Small Business Award Studio Nautilus (Pāpāmoa Air BnB) Most Inclusive Large Business Award Bayfair Shopping Centre Most Accessible and Inclusive Commercial Building Development Award Sanderson Group for Bethlehem Shores Most Accessible and Inclusive Residential Building Development Award Cudby Homes A week prior, on 1 October 2018 (International Day of Older Persons), our Team Leader of Community Development, Dani Jurgeleit, received the Age Concern Tauranga Dignity Champion Award for dedicated commitment to ensure older people are considered, valued and respected in the community. (L-R) Rob Egan and Vicki Semple (Anchor AIMS Games), MP Jan Tinetti, Lucinha and Paul Curry (Studio Nautilus), Sarah and Neil Cudby (Cudby Homes), Nathan Sanderson (Bethlehem Shores).
38   ANNUAL REPORT 2018/19

     Project Tauranga
     Project Tauranga is a unique programme that
     encourages organisations to invest in innovative,
     exciting projects that benefit our community, so
     that we can get more things done in our rapidly
     growing city.

     Project Tauranga transforms promising ideas into               exhibitions, promoted sports and getting more people
     successful ventures by matching our partners’ strengths,       active, built bike tracks in schools, and supported
     values and aspirations with great projects. Partners           people with disabilities. They helped our not-for-profit
     contribute cash, goods or in-kind services – or a mixture      organisations support vulnerable people including
     of these. Since 2003, the programme has generated              homeless women and families. They moved heavy things
     millions of dollars in funding and assistance for community    around, planted trees, provided flood-lighting for children’s
     projects. It has become a model for council-related            playing fields, helped maintain our green spaces including
     philanthropic giving and has fostered a collaborative way of   Mauao, and much, much more. In short, Project Tauranga
     working that has benefits throughout the community.            partners have worked hard behind the scenes to deliver
                                                                    multiple projects, making Tauranga an even better place to
     Project Tauranga partners have had a busy year. Much
                                                                    live, work and play.
     of the support is behind the scenes, for example, helping
     the Acorn Foundation, or promoting and supporting              Some of Project Tauranga’s high profile projects are
     community events. Partners cleaned streams and                 highlighted, but we would like to extend a warm, heartfelt
     estuaries, educated the community about pollution and          ‘thank you’ to all of our partners for their generous support
     our beautiful environment, supported artists and art           and for making a real difference.
YEAR IN REVIEW 39
Highlights of the year
SIMPSON GRIERSON SUPPORTS COMMUNITY ARTS AND CULTURE
PERPETUAL FUND FOR ARTISTS
Project Tauranga partner Simpson Grierson, Creative Bay of Plenty, and
the Acorn Foundation established the Creative Bay of Plenty Community
Arts and Culture Fund. This is a game-changer for the creative community.
The donation from Simpson Grierson has been invested in perpetuity,
with distributions from this fund paying out from 2020. This means that
the Community Arts and Culture Fund will contribute to the arts in our
community annually, forever.
TEDXTAURANGA SUPPORTED BY POWERCO, TECT, THE HITS, BAY
OF PLENTY TIMES, SIMPSON GRIERSON, COMVITA
Project Tauranga partners are helping lead the way with Ideas Worth
Spreading with Powerco and TECT as principal sponsors for Tauranga’s
own TEDx event. Held every two years, TEDxTauranga showcases
informed, fascinating and inspirational speakers to share their stories and
insights. This year was the best ever, with amazing stories of innovation
and hope for a better future for us all.
OFFICEMAX SUPPORTS AWHINA HOUSE
This year saw the opening of Awhina House, a 12-bed home especially for
homeless women. Homeless women face extreme vulnerability on top of
the pressure and hardships of homelessness and Awhina House provides
a safe space for women. The generous team at OfficeMax recognised the
gravity of the challenge faced by homeless women and the safety offered
by Awhina House by helping to fit out a safe space.
For more information visit www.tauranga.govt.nz/community/project-tauranga40 ANNUAL REPORT 2018/19
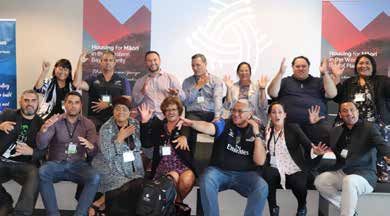
Working with Tangata Whenua
Council is committed to a partnership with tangata whenua that
honours the principles of Te Tiriti o Waitangi and reflects the history
and establishment of the city of Tauranga.
The last few years have offered each of the four council committees. Operationally the aspirations,
more opportunities to work together, These appointments have added a strategies, and voice of tangata
to understand each other’s needs tangata whenua perspective to the whenua are supported through the
and to bring forward initiatives that decision-making processes, with Takawaenga Māori Unit. Takawaenga
make Tauranga a better place. each appointee possessing technical means to traverse the area between
We are working to strengthen the skill and experience that adds entities, and this is precisely the
partnership with tangata whenua, substantial value to the city. role of the unit. Through a small
while respecting the mana motuhake team of 4.5 full-time employees, the
The MWP has mandated
(autonomy) of each iwi and hapū unit seeks to enable constructive
representatives from all 17 iwi and
to build their own relationships and interaction between over 600 council
hapū recognised within council staff and the 17 iwi and hapū groups.
speak with their own voice.
boundaries. They meet monthly
The partnership is recognised by to provide guidance and advice The MWP has identified the
Council structures through the on strategies, policies, planning development of papakāinga housing
Mana Whenua o Tauranga Moana documents and processes within on Māori land as the top priority. This
Partnership (MWP)*, including a Council. reflects conversations where both
standing committee alongside the partners are interested in developing
Each iwi and hapū has a protocol with solutions and strategies in areas
mayor and councillors, which formally
Council that provides guidelines on of mutual benefit. For Council, this
meets four times per year. There are
how we interact together and identify forms part of the complex solution
also four informal meetings where the
mandated representatives. Many iwi for the housing challenges in our fast
mayor and councillors are invited to
and hapū also have management growing city. For tangata whenua,
iwi and hapū communities to discuss
plans which set out their priorities it seeks to enable and encourage
issues relevant to those places.
and areas of influence, and these give more utilisation of Māori land, ideally
This year has seen the inclusion of Council guidance on areas of mutual without increasing the threat of
tangata whenua representatives on interest. alienation.
* Previously named the Tangata Whenua / Tauranga City Council CommitteeYEAR IN REVIEW 41
Many opportunities and innovations TANGATA WHENUA TE KETE A ROHE: CULTURAL
can be unlocked through this REPRESENTATION ON CONNECTIONS
partnership, for the benefit of the city. COMMITTEES
This two-day programme entails a
These include:
In line with the principles of Te Tiriti brief history of Māori in the Tauranga
o Waitangi, representation on each region and the structures in place
ARA RAU TANGATA
of the council committees brings our today. The day-two highlight is a
The Ara Rau Tangata Symposium partners to the table on important bus tour hosted by tangata whenua
has been established in an effort to aspects of running and developing that visits many significant parts of
draw out the aspirations of Tauranga the city. The views of tangata whenua the city and explains why they are
Māori in a culturally appropriate are expressed in a lively manner, important to Māori.
manner. In this way, it is expected befitting the nature of debate and
We have reviewed and updated this
that aspirations will be clearer and decision-making in council. The
programme continually over the last
better connected to the experiences representatives are supported by the
12 years, based largely on participant
in Māori communities. This higher MWP, which provides clear advice
feedback. It ensures that our staff
level of clarity should increase and guidance to representatives of
understand the cultural background
understanding for planners, policy collective positions on each subject.
to projects and activities across the
writers and strategists in a range
The appointees’ calibre, experience city.
of organisations. This will help us
and technical abilities have proven to
build our city in a way that meets the
be a great resource for the city.
desires of the community.
Ara Rau Tangata is designed to KIA ORA TAURANGA
disrupt traditional planning processes
The Kia Ora Tauranga initiative
where Māori communities are
has been hugely successful in
dragged out of their realities to
helping council teams learn basic
engage and inform councils on
pronunciation. Internal and external
unfamiliar concepts, strategies and
feedback has been great, with
processes. This approach has had
increased level of confidence and
limited success, and has proven to be
ability creating a ‘welcoming feel’.
laborious.
Adding Te Reo Māori to the tools
We have held two symposiums which available to our staff helps them
have provided exciting feedback, to connect more widely in our
and we will continue to work with our community, which is a great outcome.
tangata whenua partners to innovate
and improve the way we consult,
engage and collaborate.You can also read