Economic and Strategy Viewpoint - October 2019 - Schroders
←
→
Page content transcription
If your browser does not render page correctly, please read the page content below
Economic
and Strategy
Viewpoint
October 2019
3
                            Recovery hopes and de-leveraging cycles
                            –    Hopes of a trade deal between the US and China have helped risk assets of late, but
                                 there is little evidence of recovery in the survey data. There is evidence though that
                                 investors had became too gloomy in the US where data is now surprising on
                                 the upside.
                            –    This US cycle has been long, but also weak as households have spent the decade
                                 de-leveraging. Key to the success of the Federal Reserve's monetary policy will be
Keith Wade                       household willingness to reverse this trend. Otherwise stronger activity may have to
Chief Economist and
                                 wait for fiscal support after the presidential election.
Strategist

                            7
                            The Rocky Horror Brexit Show
                            –    A hostile mood has descended in Westminster as we approach the 31 October
                                 Halloween Brexit deadline. The government has lost its majority, and every vote since
                                 Johnson became Prime Minister.
                            –    The Benn Act should ensure a delay to the deadline unless a new deal is agreed, that
                                 is assuming Johnson does not attempt to circumvent the law. Betting markets show
                                 the probability of a no-deal Brexit in 2019 has fallen sharply, helping to lift sterling.
                            –    We explore the most likely potential paths for the next few months, including what
Azad Zangana                     a general election could mean, and the economic impact of the different
Senior European Economist        Brexit scenarios.
and Strategist

                            12
                            Should, would or could China aggressively devalue?
                            –    While a devaluation of the renminbi might appear an obvious counter to rising tariffs
                                 from the US, China would face prohibitive costs in doing so and with no guarantee
                                 that it would prove a panacea.
                            –    Equally, though its resources are limited, China’s central bank is unlikely to be forced
                                 to abandon the defence of the currency altogether. However, commitment to even a
                                 floating peg will tie its hands in other ways
Craig Botham                Chart: Emerging markets brighten on hopes of trade recovery
Senior Emerging Markets
Economist

                            Source: Refinitiv Datastream, Schroders Economics Group G00008. 26 September 2019.

                                                                       Economic and Strategy Viewpoint October 2019    2
Recovery hopes and de-leveraging cycles
“Neither a borrower nor lender be”
William Shakespeare, Hamlet Act 1
Signs of recovery?
A turning point? Markets sense a turning point in global activity. Equities have rallied and sovereign
bond yields have ticked up. Within equity markets the emerging markets are
leading the way, an indication that growth expectations are improving given the link
with global trade (see chart front page). Hopes of a trade deal between the US and
China have helped, but there is little evidence of recovery in the survey data with the
global purchasing managers index (PMI) falling further in August as the service
sector weakened.
However, whilst these indicators do not bode well for global growth, there are signs
that the worst may be behind us in the US where data is now surprising on the upside.
Home sales, manufacturing output and retail sales have beaten expectations. The
survey weakness is concentrated outside the US, particularly in Europe where the
latest PMI's have been feeble. China has also seen soft data, although our activity
indicator which adjusts for inflation ticked up in August.
Markets probably became too gloomy on the outlook earlier in the summer and we
may see further improvement in the short run. The key will be whether the slowdown
in manufacturing feeds into services with the link being a weaker labour market. If
this doesn't happen then markets may strengthen further, however with profits
under pressure lay-offs could accelerate further hitting households.
The longer run issue for the world economy remains the same though: a deficiency
in demand with no obvious global locomotive. In this respect the current cycle has
been very different from the past. In the next section we explore those differences
from the perspective of the current US expansion with a focus on that previous driver
of global growth, the consumer.
A cycle like no other
Much has been made of the fact that the US is currently enjoying its longest
The US is
expansion since the National Bureau for Economic Research (NBER) records began
enjoying its
in 1854. The current expansion, which emerged in the dark days of 2009, became
longest expansion the longest in June when it surpassed the previous record of 10 years (chart 1).
on record…
Economic and Strategy Viewpoint October 2019 3Chart 1: Longest on record: US expansions by length
Source: National Bureau of Economic Research, Schroders Economics Group. 24 September 2019.
…but also one of However, whilst this is a remarkable achievement which has helped underpin the
the weakest long bull market in equities, there has been less focus on the fact that this has also
been one of the weakest expansions on record. Looking at the annualised growth
rate of GDP during each of the 10 expansions since 1954, the current is the second
weakest since 1954. If we exclude the very brief 1980–81 episode, then it is the
weakest with GDP rising at just under 2% annualised. This compares with average
growth rates of 2.7% in the last expansion prior to the Global Financial Crisis (GFC)
and 3.4% before that. Typically expansions have averaged between 3% and 4% GDP
growth (chart 2).
Chart 2: US GDP growth: contributions by cycle expansions
Source: NBER, Schroders Economics Group. 24 September 2019.
Consumer and In terms of the components of GDP the weakness can be largely attributed to the
government consumer which contributed 1.5 percentage points (pp) of the rise in GDP compared
spending account with 2.1 pp in the previous cycle and 2.5 pp in the one before last. There was also a
negligible contribution from government spending compared with positive
for the slowdown
contributions in all of the previous cycles bar two. This would largely reflect cuts in
public investment, but also layoffs at the state and local level.
Economic and Strategy Viewpoint October 2019 4On the more positive side, trade has been less of a drag than before the crisis.
Meanwhile, fixed investment has actually held up in the current cycle and whilst not
as strong as in earlier periods such as the 1990s expansion, has made more of a
contribution than in the last cycle. This though may change as geopolitical
uncertainty (trade wars, etc.) takes its toll on business confidence and spending. The
latest CEO survey in the US indicates that business investment is set to decelerate
further (chart 3).
Chart 3: CEO survey signals further weakness in investment
Source: Refinitiv Datastream, Schroders Economics Group. 24 September 2019.
Coming back to the cycle as a whole, the pattern of consumer and corporate
spending is reflected in the debt markets. Households in the US have been
deleveraging since the GFC, whilst after a brief period of debt consolidation corporate
gearing has been rising. Admittedly much of the latter has gone into share buy backs
rather than capital spending, but nonetheless there is a contrast with the personal
sector where debt to GDP has declined from 98% in Q1 2008 to 74% in Q2 this year
(chart 4).
Chart 4: US debt by sector
Source: Refinitiv Datastream, Schroders Economics Group. 24 September 2019.
A decade of Overall the level of debt in the economy has risen as a share of GDP from 227% to
de-leveraging for 247% largely as a consequence of the increase in government debt to nearly 100%.
US households For the household sector though the past decade marks a sea change in behaviour
as we have never seen such a sustained period of debt reduction. There have been
phases where household leverage has stabilised, or fallen slightly, such as from the
mid-60s to early 1970s and in the early 1980s. However, with the exception of these
Economic and Strategy Viewpoint October 2019 5periods the household debt to GDP ratio rose steadily from 1960 to the GFC with an
acceleration after 1983. Much of this was encouraged by successive governments
which de-regulated banks and promoted home ownership to the widest groups of
the population with ultimately disastrous effect.
A period of balance sheet repair followed the crash as households worked to restore
their finances as anticipated by Reinhart and Rogoff in their famous study of debt
crises1. What is interesting though is how long the current period of household de-
leveraging has gone on with little sign that it might be ending. Today the debt to GDP
ratio is below levels seen at the start of the last expansion and still falling (chart 4).
Signs of scarring? There were many excesses during the run-up to the crisis as the banking system
forgot the concept of prudent lending, but it is hard to argue that the whole period
was an aberration. Other measures such as buoyant household wealth and interest
cover suggest the US consumer's financial position has now been restored. Perhaps
we are seeing the “scarring” effects of the financial crisis; this can affect the
willingness of households to borrow for a generation as occurred after the
Great Depression.
If households have decided to eschew debt then the ability of the US Federal Reserve
(Fed) to generate recovery through cutting interest rates is clearly limited. We have
argued previously that the Fed will struggle to overcome the headwind from the
trade war and this only adds to its difficulties by blocking one of the main monetary
transmission mechanisms.
Measures to roll back some of the regulation on banks may help in this respect, but
the most likely outcome is another bout of fiscal policy. This has become the policy
prescription of the day.
However, it faces two challenges in the US. The first is that the government's debt to
GDP ratio is already high at close to 100% (chart 4). In the past this might have been
an issue as investors worried about government spending "crowding out" private
sector activity, but the bond markets do not seem concerned at present. The second
is the political cycle. There is little extra government spending in the pipeline for the
rest of this year or next; we are probably looking at 2021 at the earliest after the
presidential election. No doubt there will be promises of fiscal largesse from both
sides in the election race, but 2020 looks like it will also lack growth unless households
rediscover the joys of debt.
1ThisTime Is Different: Eight Centuries of Financial Folly. Carmen M. Reinhart & Kenneth S. Rogoff,
Princeton 2009.
Economic and Strategy Viewpoint October 2019 6The Rocky Horror Brexit Show
“I would rather be dead in a ditch [than ask for a delay to Brexit].”
UK Prime Minister Boris Johnson, 5 September 2019
The mood in Westminster is nothing short of hostile as we approach the 31 October
Halloween Brexit deadline, with no real signs of a smooth exit. Delay seems
inevitable, followed by a general election, but concerns remain that the government
is willing to subvert the will of Parliament.
Boris loses his majority, and every vote so far
It has been a Since its return from summer recesses, the government, under the newly elected
difficult start to Prime Minister (PM) Boris Johnson, has lost every vote in the House of Commons – an
Johnson's tenure unprecedented run of defeats. Opposition parties (dubbed the Rebel Alliance) have
successfully voted in to law the Benn Act, which compels the government to seek a
as Prime Minister…
delay to the 31 October Brexit deadline if a deal cannot be reached and passed in the
House of Commons by 19 October. This was rushed through the legislative process
in a week, after it was announced that Johnson was to prorogue (or shutdown)
Parliament ahead of a Queen's speech, which sets out the government's
legislative programme.
Johnson’s “do or die” approach to negotiations with Brussels has triggered a rebellion
within his own party, contributing to 21 fellow Conservative MPs voting with the
opposition. Those rebels have since been kicked out of the party, with several others
following suit in protest (including the Prime Minister’s own brother).
In response to the prorogation, legal challenges were brought to both the English
and Scottish High Courts, alleging that the prorogation was illegal as it was designed
to stop Parliament from scrutinising the government's Brexit plans. In the end, the
UK's Supreme Court heard the case, and in the absence of an explanation from the
government as to the reason behind the shutdown, prorogation was ruled as
unlawful and void, allowing Parliamentarians to return to work.
…having lost his Without a working majority, a general election is now inevitable, even though the PM
majority, every was recently defeated when we called for a vote on an early general election.
vote in the Opposition leaders have said that they will support a call for an early general election
once a delay to Brexit is guaranteed. The opposition simply do not trust Johnson to
Commons and
extend Article 50 and have voiced concerns that the PM might use his powers to delay
even an
an election after the end of October, which could pave the way for a no-deal Brexit.
unimaginable There have been several other suggestions of how the PM might seek to circumvent
court case the Benn Act, including by former Conservative Prime Minister John Major, who has
been scathing over Johnson's behaviour and tactics.
What happens next?
The next few weeks will see an escalation in rhetoric and uncertainty, both between
the UK and Brussels, and within the UK's Parliament. The UK government appears to
be re-negotiating the Withdrawal Agreement so that Great Britain is excluded from
the Northern Ireland backstop – a failsafe that ensures a hard border between the
Republic and Northern Ireland does not return in the event that a workaround cannot
be found during the transition period.
The UK If such an arrangement can be agreed with Brussels, then it will be put to a vote by
government is 19 October. If Parliament backs the solution, then the UK will exit the EU on 31
attempting to October and enter a transition period for an unspecified period of time. During this
reshape the period, the future relationship including trade, customs arrangements and so on, will
Withdrawal be negotiated.
Agreement
Economic and Strategy Viewpoint October 2019 7However, if Parliament rejects the deal, then according to the Benn Act, Johnson must
seek an extension to the Brexit deadline to 31 January 2020. This is the point in which
there is great uncertainty, as highlighted before. Could Johnson find a way to
circumvent the law? Could he simply refuse and risk going to prison? Could he resign,
leaving the task to someone else? After all, his comment quoted at the top of this
note suggests he is willing to do whatever it takes, and his actions so far support this.
As a result, the risk of a no-deal Brexit in 2019 continues to linger and weigh on the
performance of sterling.
Chart 5 shows the implied probability of a no-deal Brexit occurring in 2019 from the
Betfair Exchange – a peer-to-peer betting platform. The probability climbed from
around 30% to just over 40% after Boris Johnson became Prime Minister, and
announced the prorogation of Parliament. However, as Parliament passed the Benn
Act, the probability collapsed to under 20%, with the latest reading at 16%. Sterling
has been buffeted by Brexit news ever since 2015.
Chart 5: Sterling rebounds as risk of no-deal Brexit recedes
Betting markets
suggest the risk of
a no-deal Brexit in
2019 has fallen
sharply, but some
risk remains
Source: Refinitiv Datastream, Betfair Exchange, Schroders Economics Group. 29 September 2019.
The chart above also shows the performance against the US dollar and the euro, as
both exchange rates are indexed and inverted on the right hand side axis. Other
factors are of course contributing, such as the threat of another Italian election over
the summer, or the escalation of the US-China trade war. But on the whole, sterling
still has substantial downside risk in the event of a no-deal, and some upside risk if a
deal can be agreed.
Returning to the Brexit outlook, our baseline assumption remains that the
Brexit deadline will be delayed into 2020, and that a deal will eventually be found to
allow the UK to leave with a transition period. Should the Prime Minister refuse to
request the extension, then we assume that a senior civil servant or Parliamentarian
will do so instead, referring to the Benn Act as the legal mandate to do so. We fully
expect the European Union to accept the request, but it may decide to force a
longer extension.
General election looms
A delay to the Once the Brexit deadline is extended, opposition parties would have no further
Brexit deadline excuses to refuse an early general election. The government has accused opposition
parties of avoiding an election due to the lead the government still has in voting
seems most likely,
intention polls.
followed by a
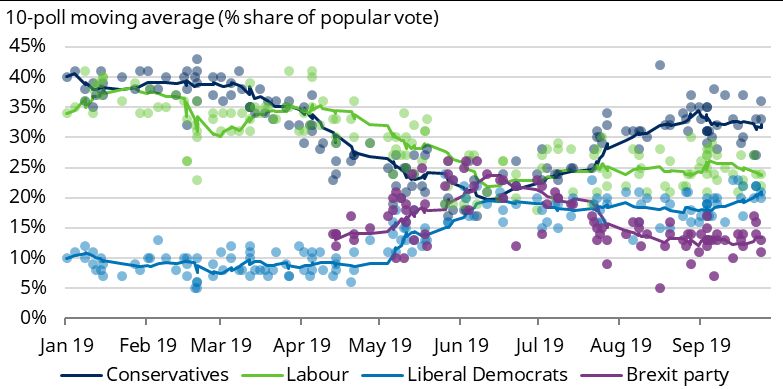
general election Tracking the average of the last ten polls, the Conservative Party appears to be
comfortably in the lead (chart 6). Following the delays to Brexit last March and May,
both the Conservatives and Labour started losing ground to the Brexit Party and the
Economic and Strategy Viewpoint October 2019 8Liberal Democrats. Though the Brexit Party was only formed a few months ago, it is
led by the former leader of the UK Independence Party, Nigel Farage, and therefore
has credibility when it promises to leave the EU without a deal at the earliest
opportunity. Meanwhile, the Liberal Democrats have clearly become the remain
party, and did well to win over support. Indeed, the results of the European
Parliamentary elections in May shocked most observers and politicians. The Brexit
Party came first, winning 30.5% of votes, while the Liberal Democrats finished second
with 19.6% of votes. Labour came in third (13.6% of votes) while the ruling
Conservatives finished in fifth (8.8% of votes) and behind the Green Party).
Chart 6: Opinion polls put the Conservatives in the lead
Opinion polls put
the Conservatives
in the lead, but it
may not be enough
for a majority
Source: Wikipedia, Schroders Economics Group. 29 September 2019.
Even after the European elections, the polls continued to narrow, until the Brexit
Party was in the lead by the middle of the summer. This partly prompted the change
in leadership of the Conservatives and certainly the change in strategy. Boris Johnson
won the leadership contest by pledging to deliver Brexit, deal or no deal.
Since Johnson became Prime Minister, the Conservatives have seen a significant
recovery in the polls, appearing to take voters away from the Brexit Party. Meanwhile,
the Labour Party has seen a little bounce, but the Liberal Democrats continue to make
gains, with one poll recently putting it ahead of the Labour Party.
Based on the latest polling data, the Conservatives would once again be the largest
party in Parliament; however, they may fall short of an absolute majority. Implied
probabilities from the Betfair Exchange2 show that there is a 60% probability of the
election resulting in no overall majority, compared to a 32% probability of the
Conservatives winning a majority.
With a minority Conservative government, or even a slim majority if once again in
coalition with the Democratic Unionist Party (DUP), we should see the government
attempt to compromise and push a deal through Parliament.
If the Conservatives were to win a majority, this could make voting through a deal
even easier, although some believe that the hard-line Brexiteers within the party
would push the UK to a no-deal Brexit. With a large enough majority, and with remain
rebels booted out of the party, there would be little to stop such a outcome.
2Betfair Exchange implied probabilities taken on 27 September 2019.
Economic and Strategy Viewpoint October 2019 9Of course, opinion polls are not always correct, and they can move aggressively
If a 'remain
during an election campaign. The 2017 general election saw a 10 point swing from
coalition' was to the Conservatives to Labour in the five weeks of campaigning. If such a swing was
be formed, then a repeated, and the Labour Party ended up being the largest group in Parliament, then
second they might be able to form a 'remain coalition' with the Liberal Democrats and the
referendum would Scottish Nationalist Party (SNP – by far the largest party in Scotland). In this scenario,
be likely, raising we expect the Labour strategy on Brexit to win out. The coalition government would
the possibility of seek to renegotiate the deal, then put the deal to a confirmatory (or second)
the UK remaining referendum. However, Labour, the Liberal Democrats and SNP have all suggested
in the EU they would then campaign to remain in the EU. This is not the clearest of strategies,
which is why Labour is losing ground to the Liberal Democrats' simple 'revoke Article
50' campaign. But, the distribution of seats suggests that as the Liberal Democrats
gain momentum, they will be mainly taking seats from the Conservatives rather than
from Labour.
If a second referendum was held, then polling suggests remaining in the EU would
win, although probably only by a small margin. This will itself garner strong
opposition to the result, even if logic suggests that more information is now available
three years on after the first referendum.
Possible scenarios and the economic impact
We have attempted to describe the most likely scenarios for the coming months
above, but there is clearly a high degree of uncertainty going forward. This
makes the next part – considering the economic impact of various outcomes – even
more uncertain.
If the UK leaves the EU without a deal, then it would do so without a transition period,
A no-deal Brexit
and all current EU trade deals would cease. Customs borders would be erected, which
would lead to a
could cause significant blockages and delays to the delivery of goods. In this scenario,
recession both in we expect sterling to fall to around 1.10 against the US dollar and 1.02 against the
the UK and EU as euro3. Inflation would rise significantly, reducing the purchasing power of
sterling falls households and encourage a reduction in real consumption. As household spending
sharply is the biggest driver of GDP growth, the economy would suffer a technical recession,
which may last up to a year. Business investment would also contract amidst the
uncertainty, though government spending would most likely increase to limit the
downturn. Interest rates would probably be lowered to near zero, and quantitative
easing may also be restarted.
It is worth mentioning that in a no-deal scenario, the EU could also slip into a technical
recession. The negative impact, combined with the current low growth environment,
could be enough to cause a short and small contraction in activity.
A Brexit deal If the UK was to leave with a deal (this year or next), then we would expect sterling to
would help lift rise to around 1.35 against the US dollar and 1.19 versus the euro. Inflation would
growth and temporarily dip, helping households by boosting real income growth. Business
sterling, along with investment would rebound after contracting in recent quarters, while government
interest rates spending would probably increase in any case due to government policy of late. The
recent build-up of inventories would have to be worked through, but within a year,
the economy should see a marked pick-up in growth compared to its current
lacklustre performance. Interest rates would probably rise as growth accelerated,
though increases would be limited. Uncertainty would remain as the future
relationship with the EU would still need to be negotiated, but the immediate risk of
disruption would be removed.
Finally, if the UK was to revoke Article 50 and remain in the EU, we would expect
sterling to rise to 1.50 against the US dollar, and 1.29 against the euro. This would be
3Currency assumptions are based on Schroders polling of other financial institutions.
Economic and Strategy Viewpoint October 2019 10the most positive scenario for economic growth. In the near term, it would resemble
the 'leave with a deal' scenario, but over the medium and long term, we would
assume ongoing free movement of labour, which secures greater growth in the
working-age population. Though investment could take years to recover, research
and co-operation will benefit productivity growth.
Political uncertainty to remain high
The biggest economic and political risk facing the UK is Brexit. Everything else pales
into insignificance, making forecasting the economic outlook especially hazardous.
We have attempted to outline the most likely potential paths for Brexit, but there is a
very good chance that events find a way to surprise us. We leave you with one final
chart which we thought best explains the motivation for many of the political actors
we are watching.
Chart 7 shows voting intentions if the election was held after an extension to the
Brexit deadline, if the election was held after a no-deal Brexit, and finally, if the
election was held after Article 50 is revoked. It quickly becomes clear why the
Conservative Party is happy to pursue a no-deal Brexit. Moreover, a question on
voting intentions if the UK left on time but with a deal was almost identical to the
results from a no-deal Brexit.
Chart 7: Opinion polls under different election scenarios
Why would the
Conservative party
back a no-deal
Brexit? Because
voters would
reward it in an
election
Source: ComRes polling conducted 18–19 September.
Lastly, the ambiguous position of the Labour Party starts to make sense. There is no
scenario where it can win a majority based on this poll. With two-thirds of its seats
voting to leave in the 2016 referendum, Labour is in a catch-22 scenario. Unless it can
move the debate away from Brexit, though there is little chance of that.
Economic and Strategy Viewpoint October 2019 11Should, would or could China aggressively
devalue?
“It was all very well to say “Drink me,” but the wise little Alice was not going
to do that in a hurry. “No, I’ll look first,” she said, “and see whether it’s
marked ‘poison’ or not.”
Lewis Carroll, 'Alice in Wonderland'
The renminbi takes Notwithstanding the recent cooling of tensions, the trade war has clearly escalated,
as we wrote last month, and the Chinese currency has been taking the strain. The
the strain as trade
People's Bank of China (PBoC) had clearly spent large parts of this year propping up
tensions escalate
the renminbi (contrary to US accusations of currency manipulation in the opposite
direction) as a sop to the US during trade negotiations. This policy was abandoned
on two occasions following tweets from President Trump announcing new or
increased tariffs, as visible in chart 8.
Chart 8: Trump's tweets saw authorities step away from supporting currency
Source: Refinitiv Datastream, Schroders Economics Group. 24 September 2019.
This is not the same, however, as pursuing a path of aggressive devaluation to offset
tariffs. Some currency weakness is a natural, and rational, market response to the
trade war. Still, that does not mean China could not take it further. The question is
whether it would make sense to do so.
Might the PBoC choose to devalue?
Devaluation could Superficially, a devaluation seems the obvious counter to tariffs from the US. With
counter tariffs, but President Trump now proposing an average tariff rate of close to 25% on all Chinese
would entail goods by the end of this year, China could opt to devalue the renminbi to match. For
significant costs US importers, Chinese goods would be no more expensive than before.
Yet this would impose certain costs on China. We know from crises in other emerging
markets that a large devaluation can impose significant strain on the financial
system. This comes through two main channels; the increased value, in local currency
terms, of any foreign currency debt, and the risk that such a move prompts capital
flight from the domestic banking system.
In China's case, external exposures are limited. Based on data from the Bank for
International Settlements, hard currency liabilities are just a little over 8% of GDP
(chart 9). In the simplistic case where this is all US dollar exposure, a 25% devaluation
would therefore 'cost' China 2% of GDP in increased debt repayments, spread out
over a number of years depending on the maturity profile of the debt stock, along
Economic and Strategy Viewpoint October 2019 12with higher interest payments. This should be manageable, with the overall impact
somewhat mitigated by any foreign currency earnings of impacted borrowers.
Chart 9: Foreign currency debt
Source: Refinitiv Datastream, Schroders Economics Group. 26 September 2019.
The key, recurring Capital flight is a more serious concern. The last time China engineered a surprise
risk is capital flight devaluation, of just 3% in 2015, it triggered a period of sustained capital outflows that
seriously depleted China's substantial foreign currency reserves. Large scale capital
flight would prove ruinous for the financial system. However, there are reasons to
think that the reaction would be more muted this time; in 2015 a lot of corporates
were reportedly engaged in the carry trade, exploiting the apparent stability of the
currency to make 'free' money. The devaluation left them exposed and took them
entirely by surprise. Today, by contrast, corporates take greater advantage of
hedging against currency moves, and the incentive to play the carry trade is reduced
by the compression of local rates.
In addition, capital controls have also been tightened considerably since 2015. This is
visible in the balance of payments data with the capital account deficit and errors and
omissions (E&O) both shrinking (chart 10) and in the reduced volatility of China's
foreign currency reserves.
Chart 10: Capital control effectiveness visible in balance of payments data
Source: Refinitiv Datastream, Schroders Economics Group. 26 September 2019.
Economic and Strategy Viewpoint October 2019 13Against this though we must consider that a 25% devaluation is much more severe
than a 3% move, and that however stringent capital controls are, channels can
normally be found to bypass them if the incentive is strong enough. The authorities
would likely be concerned that by signalling their willingness to engage in large,
surprise devaluations, they would provide such an incentive.
Ultimately, Another concern for policymakers would be the inflationary consequences of any
devaluation devaluation. The BIS, for instance, estimates that the rate at which currency moves
seems an unlikely pass-through to inflation is around 0.2 to 0.3 times for EM economies. A 25% drop in
policy choice the renminbi would therefore imply additional inflation of around 5 to 7.5%, which
even if short lived would inflict considerable pain on households.
Finally, none of this would occur in a vacuum. The move would likely draw a response
from not just the US, which could simply hike tariffs again by another 25%, but also
from current trade war bystanders. The EU and Japan would likely object to the
competitive advantage bestowed by such a large devaluation and could respond
with tariffs of their own. Global markets, China's included, would also see a
significant negative reaction. It is hard to conclude that devaluation is a particularly
attractive tool.
Could the PBoC be forced to devalue?
PBoC resources Even if the PBoC will not jump, the possibility remains that it could be pushed. Events
are significant but may conspire to force a devaluation of the currency against the central bank's wishes.
Given the three trillion dollars in reserves the bank holds, this might seem unlikely.
not limitless
Yet, as we mentioned above, we saw sizeable drawdown of those reserves in 2015 as
corporates and households scrambled to respond to unexpected currency weakness.
From $3.6 trillion in July 2015, reserves fell to $3.2 trillion by January 2016. A reduction
of $400 billion in just six months shows how quickly even a large war chest can
be depleted.
The question then is whether the PBoC has sufficient resources to defend the
currency, and broader economy, in a crisis. There are a number of metrics one can
use to assess reserve adequacy, all driven by historic experience. Some observers
favour a ratio of reserves to imports, to assess how long the economy can finance its
trade bill. Others focus on the ratio of reserves to the money supply, to gauge how
long a currency peg could withstand capital flight. Alternatively we could focus on the
external liabilities of the economy relative to reserves, to judge whether the economy
could survive a prolonged period cut off from international capital markets.
Luckily, faced with so many individual measures, the IMF has created its own
composite measure, which attaches some weight to each proposed metric. The
weights vary depending on whether the country is running a fixed or floating
exchange rate, and whether capital controls are in place 4. An assessment of China's
reserve adequacy against this metric, subject to different assumptions, is shown in
chart 11.
4Afixed exchange rate requires greater firepower to defend, as it provides speculators with a clear target
and gives the central bank little flexibility about when to intervene. Capital controls reduce the reserves
needed by reducing the likelihood and magnitude of outflows.
Economic and Strategy Viewpoint October 2019 14Chart 11: The PBoC is running out of wiggle room
Source: Refinitiv Datastream, Schroders Economics Group. 26 September 2019.
Capital controls What becomes clear, looking at this chart, is that China is already in a position where
are not a choice a hard peg of its currency is impossible without capital controls. Reserves today are
but a necessity less than the level the IMF would deem adequate in this scenario. Even with capital
for China controls in place, a fixed exchange rate puts China in a tricky position; reserve
adequacy then is only a little over 150%. China enjoys the greatest buffer if it
combines capital controls with a floating exchange rate, which is something like the
position today. The currency is perhaps not entirely freely floating, but there is clearly
a higher degree of volatility then we would expect in the case of a fixed exchange
rate (chart 8).
Provided it maintains this institutional arrangement, the PBoC should not be forced,
in the immediate future, to devalue. Even a repeat of 2015's outflows would leave its
reserve adequacy around 200%. A collapse of the currency seems extremely unlikely
within the next 12 months.
Looking further out, this assessment can help to inform our view on the direction of
monetary and regulatory policy in China. It is clear that capital controls will have to
remain in place for some time, for example. Further, if we look at what drives China's
need for reserves (chart 12), the key vulnerability arises from the broad money
component. This underscores the need for China to get a handle on its debt problem;
continued credit growth will serve to exacerbate this vulnerability. Expect the PBoC
to prove resistant to demands for stimulus and, much like the ECB, do its best to shift
the burden on to fiscal policy.
Chart 12: Currency fears will constrain credit easing
Source: Refinitiv Datastream, Schroders Economics Group. 26 September 2019.
Economic and Strategy Viewpoint October 2019 15Not with a bang, but a whimper
It is neither in China's interests to allow, nor beyond its means to prevent, a sudden
A large dislocation of its exchange rate. The benefits the economy could reap from a large
devaluation is a devaluation are modest at best and more than offset by the costs in terms of inflation,
low probability geopolitics and the risk of capital flight. As to whether events might overwhelm the
event, but the PBoC, while its resources are finite, we struggle to envisage a scenario whereby it
risk constrains would have to surrender to market pressure. It will however be constrained in its
PBoC policy policy choices by the need to protect the currency, with implications for the openness
of the capital account and the outlook for domestic policy stimulus.
The PBoC must hope that it is instead able to gradually guide the currency lower, until
it reaches a level at which even were the protective levees of the central bank to be
removed it would not be washed away by the tides of the market. At the same time,
it will need to be careful not to allow the expectation of one way depreciation to
become entrenched, or else risk short selling and capital flight. This implies a
prolonged period of gradual depreciation for the renminbi, with the occasional bout
of strength and tightening of liquidity to ensure short selling remains unattractive.
Not terribly exciting, but there is perhaps enough drama in markets already.
Economic and Strategy Viewpoint October 2019 16Schroders Economics Group: Views at a glance
Macro summary – October 2019
Key points
Baseline
– After expanding by 3.3% in 2018, global growth is expected to moderate to 2.6% in 2019 and 2.4% in 2020
– the slowest rate of growth since the Global Financial Crisis. Inflation is forecast to decline to 2.5% this year
after 2.7% in 2018 and then rise to 2.6% in 2020. Following the latest escalation in the US-China trade war,
we no longer expect a resolution but a further escalation where the US increases the soon to be applied
10% tariff to 25% by the end of the year. The impact of actions so far will still be felt in 2019 and 2020.
– US growth is forecast to slow to 2.1% in 2019 and 1.3% in 2020. Following recent action from the
Fed, we expect one more rate cut this year in December. As the economy slows from fading fiscal stimulus
and the impact of the trade war, the Fed is forecast to cut rates twice more in the first half of 2020.
– Eurozone growth is forecast to moderate from 2% in 2018 to 1.1% in 2019 as the full effects from the US-
China trade war and Brexit hit European exporters. Inflation is expected to disappoint, remaining well below
target as lower oil prices contribute to lower energy inflation, while core inflation fails to rise due to weaker
GDP growth. The ECB is forecast to cut the deposit rate to -0.6% by the end of 2019, and continue QE for the
foreseeable future.
– UK growth is likely to fall to 1.1% this year from 1.4% in 2018. Following a small delay, we assume that a
Brexit deal with the EU passes Parliament in Q1 2020 ahead of a transition period that preserves the status
quo of single market and customs union membership. Growth is then expected to slow to 1% in 2020.
Inflation is expected to fall to 1.8% in 2019 due to lower energy prices, but weaker growth and a recovery
in sterling after Brexit will keep inflation subdued at 1.9% in 2020. Meanwhile the BoE is forecast to hike
rates to 1% in Q3 2020.
– Growth in Japan should rise to 1.2% in 2019 from 1.1% in 2018, however the path of activity should be volatile
owing to the consumption tax hike in October this year. A slow recovery should follow resulting in -0.1%
growth in 2020. Although inflation remains well under 2% in our forecast horizon, we expect the BoJ to cut
rates by 30bps in December following an appreciation in the yen and escalation in trade war.
– Emerging market economies should slow to 4.2% in 2019 after 4.8% in 2018, led by China, but pick-up
slightly to 4.5% in 2020 as other BRIC economies see a recovery. China suffers from continued trade tensions
with the US and allows the currency to fall further alongside an easing from the PBoC, while dovish
developed market central banks provide cover for more easing from their other emerging market
counterparts.
Risks
– Risks are tilted toward deflation with the highest individual risk going on the global recession scenario
where the economy proves more fragile than expected. We also see a risk of an escalation in the US-China
dispute with the US extending the trade war to Europe.
Chart: World GDP forecast
Contributions to World GDP growth (y/y), %
6 4.8 5.3 5.3 4.9
5.0 Forecast
5 4.0 3.7
4 3.2 3.3
2.8 3.0 3.2 3.2 2.7 3.3 2.4
3 2.5 2.6
2
1
0
-1 -0.6
-2
-3
02 03 04 05 06 07 08 09 10 11 12 13 14 15 16 17 18 19 20
US Europe Japan Rest of advanced BRICS Rest of emerging World
Source: Schroders Economics Group, August 2019. Please note the forecast warning at the back of the document.
Economic and Strategy Viewpoint October 2019 17Schroders Baseline Forecast
Real GDP
y/y% Wt (%) 2018 2019 Prev. Consensus 2020 Prev. Consensus
World 100 3.3 2.6 (2.8) 2.6 2.4 (2.6) 2.5
Advanced* 61.4 2.3 1.6 (1.8) 1.7 1.1 (1.4) 1.4
US 26.5 2.9 2.1 (2.6) 2.3 1.3 (1.5) 1.8
Eurozone 17.2 2.0 1.1 (1.2) 1.1 0.9 (1.4) 1.1
Germany 5.0 1.9 0.5 (0.9) 0.5 0.8 (1.2) 1.0
UK 3.6 1.4 1.1 (1.4) 1.2 1.0 (1.4) 1.1
Japan 6.7 1.1 1.2 (0.9) 1.0 -0.1 (0.2) 0.2
Total Emerging** 38.6 4.8 4.2 (4.4) 4.1 4.5 (4.6) 4.3
BRICs 25.3 5.7 5.2 (5.5) 5.1 5.4 (5.5) 5.2
China 16.7 6.6 6.2 (6.3) 6.2 6.0 (6.0) 5.9
Inflation CPI
y/y% Wt (%) 2018 2019 Prev. Consensus 2020 Prev. Consensus
World 100 2.7 2.5 (2.6) 2.6 2.6 (2.7) 2.6
Advanced* 61.4 2.0 1.5 (1.8) 1.5 1.7 (2.0) 1.7
US 26.5 2.4 1.9 (2.3) 1.8 2.2 (2.4) 2.1
Eurozone 17.2 1.7 1.3 (1.7) 1.3 1.3 (1.6) 1.3
Germany 5.0 1.8 1.4 (1.8) 1.4 1.5 (1.7) 1.5
UK 3.6 2.5 1.8 (2.0) 2.0 1.9 (2.3) 2.1
Japan 6.7 1.2 0.7 (0.3) 0.6 1.0 (1.2) 0.8
Total Emerging** 38.6 3.8 4.1 (3.9) 4.3 3.9 (3.8) 4.0
BRICs 25.3 2.8 3.1 (2.8) 2.9 3.3 (3.1) 2.9
China 16.7 2.2 2.7 (2.4) 2.4 2.8 (2.7) 2.3
Interest rates
% (Month of Dec) Current 2018 2019 Prev. Market 2020 Prev. Market
US 2.00 2.50 1.75 (2.50) 1.96 1.25 (2.00) 1.46
UK 0.75 0.75 0.75 (1.00) 0.74 1.00 (1.50) 0.56
Eurozone (Refi) 0.00 0.00 0.00 (0.00) 0.00 (0.50)
-0.45 -0.56
Eurozone (Depo) -0.50 -0.40 -0.60 (-0.40) -0.60 (0.00)
Japan -0.10 -0.10 -0.30 (-0.10) -0.05 -0.30 (-0.10) -0.08
China 4.35 4.35 4.00 (4.00) - 3.50 (3.50) -
Other monetary policy
(Over year or by Dec) Current 2018 2019 Prev. Y/Y(%) 2020 Prev. Y/Y(%)
US QE ($Tn) 4.0 4.1 3.8 (3.7) -7.3% 3.8 (3.7) 0.0%
EZ QE (€Tn) 2.4 2.4 2.4 (2.4) 0.0% 2.6 (2.4) 8.3%
UK QE (£Bn) 422 435 445 (445) 2.3% 445 (445) 0.0%
JP QE (¥Tn) 557 552 583 (573) 5.6% 623 (593) 6.9%
China RRR (%) 13.50 14.50 12.00 12.00 - 9.00 10.00 -
Key variables
FX (Month of Dec) Current 2018 2019 Prev. Y/Y(%) 2020 Prev. Y/Y(%)
GBP/USD 1.23 1.27 1.24 (1.34) -2.6 1.32 (1.38) 6.5
EUR/USD 1.09 1.14 1.08 (1.14) -5.5 1.14 (1.18) 5.6
USD/JPY 108.2 109.7 103 (110) -6.1 105 (108) 1.9
EUR/GBP 0.89 0.90 0.87 (0.85) -3.0 0.86 (0.86) -0.8
USD/RMB 7.12 6.87 7.20 (6.85) 4.9 7.30 (7.00) 1.4
Commodities (over year)
Brent Crude 62.4 71.6 64.2 (70.2) -10.3 59.5 (69.1) -7.3
Source: Schroders, Thomson Datastream, Consensus Economics, August 2019
Consensus inflation numbers for Emerging Markets is for end of period, and is not directly comparable.
Market data as at 27/09/2019
Previous forecast refers to May 2019
* Advanced markets: Australia, Canada, Denmark, Euro area, Israel, Japan, New Zealand, Singapore, Sweden, Switzerland,
United Kingdom, United States.
** Emerging markets: Argentina, Brazil, Chile, Colombia, Mexico, Peru, China, India, Indonesia, Malaysia, Philippines, South Korea,
Taiwan SAR, Thailand, South Africa, Russia, Czech Rep., Hungary, Poland, Romania, Turkey, Ukraine, Bulgaria, Croatia, Latvia, Lithuania.
Economic and Strategy Viewpoint October 2019 18Updated forecast charts – Consensus Economics
For the EM, EM Asia and Pacific ex Japan, growth and inflation forecasts are GDP weighted and calculated using
Consensus Economics forecasts of individual countries.
Chart A: GDP consensus forecasts
2019 2020
% %
7 7
6 6
EM Asia EM Asia
5 5
EM EM
4 4
3 3
US Pac ex Jap
2 Pac ex Jap 2 US
UK
UK
1 Eurozone 1 Eurozone
Japan Japan
0 0
J F MAM J J A S OND J F MAM J J A S OND J F M A M J J A S O N D
2018 2019 2020
Chart B: Inflation consensus forecasts
2019 2020
% %
5 5
4 EM 4
EM
3 3
EM Asia EM Asia
UK UK
2 US
2 US
Pac ex Jap Pac ex Jap
Eurozone Eurozone
1 1 Japan
Japan
0 0
J F MAM J J A S OND J F MAM J J A S OND J F M A M J J A S O N D
2018 2019 2020
Source: Consensus Economics (29 October 2018), Schroders.
Pacific ex. Japan: Australia, Hong Kong, New Zealand, Singapore.
Emerging Asia: China, India, Indonesia, Malaysia, Philippines, South Korea, Taiwan, Thailand.
Emerging markets: China, India, Indonesia, Malaysia, Philippines, South Korea, Taiwan, Thailand, Argentina, Brazil, Colombia, Chile,
Mexico, Peru, South Africa, Czech Republic, Hungary, Poland, Romania, Russia, Turkey, Ukraine, Bulgaria, Croatia, Estonia,
Latvia, Lithuania.
The forecasts included should not be relied upon, are not guaranteed and are provided only as at the date of issue. Our forecasts are based on our own assumptions
which may change. We accept no responsibility for any errors of fact or opinion and assume no obligation to provide you with any changes to our assumptions or
forecasts. Forecasts and assumptions may be affected by external economic or other factors. The views and opinions contained herein are those of Schroders
Investments Management’s Economics team, and may not necessarily represent views expressed or reflected in other Schroders communications, strategies or
funds. This document does not constitute an offer to sell or any solicitation of any offer to buy securities or any other instrument described in this document. The
information and opinions contained in this document have been obtained from sources we consider to be reliable. No responsibility can be accepted for errors of
fact or opinion. This does not exclude or restrict any duty or liability that Schroders has to its customers under the Financial Services and Markets Act 2000 (as
amended from time to time) or any other regulatory system. Reliance should not be placed on the views and information in the document when taking individual
investment and/or strategic decisions. For your security, communications may be taped or monitored.
Economic and Strategy Viewpoint October 2019 19Schroder Investment Management North America Inc.
7 Bryant Park, New York, NY 10018-3706
schroders.com/us
schroders.com/ca
Important information: The views and opinions contained herein are those of Keith Wade, Chief Economist and Strategist, Azad
Zangana, Senior European Economist and Strategist and Craig Botham, Emerging Market Economist and do not necessarily represent
Schroder Investment Management North America Inc.’s house views. These views are subject to change. This newsletter is intended to
be for information purposes only and it is not intended as promotional material in any respect. The material is not intended as an offer or
solicitation for the purchase or sale of any financial instrument mentioned in this commentary. The material is not intended to provide, and
should not be relied on for accounting, legal or tax advice, or investment recommendations. Information herein has been obtained from
sources we believe to be reliable but Schroder Investment Management North America Inc. (SIMNA Inc.) does not warrant its completeness
or accuracy. No responsibility can be accepted for errors of facts obtained from third parties. Reliance should not be placed on the views and
information in the document when taking individual investment and / or strategic decisions. The information and opinions contained in this
document have been obtained from sources we consider to be reliable. No responsibility can be accepted for errors of fact obtained from
third parties. The opinions stated in this document include some forecasted views. We believe that we are basing our expectations and beliefs
on reasonable assumptions within the bounds of what we currently know. However, there is no guarantee that any forecasts or opinions will
be realized. SIMNA Inc. is registered as an investment adviser with the US Securities and Exchange Commission and as a Portfolio Manager
with the securities regulatory authorities in Alberta, British Columbia, Manitoba, Nova Scotia, Ontario, Quebec and Saskatchewan. It provides
asset management products and services to clients in the United States and Canada. Schroder Fund Advisors LLC (“SFA”) markets certain
investment vehicles for which SIMNA Inc. is an investment adviser. SFA is a wholly-owned subsidiary of SIMNA Inc. and is registered as a
limited purpose broker-dealer with the Financial Industry Regulatory Authority and as an Exempt Market Dealer with the securities regulatory
authorities in Alberta, British Columbia, Manitoba, New Brunswick, Nova Scotia, Ontario, Quebec, Saskatchewan, Newfoundland and
Labrador. This document does not purport to provide investment advice and the information contained in this material is for informational
purposes and not to engage in a trading activities. It does not purport to describe the business or affairs of any issuer and is not being
provided for delivery to or review by any prospective purchaser so as to assist the prospective purchaser to make an investment decision in
respect of securities being sold in a distribution. SIMNA Inc. and SFA are indirect, wholly-owned subsidiaries of Schroders plc, a UK public
company with shares listed on the London Stock Exchange. Further information about Schroders can be found at www.schroders.com/us or
www.schroders.com/ca.
Schroder Investment Management North America Inc.
For more information, visit www.schroders.com/us or www.schroders.com/caYou can also read