ECONOMIC CURRENTS - Grant Thornton
←
→
Page content transcription
If your browser does not render page correctly, please read the page content below
ECONOMIC CURRENTS
April 08, 2021

Risks of Another Housing Bubble:
The Post-Pandemic Housing Outlook
Diane C. Swonk, Chief Economist
Yelena Maleyev, Economist

A surge in demand, unleashed by plummeting mortgage
rates and the abrupt shift to working from home             Optimism Tempered by Humility
combined with years of underbuilding have triggered
the strongest home buying and building spree since the      Overall economic growth is expected to average
bubble of the 2000s. Home prices in suburban and resort     6.6% in 2021, the fastest pace since 1984.
areas soared even as apartment rents and condo prices       That follows a 3.5% drop in 2020, the largest
plummeted in what had been some of the hottest urban        contraction since 1946. Rapidly ramping up
centers. Properties moved online as fears of contagion      vaccinations and the one-two punch of easy fiscal
escalated. Bidding wars broke out for properties that       and monetary policy are to thank for the optimism.
were never seen, resulting in some buyers’ remorse.         Overall economic activity will easily cross the peak
                                                            touched in the fourth quarter of 2019 in the second
Most of the trends we see emerging were already in place    quarter of 2021; that is terrific, but we will still have
and accelerated by the pandemic. Older millennials, who     lost at least a year and half to the crisis.
had delayed first-home purchases, finally bought more
expensive properties. Many baby boomers and the silent      The words “at least” are important. Employment
generation decided to age in place instead of downsizing    lags overall economic activity. It will take until 2022
to condos, exacerbating the shortage of homes for sale.     to hit the peak in employment we saw in February
                                                            2020; that does not include what might have been.
Other trends are new. Institutional investors, who once     We were generating more than two million jobs a
helped clear the overhang of less expensive, speculative    year prior to the crisis, which means we are still
properties in the wake of the housing bubble, returned.     down nearly 11 million jobs since the pandemic took
They scooped up the cheapest properties to rent instead     hold.
of sell, reducing the supply of homes available to less
affluent, first-time buyers. Bottlenecks triggered by       The U.S. is an outlier among its peers and still not
the pandemic, fires and the widespread destruction of       out of the woods. Pandemics are by definition
timberlands in the Northwest increased the cost of new      global; we haven’t even reached herd immunity
construction. Immigration, which had been falling since     here. The challenge is harder given the ongoing
the housing bust, came to a standstill.                     reticence on vaccines by adults, the lag in safe
                                                            vaccines for children and the emergence of more
This special edition of Economic Currents focuses on the    dangerous variants. Humility has proven to be
2021 housing outlook. Special attention will be paid to     more useful than hubris when forecasting the end
the risk that conditions could be stoking another housing   of the pandemic.
price bubble. The return of speculative investors ups the
risk that home values could overshoot.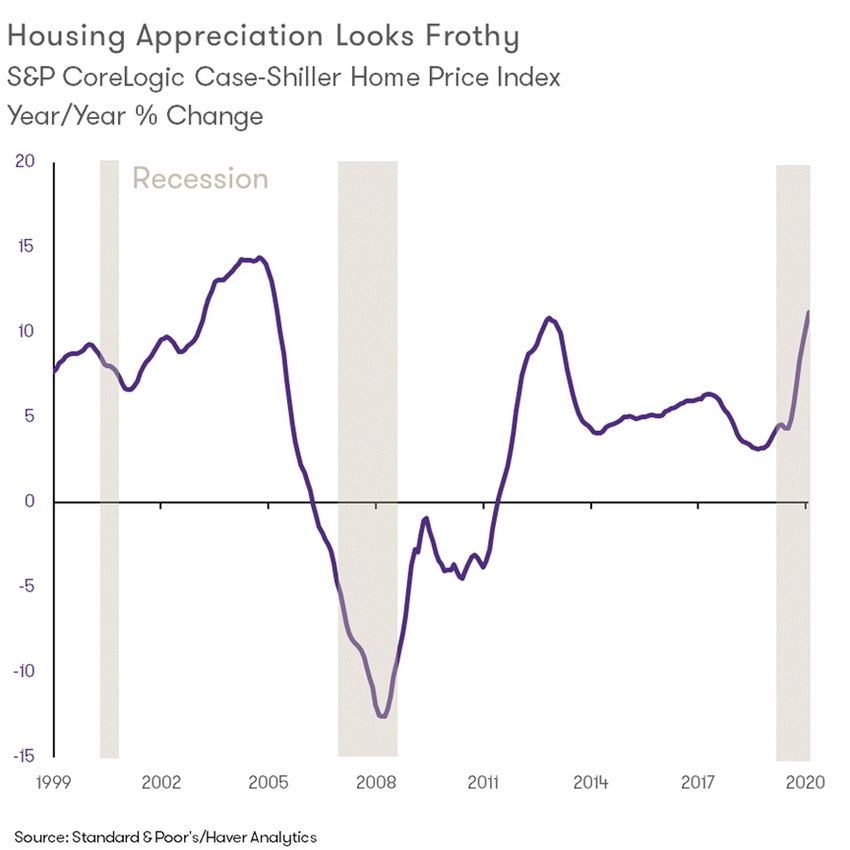
The good news is that homeowners have more equity             • Lenders have begun to ease credit standards to offset
in their homes than they did during the last housing            the blow to refinancing activity with more purchase
bubble; this should help cushion them against any               applications in the face of higher mortgage rates.
future correction in prices. The bad news is that higher
                                                              • Incomes are expected to remain steady as demand
prices are crowding out many first-time buyers. This is
                                                                for all workers picks up and emergency aid/stimulus
undermining their ability to build wealth and contributing
                                                                checks are replaced by actual paychecks.
to overall inequality.
                                                              • Consumer sentiment is expected to improve as vaccines
The surge in home prices has added to questions about           become ubiquitous, workers can more safely return to
the Federal Reserve’s resolve to allow a full recovery in       work and prospects for the future brighten.
employment with a modest overshoot in inflation before        • Inventories are expected to loosen a bit from the record
raising rates. Shelter is the largest single component          lows we saw at the start of the year, as more existing
in determining inflation and plays an outsize role in           properties are listed and construction in the pipeline is
determining living standards. We are confident that the         completed.
Fed will wait because the correlation between shelter
costs and overall inflation has broken down since the         • Institutional investors are expected to remain in the
peak of the last housing bubble. Inflation does warrant         market, which will make homes even less affordable for
watching, however, given the infrastructure spending the        middle-income households in the near term.
administration is talking about implementing.
                                                              Home Sales
Underlying Fundamentals                                       Home sales are expected to reach 6.87 million in 2021 with
The table provides a summary of our outlook for housing.      the momentum from 2020 carrying over. Both existing and
Home buying and building are expected to top 2020             new home sales will increase as more supply comes on
levels this year but remain well below the peak hit during    line from sellers and builders. Inventories will continue to
the height of the housing bubble in 2005. Other trends:       be tight but up from the historic lows at the start of this
                                                              year.

                                                              New Homes

Table 1
                                                              New home sales are expected to top 870,000 in 2021, 6%
                                                              above the pace of 2020 and the highest level since 2006.
                                                              Supply of new homes remains thin following a decade of
                                                              underbuilding in the wake of the housing market bubble in
                                                              the early 2000s.

                                                              New homes tend to be priced at the higher end of the
                                                              market, with the National Association of Home Builders
                                                              (NAHB) estimating that about 60% of middle-income
                                                              households are unable to afford the median price for a
                                                              new home: $349,400. Widespread industry consolidation
                                                              combined with a shortage of materials (mostly lumber)
                                                              and a dearth of immigrant labor have pushed prices up.

                                                              NAHB estimates that first-time buyers now acccount for
                                                              43% of new home sales. That is a huge jump from their
                                                              last estimate of 32% in 2018.

2 Monthly Economic Outlook: Risks of Another Housing Bubble
Affluent older millennials are dominating the first-time Housing Construction
home buyer market. Years of stock market gains and
falling mortgage rates have separated older millennials, Housing starts are expected to hit 1.56 million in 2021,
who were able to repair their balances in the wake of the 12% above the 1.4 million pace of 2020. These gains will
2008-09 financial crisis, from younger millennials and not be enough to make up for the shortfall in inventories.
generation Z. The latter are still lagging in their earnings Starts have been trailing household formation for the
and wealth generation relative to previous generations. better part of a decade, which has left the market grossly
undersupplied.
In February, the backlog of homes sold pre-construction
surged 67% from a year earlier, while the inventory of Home builders faced a perfect storm. Consolidation in the
move-in ready homes plummeted. Rising mortgage rates materials market constrained capacity, notably in lumber
prompted buyers to lock in low rates and wait for their mills. Bottlenecks triggered by the pandemic contributed
homes to be completed. to delays. Producers idled by lockdowns and surprised by
the surge in demand for goods are still playing catch-up.
Speculative investors are snapping up the least
expensive properties to rent instead of sell. Houston, Labor shortages are chronic. Border closures during the
which is one of the most popular markets, has a pandemic left builders without the cheap labor they relied
whole industry devoted to flipping homes to rent. upon to build homes. Many of the workers displaced by
Those investors boost margins for builders but limit the pandemic lack the skills to pivot from restaurants to
opportunities for middle-income buyers. building sites. One estimate suggests that builders need
to hire nearly a half million workers, nearly double the
Existing Homes pace of prepandemic hiring.
Single-Family
Existing home sales are forecast to reach six million in
2021, 6% higher than 2020 and the highest level since
Single-family starts are forecast to rise to 1.17 million in
2006. The supply of homes for sale dropped to a record
2021, a 17% increase from 2020. Suburban markets and
low at the start of 2021. There were a little more than
second-tier cities are expected to see the strongest gains
one million homes listed; that’s nearly 30% below the
as the push from first-time buyers supplants the demand
level before the pandemic. It was only the second time in
for vacation homes. Downtown offices will reopen but the
more than 100 years that the number of licensed realtors
return to major cities is expected to slow in response to a
outnumbered property listings.
hybrid of work-from-home.
Supply in the market will expand when more people are
The strongest metro markets are expected to remain
vaccinated; that will help older sellers feel comfortable
Austin, Seattle and Raleigh, as the technology and
with potential buyers entering their homes.
professional services sectors make up a large portion
of the growth in employment in these cities. We also
Lockdowns and the widespread adoption of work-
should see a nice snapback in tourist destinations such as
from-home sent buyers flocking to suburban and rural
Orlando, Las Vegas and New Orleans. San Francisco and
areas. The supply of homes for sale in rural areas has
San Jose are showing signs of coming back. Boston is
plummeted 44%. Many of those homes were bought by
expected to rebound, while larger and less tech-intensive
investors to rent as vacation homes to wealthy urbanites.
cities such as New York and Chicago are expected to lag.
The average age of homes on the market has increased.
Multifamily
The youngest millennials are buying the oldest homes
and shouldering the burden of repairs and upgrades.
Multifamily construction is forecast to come in at 391,000
in 2021, close to the level of the last two years. A drop
in construction in the most densely populated urban
areas is being mostly offset by a pickup in suburban
construction.
3 Monthly Economic Outlook: Risks of Another Housing BubbleA recent study found that most of the loss in demand Chart 1
in densely populated areas was due to a shortfall in in-
migration as opposed to a surge in out-migration. Foreign
students who were locked out due to border closures
couldn’t rent or buy near their universities in urban
centers. Young graduates moved in with their parents to
save on rent and work from home.
Vaccinations and partial office reopenings are bringing
young adults back. Rents in the hardest hit markets have
bottomed. New York, which suffered the biggest blow to
in-migration during the pandemic, posted the strongest
month for condo sales in 14 years last month. Many
properties are selling at a discount but coming back
nonetheless.
Cities with greater exposure to finance, information and
professional services industries will fare better overall
than cities with more manufacturing activity. The hottest Home Prices
construction markets are expected to be in the South.
Home values are forecast to rise between 5.6% and
Dallas, Austin, Houston and Raleigh continue to attract
8.3% in 2021, depending on the measure. That’s a
tech firms and young professionals, while Charlotte,
slowdown from the double-digit pace of 2020; the least
Atlanta, Orlando, Nashville and Miami are attracting
expensive homes experienced the fastest appreciation,
finance and consulting firms.
as inventories dried up. Housing appreciation has yet to
match the frenzied pace of the housing bubble, but risks
In the West, Phoenix, Salt Lake City and Denver are
are to the upside. (See Chart 1.)
leading the way. Many fled Silicon Valley early in the
pandemic to take advantage of working from home in
New home values have not risen as fast as existing,
lower-cost areas. This trend will slow in 2021 but these
despite the upward pressure on costs. That could change
cities will continue to see interest from younger workers
as investors take a larger share of new construction to
looking for more space and a lower cost of living.
rent instead of sell; they accounted for about 20% of new
Sacramento experienced a surge in Bay Area migrants
homes sold at the start of the year.
and will continue to be a strong contender for in-
migration in 2021.
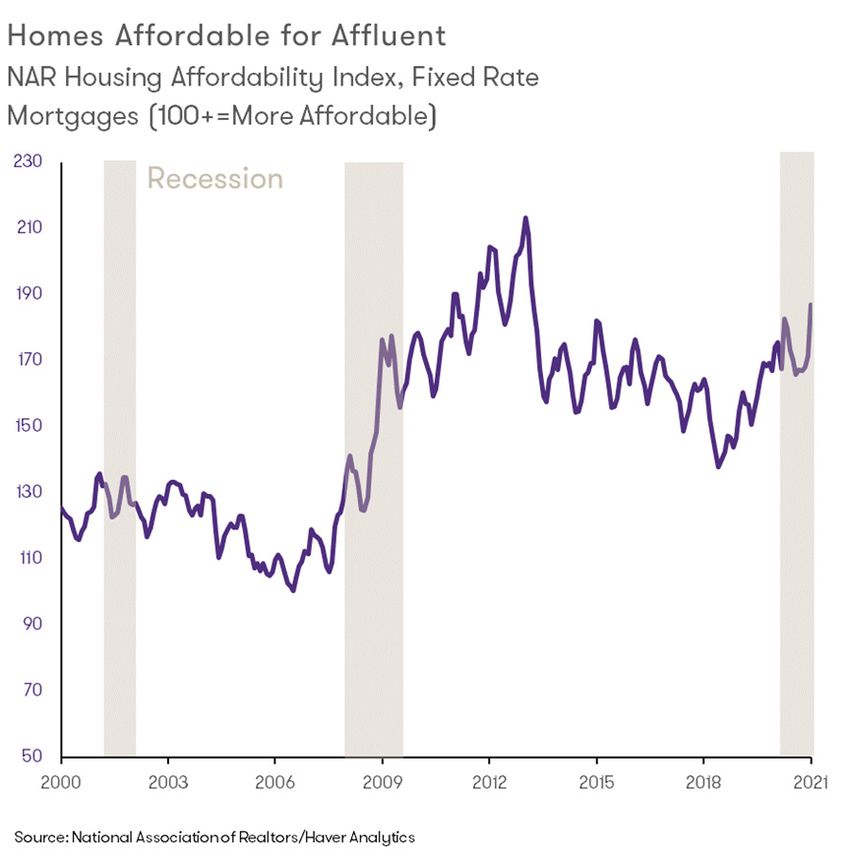
Housing affordability actually improved at the start of
the year, but those figures are misleading. (See Chart
In the Midwest, Minneapolis now has more apartment
2.) The market is driven by more affluent buyers who
construction coming on line than Chicago. Cities like
have the income needed to qualify easily for mortgages.
Columbus and Madison are expected to do better with
Middle-income households, who once dominated the first-
strong anchors provided by universities and hospitals.
time buyer market, are being pushed out. This is even as
We expect Detroit, Cleveland and Pittsburgh to remain
lenders are easing credit standards a bit. In response,
laggards.
rents on more affordable apartments and homes are
accelerating, making it even harder for those at the
The latest infrastructure spending proposed by the White
bottom of the income strata to make ends meet.
House will reduce land use regulations for multifamily
properties. If passed, those changes could boost
Last, but by no means least, owners have much more
construction of more affordable properties in some of the
equity in their homes than they did during the height
most expensive markets. (Think California.) The problem is
of the subprime lending boom. FICO scores were much
timing. That supply cannot come on line soon enough to
higher in 2020. That protects banks against losses, should
stem the rise in rents at the lower end of the market.
prices turn south.
4 Monthly Economic Outlook: Risks of Another Housing BubbleChart 2 Why do we care about wage gains? Because
accelerating inflation doesn’t stick unless those gains
are backed up by wages. The loss of worker bargaining
power has made that difficult. Even wage gains tied
to productivity growth have proven elusive in recent
years. Much of the acceleration in wages tied to new
technologies has been limited to the firms that produced
them; they never made it into overall wage gains.
We now expect the first hike in rates to occur in late 2023
instead of early 2024, a little sooner than the Fed. Our
forecast does not include any additional stimulus tied
to the administration’s new infrastructure proposal; if
passed that could move the timing of the first rate hike up
to Spring of 2023.
Bottom Line
“Resolute Patience” at the Fed The housing market has come to embody the best and
Federal Reserve Chair Jay Powell and his colleagues worst of the COVID recovery. Those who were able
have laid out how they will be patient: to work from home experienced a stronger recovery
in employment. They saw their stock portfolios soar
• They will hold the line on rates and look through a
and, when mortgage rates dropped, they seized the
temporary flare in inflation triggered by bottlenecks.
opportunity. They upgraded what they had, bought first
• They will wait for employment to fully recover what was homes, vacation retreats and everything they could to fill
lost to the pandemic and then some. them.
• They would welcome a modest, persistent overshoot in
First-time buyers returned, inventories plummeted and
inflation to achieve a broader recovery in employment.
home prices accelerated. The market remains affordable
for the well-to-do, while low- and middle-income
Most participants at the March Federal Open Market
households struggle.
Committee (FOMC) meeting expect to hold off on rate
hikes until at least 2024. That has provided little solace
Affluent first-time buyers and speculators will be driving
for the bond market, which expects rate hikes to begin in
market gains in 2021. Those gains will provide younger,
2022. This wouldn’t be the first time the bond market has
less affluent buyers with homes to rent, but not own.
forecast rate hikes that never materialized.
Housing prices will continue to rise, but the wealth tied
The relationship between rising home values and
to the ownership of those homes will not be shared as
inflation has broken down over the last three decades.
much as it once was. What we are seeing is not a typical
Lower mortgage rates, easier lending standards and
bubble, but still troubling; it is preventing many young
refinancing activity have dampened the effect that higher
buyers from climbing the ladder of wealth accumulation
prices have on monthly expenses.
built by home ownership. Wealth inequalities will worsen.
The larger issue for the Fed is how long it takes for wages
to accelerate. It took nearly a decade, a drop in the
unemployment rate to 3.5% and a slow increase in labor
force participation to get there during the last expansion.
5 Monthly Economic Outlook: Risks of Another Housing BubbleEconomic forecast — April 2021
2020 2021 2022 2020:4 (A) 2021:1 (A) 2021:2 2021:3 2021:4 2022:1 2022:2 2022:3 2022:4
National Outlook
Chain-Weight GDP1 -3.5 6.6 4.3 4.3 5.6 9.5 8.5 5.1 3.8 2.0 1.9 1.9
Personal Consumption -3.9 7.5 5.0 2.3 9.6 8.8 6.9 6.0 4.8 3.7 3.2 3.2
Business Fixed Investment -4.0 8.0 6.6 13.1 6.9 6.6 12.2 8.4 6.7 4.3 3.7 4.2
Residential Investment 6.1 12.0 -5.8 36.6 9.5 3.8 -2.1 -5.1 -8.0 -8.1 -7.0 -6.6
Inventory Investment -77 88 179 62.1 -69.6 28.2 173.6 220.6 220.2 199.5 164.2 130.3
Net Exports (bil $ ‘12) -926 -1260 -1323 -1122.0 -1189.0 -1245.8 -1283.4 -1320.2 -1327.8 -1328.1 -1322.2 -1315.4
Exports -12.9 6.3 7.5 22.3 0.7 9.3 7.8 8.5 7.6 6.8 6.3 5.7
Imports -9.3 15.0 6.6 29.9 8.6 13.1 9.5 9.7 5.7 4.4 3.5 3.0
Government Expenditures 1.1 2.8 0.0 -0.8 8.5 7.7 0.0 -0.6 0.7 -2.2 -0.1 -0.6
Federal 4.3 2.7 -2.1 -0.9 22.3 -9.3 -3.4 -1.7 -1.4 -1.0 -0.4 -1.6
State and Local -0.8 2.9 1.4 -0.8 0.3 20.4 2.2 0.0 2.0 -3.0 0.1 0.0
Final Sales -2.9 5.8 3.8 2.9 8.2 7.5 5.6 4.3 3.9 2.4 2.5 2.5
Inflation
GDP Deflator 1.1 2.3 2.1 2.0 3.7 1.7 2.0 2.3 2.0 2.0 2.3 2.3
CPI 1.3 2.4 1.6 2.5 3.4 1.8 1.8 1.7 1.4 1.4 1.6 2.1
Core CPI 1.7 1.7 2.0 1.8 0.9 1.6 1.9 2.2 1.9 2.2 2.0 2.3
Special Indicators
Corporate Profits2 -0.7 11.0 1.8 -0.7 18.8 41.8 12.3 11.0 7.2 0.1 -0.7 1.8
Disposable Personal Income 5.8 3.5 -1.4 -10.1 64.2 -27.8 -5.7 -3.5 4.3 3.1 2.8 1.8
Housing Starts (mil.) 1.39 1.56 1.39 1.58 1.54 1.61 1.57 1.52 1.46 1.41 1.36 1.32
Civilian Unemployment Rate 8.1 5.1 3.6 6.7 6.2 5.4 4.6 4.1 3.8 3.6 3.5 3.5
Total Nonfarm Payrolls (thous.)3 -7293 6397 596 1897 902 2673 1758 1064 769 668 529 418
Vehicle Sales
Automobile Sales (mil.) 3.5 3.8 3.8 3.9 3.9 3.8 3.7 3.7 3.7 3.7 3.8 3.8
Domestic 2.5 2.6 2.5 2.8 2.6 2.6 2.5 2.5 2.5 2.5 2.5 2.5
Imports 1.0 1.2 1.3 1.1 1.3 1.2 1.2 1.2 1.2 1.2 1.3 1.3
Lt. Trucks (mil.) 10.5 12.9 12.9 12.3 13.1 13.0 12.8 12.8 12.9 12.9 12.9 12.8
Domestic 8.6 10.1 10.0 9.6 10.3 10.2 10.0 10.0 10.1 10.0 10.0 9.9
Imports 2.4 2.8 2.9 2.7 2.8 2.8 2.8 2.8 2.8 2.9 2.9 2.9
Combined Auto/Lt.Truck 14.0 16.7 16.6 16.2 17.0 16.8 16.5 16.5 16.6 16.6 16.7 16.6
Heavy Truck Sales 0.4 0.5 0.4 0.5 0.5 0.5 0.5 0.5 0.4 0.4 0.4 0.5
Total Vehicles (mil.) 14.4 17.2 17.1 16.7 17.5 17.3 17.0 17.0 17.0 17.0 17.1 17.1
Interest Rate/Yields
Federal Funds 0.4 0.1 0.1 0.1 0.1 0.1 0.1 0.1 0.1 0.1 0.1 0.1
10-Year Treasury Note 0.9 1.7 2.1 0.9 1.3 1.7 1.9 2.0 2.0 2.1 2.1 2.1
Corporate Bond BAA 3.7 3.9 4.2 3.4 3.5 3.8 4.0 4.1 4.2 4.2 4.3 4.3
Exchange Rates
Dollar/Euro 1.13 1.18 1.19 1.19 1.21 1.20 1.21 1.22 1.22 1.23 1.23 1.24
Yen/Dollar 106.8 111.5 112.5 104.5 106.2 111.0 114.0 115.0 114.0 113.0 112.0 111.0
1.
in 2020, GDP was $18.4 trillion in chain-weighted 2012 dollars.
2.
Corporate profits before tax with inventory valuation and capital consumption adjustments, quarterly data represents four-quarter percent change.
3.
Total nonfarm payrolls, quarterly data represents the difference in the average from the previous period. Annual data represents 4Q to 4Q change.
Quarterly data are seasonally adjusted at an annual rate. Unless otherwise specified, $ figures reflect adjustment for inflation. Total may not add up due to rounding.
Copyright © 2021 Diane Swonk – All rights reserved. The information provided herein is believed to be obtained from sources deemed to be accurate, timely and reliable. However, no assurance is
given in that respect. The reader should not rely on this information in making economic, financial, investment or any other decisions. This communication does not constitute an offer or solicitation, or
solicitation of any offer to buy or sell any security, investment or other product. Likewise, this communication serves to provide certain opinions on current market conditions, economic policy or trends
and is not a recommendation to engage in, or refrain from engaging, in a particular course of action.
“Grant Thornton” refers to Grant Thornton LLP, the U.S. member firm of Grant Thornton International Ltd (GTIL), and/or refers to the brand under which the GTIL member firms provide audit, tax and
advisory services to their clients, as the context requires. GTIL and each of its member firms are separate legal entities and are not a worldwide partnership. GTIL does not provide services to clients.
Services are delivered by the member firms in their respective countries. GTIL and its member firms are not agents of, and do not obligate, one another and are not liable for one another’s acts or
omissions. In the United States, visit grantthornton.com for details.
© 2021 Grant Thornton LLP | All rights reserved | U.S. member firm of Grant Thornton International Ltd
6 Monthly Economic Outlook: Risks of Another Housing BubbleYou can also read