ECONOMIC IMPACT OF NEW BRUNSWICK COMMUNITY ENERGY PLANS: PRIMER AND WORKBOOK - New Brunswick Environmental Trust Fund Project # 190166 March 2020
←
→
Page content transcription
If your browser does not render page correctly, please read the page content below

ECONOMIC IMPACT OF NEW BRUNSWICK
COMMUNITY ENERGY PLANS:
PRIMER AND WORKBOOK
                   New Brunswick Environmental Trust Fund
                                         Project # 190166
                                              March 2020
ACKNOWLEDGEMENTS

Lead Authors and Project Team
Robert Kerr, Senior Associate, QUEST
Ericka Wicks, Managing Director, QUEST

Editors
Charlotte Devillers, Lead, Digital Marketing & Design, QUEST
Cheryl Ratchford, Director, Communications & Marketing, QUEST
Melanie Katz, Research Assistant
Lara Haines-Love, Research Assistant

Project Manager
Ericka Wicks, Managing Director, QUEST

Design and Layout
Charlotte Devillers, Lead, Digital Marketing & Design, QUEST

Technical Advisers
Kirby Calvert, Associate Professor, University of Guelph
Karen Farbridge, President, Karen Farbridge and Associates
Eddie Oldfield, Senior Lead, Projects and Advisory Services, QUEST

Project Supporters
Énergie NB Power

About QUEST
QUEST is a national non-government organization that works to accelerate the adoption of efficient and integrated community-scale
energy systems in Canada by informing, inspiring, and connecting decision-makers. QUEST undertakes research, communicates best
practices, convenes government, utility, private-sector and community leaders, and works directly with local authorities to implement on-
the-ground solutions. QUEST grounds all its activities in the “Smart Energy Community”– a concept that encapsulates the ideal end state
of the organization’s work.

Copyright © QUEST - Quality Urban Energy Systems of Tomorrow, [2020].

These materials may be reproduced in whole or in part without charge or written permission, provided that appropriate source
acknowledgements are made and that no changes are made to the contents. All other rights are reserved.

The analyses/views in these materials are those of QUEST, but these analyses/views do not necessarily reflect those of QUEST’s affiliates
(including supporters, funders, members, and other participants) or any endorsement by QUEST’s affiliates.

These materials are provided on an “as is” basis, and neither QUEST nor its affiliates guarantee any parts or aspects of these materials.
QUEST and its affiliates are not liable (either directly or indirectly) nor accept any legal responsibility for any issues that may be related to
relying on the materials (including any consequences from using/applying the materials’ contents). Each user is solely responsible, at the
user’s own risk, for any issues arising from any use or application of the materials’ contents.

TABLE OF
CONTENTS

            4   INTRODUCTION

            5   SECTION ONE: THE TRANSITIONING ENERGY ECONOMY
                Traditional Energy Systems
                Transitioning Energy Systems
                Communities as Market Pathways
                A Definition of a Transitioning Energy Economy

            9   SECTION TWO: JOB CREATION THROUGH THE IMPLEMENTATION OF
                COMMUNITY ENERGY PLANS
                The Scale of Global, National, and Regional Transitioning Energy Economy
                Three Ways Jobs Are Created by Implementing Community Energy Plans
                Job Creation from Keeping Energy Dollars Local
                Attracting Major Actors in the Transitioning Energy Economy

           13   SECTION THREE: QUANTIFYING ECONOMIC POTENTIAL AND IMPACT
                Quantitative and Qualitative Economic Impact
                Job Creation Through Energy Efficiency
                Calculating Job Creation Through Efficiency

           16   SECTION FOUR: ESTIMATING THE LOCAL ECONOMIC
                JOB CREATION FROM YOUR CEP

           20   SECTION FIVE: CASE STUDIES
                Sussex, NB
                Saint John, NB
INTRODUCTION
                                                                                               positive local economic impact of developing and
                                                                                               implementing CEPs
                                                                                             – Communicate content to local government
Accounting for 59% of energy consumption and over                                            – Clarify the economic development role of
56% of greenhouse gas (GHG) emissions in Atlantic                                              municipalities in supporting CEPs
Canada1, communities are central and actively working
to enable the Province of New Brunswick to achieve its                                       This Workbook is the result of previous work by
energy and GHG emissions reduction objectives. Though                                        municipalities that have completed some form of
communities are developing Community Energy and                                              community energy plan and have made substantial
Emissions Reductions Plans or Community Energy Plans                                         efforts to establish a baseline of energy use and GHG
(hereafter collectively referred to as CEPs) to improve                                      emissions across their communities. Further, these
local energy efficiency and reduce GHG emissions, there                                      communities have established targets to reduce their
is limited support for enabling the implementation of                                        community-wide energy use and GHG emissions thus
those plans.                                                                                 allowing for the qualitative and quantitative estimates of
CEPs are often developed under the leadership of                                             the local economic impact of achieving these targets.
municipalities. However, the goals of these plans are
                                                                                             This Workbook is the outcome of three main activities
often community2-wide, with many stakeholders.
                                                                                             previously conducted under the auspices of the overall
Many municipalities are challenged in maintaining this                                       project:
leadership role as they:                                                                       1. A compendium of research that:
– Don’t see energy as the purview of local government                                               a. Supports a definition and description of the
– Are not aware of the changes in energy markets and                                                   “transitioning energy economy”
  technologies that bring local benefits                                                            b. Macro level economic impact from
– Are not aware of how this fits with their traditional                                                technologies, systems and organizations that
  economic development role in attracting investment                                                   are related to implementing CEP’s that seek to
  and job creation                                                                                     capitalize on the benefits of the “transitioning
                                                                                                       energy economy”
This Workbook has been developed under a project                                                    c. A summary of the economic models that are
funded by the New Brunswick Environmental Trust Fund                                                   used to determine and calculate the economic
and New Brunswick Power.                                                                               impact of implementing CEPs
                                                                                               2. Case studies of two selected communities - their
WORKBOOK PURPOSE                                                                                  quantified energy and emissions profiles, target
                                                                                                  strategies and resulting economic impact
This Workbook is aimed at articulating the local
                                                                                               3. Key indicators that all New Brunswick municipalities
economic benefits of the development and
                                                                                                  can use to calculate and estimate the economic
implementation of CEPs with the goal of improving
                                                                                                  impact of their CEPs
understanding of the value of implementing CEPs
among municipalities and their stakeholders in New
Brunswick. In an effort to increase “buy-in” from New
                                                                                             WORKBOOK CONTENTS
Brunswick municipalities, this Workbook will include the                                     This Workbook contains three main components:
following objectives:                                                                        – A primer on the elements of a transitioning energy
                                                                                               economy and how it has the potential for local
– Development of a communication package for local
                                                                                               economic impact
  governments that describes and demonstrates the
                                                                                             – How to estimate the local economic impact of GHG
1 Comprehensive Energy Use Database - Natural Resources Canada                                 reductions and reduced energy use of any specific
2 The term “community” or “communities” refers to all infrastructure and residential,
                                                                                               community that has completed a CEP
commercial, industrial, institutional, transportation, utility, and agriculture activities
within a given geographic (or municipal/Indigenous community) boundary. The term             – Case studies of two specific New Brunswick
“local government” refers to a specific level of government (e.g. municipal government,        communities, Sussex and Saint John
regional government, Indigenous government)

                                                                                                                                                      4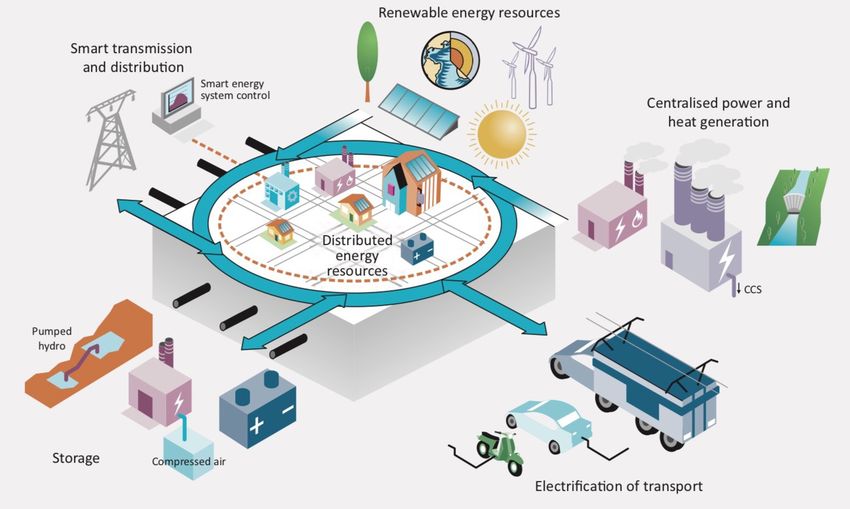
SECTION ONE:
THE TRANSITIONING ENERGY
ECONOMY

                           Photo on5 gnb.ca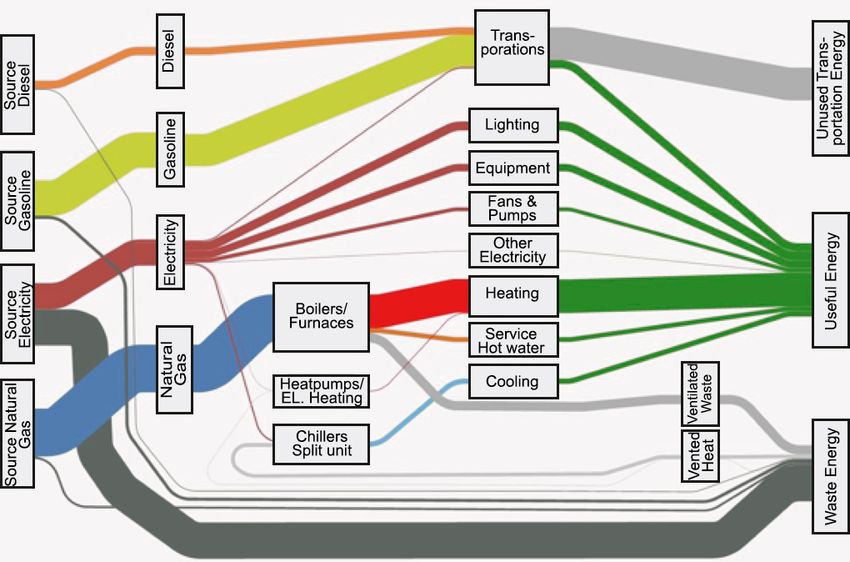
Before beginning to understand how local economies                                energy inputs and end-uses in the Town of Oakville,
are impacted by the implementation of CEPs, a clear                               Ontario (population approx. 200,000). The relative scale
description of what we mean by a transitioning energy                             of the diagram is typical for most municipalities and is
economy will inform the ongoing work of the project.                              shown here to demonstrate the waste of centralized
                                                                                  energy systems from source to end-use.
The terminology of a “transitioning energy economy” is
widely understood to have originated in Germany and is                            The dark connectors in the diagram represent waste - in
commonly referred to as the EnergieWende3.                                        this case approximately 50%. The costs related to the
                                                                                  purchase of the energy to serve the communities end-
                                                                                  uses, by definition, include paying for the waste. The
                                                                                  cost of maintaining the major infrastructure required

TRADITIONAL ENERGY                                                                to generate and deliver energy with large centralized
                                                                                  systems is significant and contributes to inflationary

SYSTEMS                                                                           cost pressures. In 2017 the Town of Oakville spent
                                                                                  approximately $600 million a year in energy costs.
                                                                                  Research has shown that the costs of energy for the
At a high-level, the concept of an energy transition is                           Town could increase by four to seven times this annual
the movement away from traditional energy systems                                 cost under the current energy supply and end-use
which include large centralized energy generation and                             framework.
distribution systems that maintain considerable carbon
content in their fundamental fuel supply.

Figure 1 below is a Sankey diagram showing the source

3 Strunz, S. (2014). The German Energy Transition as a Regime Shift. Ecological
Economics,100, 150-158. [reference #38]

Figure 1 – Town of Oakville, Ontario - Energy Balance 2016

                                                                                                                                             6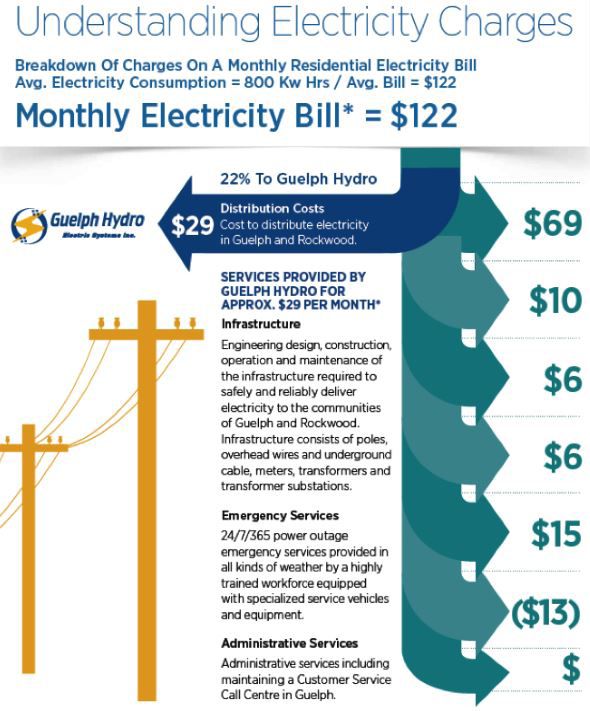
1. Improve efficiency – first, reduce the energy input

TRANSITIONING ENERGY                                                                               required for a given level of service
                                                                                                2. Optimize exergy – avoid using high-quality energy

SYSTEMS                                                                                            in low-quality applications
                                                                                                3. Manage heat – capture all feasible thermal energy
                                                                                                   and use it, rather than exhaust it
Driven by technological innovation, centralized                                                 4. Reduce waste – use all available resources, such as
energy supply and distribution systems are now being                                               landfill gas and municipal, agricultural, industrial,
challenged by the increase of distributed, local systems.                                          and forestry wastes
There has been significant growth in the markets for                                            5. Use renewable energy resources – tap into local
energy efficiency technology that can vastly reduce the                                            opportunities for geoexchange systems, small scale
demand for end-use efficiency.                                                                     hydro, biomass, biogas, solar, wind energy, and
                                                                                                   opportunities for inter-seasonal storage
What technologies are we talking about when
                                                                                                6. Use energy delivery systems strategically –
we discuss the distributed energy systems that
                                                                                                   optimize use of energy delivery systems and use
typically inform CEPs? In order to guide the effective
                                                                                                   them as a resource to ensure reliability and for
implementation of Smart Energy Communities, QUEST
                                                                                                   energy storage to meet varying demands
has developed six Smart Energy Community technical
principles4. These principles can help guide the
                                                                                              The figure 2 below illustrates how these technologies
development and implementation of a CEP.
                                                                                              are integrated into a community context.

Figure 2 – Distributed (Local) Energy Systems5

 4 The Smart Energy Community Principles were developed as part of the Integrated Community Energy Solutions Literacy Series in 2012. The Building Smart Energy Communities
white paper provides an overview of Smart Energy Communities (referred to as Integrated Community Energy Solutions) and the principles required for their implementation. The initial
six technical principles developed by QUEST were endorsed by the Council of Energy Ministers and Council of Federation in 2009 in the Integrated Community Energy Solutions – A
Roadmap for Action

5 OECD IEA 2014 Energy Technology Perspectives fig. 137, pg. 132 IEA

                                                                                                                                                                                    7
COMMUNITIES AS MARKET A DEFINITION OF A
PATHWAYS TRANSITIONING ENERGY
Communities and their municipal governments are in a
position to play a key role in making their communities
ECONOMY
significantly more energy efficient and attracting Based on the project’s research and the QUEST technical
investment in local energy infrastructure. To do so, and policy principles, the following definition has been
QUEST has developed policy principles to guide the developed for context in the remaining New Brunswick
process of developing and implementing CEPs. These municipal engagements planned for the project.
principles are critical in ensuring the maximum potential
positive local economic impact. The intent of the definition is to not to be an all
encompassing academic description but to be
1. Match land use needs and mobility options – described in the context of the value to the individual
understand the energy implication of land use, community, who is seeking ongoing political and
infrastructure for water and wastewater, waste community support and stakeholder engagement, for
management, personal mobility, goods movement, the implementation of their CEPs.
and building design decisions
2. Match energy options to local context – local
climate, building on land use choices, industrial The Transitioning Energy Economy is largely
structure, availability of local sources of waste and defined as the change, over time, from centralized
renewables forms of generating and distributing energy in all
3. Send clear and accurate price signals – consumers its forms. This transition has three key attributes
should see and pay full real costs, including external that link to a potentially positive impact on local
costs and regional economies.
4. Manage risks and be flexible – maintain
1. The increase in readily available technologies
technological and fuel diversity, pursue cost-
and services that can serve the local goals of
effective opportunities first and incorporate
CEPs
learning, and assume the need to adapt quickly to
2. The vast majority of those technologies are
market and technological surprises
located or implemented locally
5. Emphasize performance and outcomes in policy
3. CEPs create channels to local markets for
and regulations – avoid prescribing fuels and
product and service providers that have a
technologies
measurable positive economic impact by:
6. Pursue policy and program stability – maintain
a. Attracting local investment for local
a consistent and predictable decision making
energy infrastructure
environment to sustain investor confidence
b. Creating more energy-efficient
economies
8SECTION TWO:
JOB CREATION THROUGH THE IMPLEMENTATION
OF COMMUNITY ENERGY PLANS
Photo by Gérard Sirois on9gnb.caTHE SCALE OF GLOBAL, THREE WAYS JOBS ARE
NATIONAL, AND REGIONAL CREATED BY IMPLEMENTING
TRANSITIONING ENERGY COMMUNITY ENERGY PLANS
ECONOMY Job creation through the implementation of CEPs can be
manifest in three ways:
The size of markets for the products and services that 1. Local dollars kept in the community
serve the transitioning energy economy has significantly 2. Direct, Indirect, and Induced job creation from these
grown in the last 20 years. local dollars
The channels to new energy markets are being driven, to 3. “New dollars” that can be attracted to investment
a large degree, by local governments coordinating with activities that support CEPs.
stakeholders in their communities, as described in the
section Communities as Market Pathways. RETAINING ENERGY DOLLARS IN THE COMMUNITY
THROUGH ENERGY EFFICIENCY
Local governments, who have an interest and purview
over their local economies, are largely motivated by This category has the most direct, calculable, and easily
the positive economic impacts that come with the communicated impact on local job generation as a
implementation of CEPs. result of implementing CEPs.
CEPs are widely seen as having a large number of Approximately 80% of a communities’ energy
benefits beyond positive economic impact including expenditures on heating, cooling, lighting, industry and
environmental, health, and social benefits. Many of transportation leaves the community to fund traditional
these other benefits have related economic benefits. For centralized energy infrastructure.
example, improved health can have a significant positive
Municipalities and their communities across New
impact on reducing community-wide health costs to
Brunswick are setting energy efficiency targets for
local economies.
their communities and aiming to reduce energy use
However, the scope of this research has been limited to (and related costs) by as much as 40% in the long term.
three aspects of economic impact on local economies, To use the example of the Town of Oakville, Ontario
as described below. (see Fig. 1), this could mean as much as $240 million
a year (at today’s costs) remaining in the community
and stimulating direct, indirect and induced jobs as
described in above.
10Figure 3 demonstrates the cost distribution of a typical electricity bill. Similar distributions apply to natural gas and
transportation fuels.
Figure 3 – Electricity Cost Distribution6
6 Guelph Hydro - Annual Report 2015
11JOB CREATION FROM ATTRACTING MAJOR ACTORS
KEEPING ENERGY DOLLARS IN THE TRANSITIONING
LOCAL ENERGY ECONOMY
NOTE: Based on the scope of the project and the This category of potential job creation from
availability of useful reference material uncovered implementing Community Energy Plans is unique in
through research, the “multiplier” approach to that it does not have specific multipliers that are directly
estimating economic impact, measured in the form linked to the plan’s technical goals and targets.
of job creation, is the recommended approach to
Across the globe there is evidence of rapidly growing
determining job creation through implementing CEPs.
market activity for providers of products and services
The multiplier is described as follows: Typically, that support the implementation of CEPs. Companies
developing a multiplier involves estimating the average and related organizations are looking to expand their
amount of revenue required to support a single worker current market activities or enter into new markets7.
for one year at full-time or the amount of efficiency
This is especially true of European companies that have
investments required to add a dollar to the local or
matured under a transitioning energy economy and
regional gross domestic product (GDP).
now looking to export their expertise, reflected in their
In the Multiplier method, as in others, jobs are generally products and services, to North America.
understood to be created three ways:
Which segments of the transitioning energy economy
– Direct Jobs - These are the jobs created during the that may locate in any given municipality will depend
first round of any spending. In the implementation on many of the factors any company would look for with
phase, these jobs are often related to the activities that the addition of the regional opportunities afforded by
improve energy efficiency and or implement energy local, national, and international markets for any given
generation/distribution systems with the companies transition technology or service.
or organizations performing those upgrades hiring
In New Brunswick and the general Atlantic Region there
the appropriate people. The avoided energy costs that
are specific opportunities in the areas of water (tidal
come from these activities support the “savings phase”
power), solar, wind, biomass, biofuels and geothermal.
where direct jobs are those created when households
spend their savings, often at retail or other service-
sector establishments.
– Indirect Jobs - These are the jobs created in the
supply chains that deliver goods and services to
establishments in the direct job category.
– Induced Jobs - These are jobs that are created when
the newly hired workers in the direct or indirect
categories re-spend their new earnings on goods and
services.
7 International Energy Agency - Market Report Series, Energy Efficiency 2018, analysis
and Outlooks [Reference #64]
12SECTION THREE:
QUANTIFYING ECONOMIC
POTENTIAL AND IMPACT
13
Photo by Miguel Ángel Sanz on UnsplashMultipliers – Jobs per $Million
QUANTITATIVE AND 20 21
18
QUALITATIVE ECONOMIC 17
14
IMPACT 9
Based on the description in section Three Ways Jobs
e
y
g
n
s
t
are Created, this section will provide an overview of the
en
ice
ilit
ag
io
in
ct
ur
nm
Ut
er
rv
ru
ct
“multiplier” quantitative approach to estimating job
Av
Se
r
st
fa
ve
n
u
Go
Co
an
creation.
M
Qualitatively, this section will also look at the macro- NOTE: Columns in red indicate multipliers used in the next
scale of the transitioning energy market to provide section.
context and to illustrate the opportunity that all New Figure 4– Typical Sector-Based Job Multipliers - US
Brunswick communities have to attract major market Example8
actors.
CALCULATING JOB CREATION
JOB CREATION THROUGH THROUGH EFFICIENCY
ENERGY EFFICIENCY Using the chart indicated in Figure 4 we have two
fundamental aspects to job creation through energy
efficiency.
Estimating job creation impacts through energy
efficiency is a fairly straightforward arithmetic process. Investment Phase
The following Figure 4 overviews several key known For the investment phase, the “Construction” multiplier
multipliers. Specifically, there are three multipliers that (20 jobs/$M) is typically used to define the activities that
will inform the example described below: improve end-use energy efficiency in the community.
When compared to the “Average” multiplier (17
– Average - This is the blended average multiplier of job
jobs/$M), we see that we have a minimum net increase
creation across all sectors of the economy.
in job stimulation of 3 jobs/$M - i.e. [20 jobs/$M] - [17
– Utility - This is the job creation specific to all aspects
jobs/$M].
of the utility industry - generation and distribution -
across the entire system. Savings Phase
– Construction - This is a very broad activity but
indicative of the job creation from implementing the The savings phase of job creation is founded on the
measures generally described in a Community Energy avoided costs that would normally go to the “Utility”
Plan. sector (9 jobs/$M) and would now go to the general, or
“Average” economy (17 jobs/$M). The simple arithmetic
tells us that the net impact through energy efficiency
equals 8 jobs/$M in avoided energy costs - i.e. [17
jobs/$M - 9 jobs/$M]. Typically, jobs created through
energy efficiency are projected over a 20-year period.
8 American Council for and Energy Efficient Economy - Fact Sheet, How Does Energy
Efficiency Create Jobs? [Reference #51]
14Table 1 – Summary of Job Creation Multipliers
Pre-CEP
Post-Implementation Net Job Creation
Phase Implementation
Multiplier (Jobs/$M) Benefit (Jobs/$M)
Multiplier (Jobs/$M)
Investment Phase 17 (Average) 20 (Construction) 3
Savings Phase 9 (Utility) 17 (Average) 8
CEPs typically have two fundamental aspects to them that allow for the estimation of job creation impacts:
1. The establishment of a baseline that determines the existing energy end-use in the community
2. A target of energy end-use at a specific future date. This would be the “Savings Phase” as described in the
previous section
Estimating the investments required to achieve improved energy end-use is more complex but can be estimated using
the assumption that investments will be made with a reasonable expectation of a simple payback in the eight-year
range. In other words, an estimate of avoided energy costs, through energy efficiency, of an estimated $10M would
be driven by an estimated investment of $80M [$10M X 8 yr. simple payback]. This would allow for an estimate of job
creation impact using the calculations described in Table 2 above.
NOTE: The examples shown in this section are based on US-based multipliers. Each region in Canada will have slightly
different, but similar multipliers. This summary intends to demonstrate the methodology.
Also note that job creation for energy efficiency is often cited as creating up to 30 jobs in Canada9. While this
is accepted as an appropriate number for Canada it has not been broken down regionally. Therefore, we have
maintained the more conservative US figure of 21. Secondly, it is also important to note that the figure of 21 (or 30
in Canada), in isolation, is not reflective of the net impact of energy efficiency on job creation. It merely indicates the
gross number of jobs created and does not take into account how it affects other aspects of the economy.
9 Dunksy Energy Consulting (2018). The Economic Impact of Improved Energy Efficiency
in Canada. Prepared for Clean Energy Canada [Reference #49]
15SECTION FOUR:
ESTIMATING THE LOCAL ECONOMIC
JOB CREATION FROM YOUR CEP
16
Photo by Helloquence on UnsplashThe following worksheet supports a process by which you can estimate the job impact potential of your Community
Energy Plan (CEP) using information available in your plan and, where applicable, enhanced with additional current
data.
ESTIMATING TOTAL COMMUNITY ENERGY EXPENDITURE
There are two approaches to determining your annual energy expenditures, depending on the level of detail available
to you.
DETAILED METHOD
Table 1 – Detailed Annual Energy Expenditure
Detailed Energy Breakdown
Base Year:
Energy type Total (GJ) Unit Cost ($ per GJ) Annual Expenditure ($M)
A B AxB
Electricity
Fuel Oil
Natural Gas
Heavy Fuel Oil
Propane
Gasoline Transportation
Diesel - Transportation
Propane - Transportation
CNG
TOTAL ANNUAL ENERGY EXPENDITURE
17SIMPLE METHOD
If you are unable to obtain a breakdown of your community’s energy use, a total figure may be used. Subsequently, an
average range, per GJ, of fuel prices can be applied to determine a total energy expenditure for your community.
Table 2 – Simple Total Annual Energy Expenditure
Detailed Energy Breakdown
Base Year:
Total (GJ) Unit Cost ($ per GJ) TOTAL Annual Expenditure ($M)
A - High 25.00 C - Total (GJ) X A
B - Low 35.00 D - Total (GJ) X B
AVG. TOTAL (C + D) / 2
ESTIMATING TOTAL ENERGY DOLLARS RETAINED IN THE
LOCAL ECONOMY
Now that you have estimated the total energy expenditure in your community, you are in a position to determine the
retained energy expenditures that will remain in your community as a result of implementing your CEP.
Your CEP will likely have a total energy end-use reduction target. Simply applyi it to the total energy expenditures
determined in the previous section.
Table 3 – Total Retained Energy Dollars
Total Energy
Reduction Target (%) TOTAL Retained Energy Dollars ($M)
Expenditures ($M)
From Table 1 or 2 X
ESTIMATING JOB CREATION FROM RETAINED ENERGY
DOLLARS
As described in Section 3 above and the data illustrated in Table 2 and Figure 4, there are two effects of keeping
dollars local to the community.
INVESTMENT PHASE
These are jobs stimulated through the construction related to activities identified in your CEP. For example, home
retrofits, installation of solar panels or the development of thermal distribution systems.
18As described in Section 3, construction job creation, per $ million of investment, is estimated to have a net advantage
of three jobs per $ million of investment when compared to the local economy.
Determining the total community investment required to implement your CEP can be broadly estimated by the simple
payback (in years) of the investment through energy savings.
Table 4 – Estimating Total Community Investment
TOTAL Retained Energy Estimated Simple
TOTAL Investment ($M)
Dollars ($M) Payback (years)
From Table 3 X 8
Table 5 – Total Investment-Related Job Creation
Net Job Creation
TOTAL Investment ($M) Total Investment-Related Job Creation
(per $M)
From Table 4 X 3
SAVINGS PHASE
These are jobs stimulated through the redirection of energy dollars from the payment to utilities for primary and
secondary fuel supply to the general local economy.
As described in Section 3, utility job creation, per $ million of investment, is estimated at nine jobs per $ million
of investment compared to 17 jobs per $ million of investment in the general local economy. This leads to a net
advantage of eight jobs per $ million over an estimated 20-year time frame.
Table 6 – Total Savings-Related Job Creation
TOTAL Retained Energy Net Job Creation
Total Savings-Related Job Creation
Dollars ($M) (per $M)
From Table 3 X 8
TOTAL JOB CREATION
You are now able to finalize the final estimate of job creation from your Community Energy Plan.
Total Investment-Related Job Creation From Table 5 For term of construction
Total Savings-Related Job Creation From Table 6 For 20 years
19SECTION FIVE:
CASE STUDIES
Photo by Tim Foster on 20
Unsplash2020 | CASE STUDY
ECONOMIC IMPACT OF COMMUNITY ENERGY PLANS
SUSSEX, NB
INTRODUCTION
heavily travelled route in the Maritimes to the United
States.
Since 2003, natural gas has been available from the
The project ran from June 2019 to March 2020.
McCully field near Sussex. The potential local natural gas
The goals were to: supply and the energy opportunities resulting from the
recently closed Potash Company of Canada mine both
– Create a compendium of research support the goals of the town’s Community Energy Plan
– Apply economic development impact analysis to three and its economic development objectives.
New Brunswick municipalities
– Develop a model for other New Brunswick COMMUNITY ENERGY PLANS
municipalities to determine the local economic impact
The Sussex Community Energy Plan, developed in July
of their Community Energy Plans
2018, is formally called the Community GHG & Energy
Action Plan. The plan has several high-level objectives
Sussex was one of several municipalities identified to
that seek to reduce energy and GHG emissions,
work with QUEST to align the initial project research
transition to low-carbon technologies and infrastructure
with Sussex’s Community Energy Plan and related local
and increase local renewable energy production.
economic development objectives.
Five Key Objectives of the GHG
THE SITUATION & Energy Action Plan
1. Reduce dependency on fossil energies.
2. Curb down energy use, expenses and reduce
ABOUT SUSSEX
GHG emissions.
Sussex is a town in Kings 3. Foster a shift towards low carbon
County with a population transportation solutions integrating EV
of 4,282 (2016). Sussex is infrastructure, and promoting alternative fuel
located in south-central New Brunswick, between the vehicles.
province’s three largest cities, Saint John, Moncton, and 4. Generate income with local renewable energy
Fredericton. As the heart of Kings County with its 16 production.
covered bridges, Sussex is known as the Covered Bridge 5. Expand transportation alternatives by setting
Capital of Atlantic Canada. up a community van service.
Today, Sussex is primarily a regional service centre
The Community GHG & Energy Action Plan eight key
for the surrounding agricultural communities of the
goals that support the plan’s vision of achieving a low
upper Kennebecasis River valley. The town is a highway
carbon and smart energy community in an economically
service centre on Route 1, the primary highway between
viable way.
Moncton and Saint John, as well as being the most
21Key goals of the GHG & Energy Action Plan 7 Priorities of the Hampton-Sussex
Economic Development Strategy
1. Foster a shift toward low carbon technologies.
2. Increase energy efficiency for new and – Priority 1: Tourism and Arts & Culture
existing buildings. – Priority 2: Geothermal Energy Development
3. Foster a shift toward low carbon – Priority 3: Food Production and Processing
transportation that integrates EV – Priority 4: Low-Cost Energy (from existing natural
infrastructure, promotes alternative fuel gas sources)
vehicles, low carbon fuel options, as well as – Priority 5: Warehousing/Distribution
public transit and active transportation as – Priority 6: Targeted and Aligned Retail
mechanisms to reduce the number of vehicles Development
on the road. – Priority 7: Targeted and Aligned Training/
4. Create or help adaptive, sustainable, Education
affordable, and reliable local renewable and
clean energy supply. Most notably, priorities #2 and #4 have identified
5. Design, build and revitalize neighbourhoods two major energy-related economic development
as complete communities that offer multi- opportunities:
modal transportation options. – Using the flooded mines of the close potash plants to
6. Create new market opportunities for develop a geothermal-based heating and/or cooling
innovative energy solutions that are attractive systems for high-demand applications at a cost
for local and new businesses, and through substantially below alternative sources.
high quality, affordable, clean energy services – There is a natural gas well field that has operated in
foster retention and growth of existing the Sussex area for over 20 years that had previously
businesses and industries. provided the potash mines with a reliable energy
7. Build awareness about energy investment supply. The local ability to produce and transport
and create a culture of energy conversation natural gas may attract industries and businesses
amongst residents, businesses, institutions, with high-energy requirements and may be a
and industries. complementary/synergistic offering to the geothermal
8. Build knowledge, skills, and technical capacity opportunity.
through partnerships that deliver innovative
energy solutions at the local scale.
The goal #6 provides a strong link to pursue positive
economic impact through the implementation of the
THE RESULTS: THREE
Community GHG & Energy Action Plan and to be
consistent with one of the key principles of the Plan
POTENTIAL ECONOMIC
which is to “create a competitive and economic advantage
for the Community”.
IMPACTS
ECONOMIC DEVELOPMENT QUEST’s research shows that economic impact, through
the implementation of Community Energy Plans, is
In February 2017, The Greater Sussex -Hampton Region manifest in three key ways:
Economic Development Strategy was developed after 1. Keeping more energy dollars in the pockets
considerable consultation with the community. of consumers as a result of significant energy
The Strategy is based on seven key priorities. efficiency and spending those dollars in other
sectors of the local economy
2. Attracting investment and the resulting job
creation from local energy infrastructure that
22drives reduced energy use, such as solar system CREATE JOBS
installers, combined heat and power designers and
technicians, etc. Jobs are created from this economic impact in three
3. Attracting major corporate actors in the ways:
transitioning energy economy that are seeking – Direct Jobs (Investment Phase) - These are jobs
to enter regional, national and North American created directly as a result of the activities that drive
markets energy cost reduction - for example, home insulation
companies, residential solar installers, etc.
– Indirect Jobs (Savings Phase) - These are the jobs
KEEP THE MONEY LOCALLY
created in the supply chains that deliver goods and
To determine the impact resulting from items #1 and services to the direct job category.
#2, QUEST provided a high-level analysis of potential – Induced Jobs (Savings Phase) - These are jobs that are
job creation impact from a key recommendation of the created when the newly hired workers in the direct
Community GHG & Energy Action Plan: or indirect categories re-spend their new earnings on
local goods and services.
“At least half of residential and commercial [buildings]
improve their energy efficiency”
Calculating job impacts is determined by using known
Residential and ICI Consumption typical multipliers¹ for job creation in the status-quo
Breakdown Energy Supply (%) local economy. For example, in a typical multi-faceted
local economy, 17 jobs are created per million of
spending. Energy-related activity has a higher job-
creation effect at an estimated 20 jobs per million of
spending. In the saving phase, dollars that are no longer
going to utilities (estimated nine jobs per million) are
then being spent in the general economy at 17 jobs per
million.
Investment Savings
Phase
Phase Phase
Pre-CEP Implementation 17 9
Multiplier (Jobs/$M) (Average) (Utility)
Based on unit fuel estimates prices generally available,
Post Implementation 17
it is estimated that total energy annual costs are 20
Multiplier (Jobs/$M) (Average)
approximately $9.1 million. If we assume that a 25%
Net Job Creation Benefit
reduction in these costs can be achieved through the 3 8
(Jobs/$M)
targets of the Community GHG & Energy Action Plan
then we are able to determine that, at today’s estimated To achieve the goal of a $2.3 million reduction in energy
energy prices, approximately $2.3 million could costs will drive an estimated investment of $18.6 million
remain annually in the community as a result of (based on an estimated 8-year simple payback).
energy conservation and the related costs.
Applying the estimated investments and the estimated
energy cost reductions we have a local impact of 56
jobs during the investment phase and 19 person-
years of employment for at least 20 years during the
savings phase.
¹ These multipliers are made available by the American Council for an Energy
Efficient Economy: Fact Sheet How Does Energy Efficiency Create Jobs?. Specific
sector-based multipliers for Sussex are not available. The figures shown are
provided to illustrate order of magnitude and comparisons among economic
sectors.
23ATTRACT MAJOR CORPORATE ACTORS
Aligning energy, climate and economic development
policy and strategy can have a very positive impact on
CONCLUSION
attracting resources and investment to the community. Sussex has demonstrated significant policy and strategy
This is strongly reflected in the alignment of the alignment that recognizes the economic development
Community GHG & Energy Action Plan and the potential of implementing Community Energy Plans
The Greater Sussex -Hampton Region Economic through the community-involved development of both
Development Strategy. Specifically, the recommended their Community GHG & Energy Action Plan and
Economic Development priority of taking advantage of the The Greater Sussex-Hampton Region Economic
two local opportunities in the closed potash mines and Development Strategy.
the local natural gas fields.
As Sussex continues to pursue its energy, climate and
The flooded mine shafts of the closed potash plant economic development goals it would benefit further
present a unique economic development opportunity. from developing energy efficiency strategies programs
This infrastructure could be repurposed to provide for their homes, businesses and institutions that keep
geothermal-based heating and/or cooling for high- energy dollars in the local economy.
demand applications at a cost substantially below
Attracting investment into the community through
alternative sources. Geothermal opportunity at this
strong policy and strategy alignment is a key signal to
scale could provide the basis for an economically viable
investors and product and service providers. This is very
district energy system that could service a number
evident in the economic priorities related to the local
of new developments in the area such as large-scale
natural gas fields and the closed potash mines.
greenhouses or any other application requiring a large
source of heating/cooling. Sussex has done an excellent job of understanding
their local situation and turning them into very scalable
This economic objective aligns extremely well with
opportunities that will economically benefit the citizens
the specific recommendation of the Community GHG
of Sussex.
& Energy Action Plan which calls for “the generation
of income from local renewable energy production -
geothermal district energy”.
The natural gas being produced in the Greater Sussex-
Hampton area has the potential to ensure a cost-
competitive supply to potential customers, and job
creators, in the community and region. In addition, the
availability of cost-competitive natural gas in the region
can directly serve several goals of the Community GHG
& Energy Action Plan, specifically:
1. Reducing the dependency on fossil fuels - at least
25% of residential heating oil
2. Promoting alternative fuel vehicles
242020 | CASE STUDY
ECONOMIC IMPACT OF COMMUNITY ENERGY PLANS
SAINT JOHN, NB
the city to adopt a new economic strategy. Saint John
INTRODUCTION maintains industrial infrastructure in the city’s East side
such as Canada’s largest oil refinery.
The project ran from June 2019 to March 2020. Saint John Energy, formerly known as the Power
Commission of the City of Saint John and Civic Hydro, is
The goals were to: the electrical utility reseller of power purchased from NB
– Create a compendium of research Power in Saint John, New Brunswick. It was founded in
– Apply economic development impact analysis to three 1922 and now serves over 36,000 customers. The utility
New Brunswick municipalities sells 950GWh of electricity annually, however the utility
– Develop a model for other New Brunswick has no electrical generating capacity of its own.
municipalities to determine the local economic impact COMMUNITY ENERGY PLANS
of their Community Energy Plans
The Saint John Community Energy Plan, developed
Saint John was one of several municipalities identified in January 2019, is formally called the Saint John
to work with QUEST to align the initial project research Community GHG & Energy Action Plan. The plan has
with Saint John’s Community Energy Plan and related several high-level objectives that seek to reduce
local economic conditions. energy and GHG emissions, transition to low-carbon
technologies and infrastructure and increase local
renewable energy production.
THE SITUATION The Community GHG & Energy Action Plan eight key
goals that support the plan’s vision of achieving a low
carbon and smart energy community in an economically
ABOUT SAINT JOHN
viable way.
Saint John is a port city located on
the Bay of Fundy in the province of Key goals of the GHG & Energy Action Plan
New Brunswick, Canada. Saint John
1. Foster a shift toward low carbon technologies.
is the oldest incorporated city in Canada; established by
2. Increase energy efficiency for new and
royal charter on May 18, 1785. The port is Canada’s third
existing buildings.
largest port by tonnage. Saint John has a population
3. Foster a shift toward low carbon
of 67,575 over an area of 315.82 km2 (121.94 sq mi).
transportation that integrates EV
Greater Saint John covers a land area of 3,362.95 km2
infrastructure, promotes alternative fuel
(1,298.44 sq mi) across the Caledonia Highlands, with a
vehicles, low carbon fuel options, as well as
growing population of 126,202 as of 2016.
public transit and active transportation as
Saint John derived its economy from maritime industries mechanisms to reduce the number of vehicles
such as shipping, fishing, and shipbuilding. Since 2003, on the road.
shipbuilding has ended on the scale it once was, forcing
254. Create or help adaptive, sustainable, Four Strategic Goals
affordable, and reliable local renewable and
1. 2.5% increase in employment per year
clean energy supply.
2. 2.5% increase in labour per year
5. Design, build and revitalize neighbourhoods
3. 0.5% increase in Gross Domestic Product
as complete communities that offer multi-
4. 1 index pt increase in consumer confidence per
modal transportation options.
year
6. Create new market opportunities for
innovative energy solutions that are attractive
for local and new businesses, and through Implementing the Community Energy Plan has the
high quality, affordable, clean energy services potential to support all of the focus areas and strategic
foster retention and growth of existing goals, particularly in the areas of keeping energy
businesses and industries. dollars in the community, creating jobs and attracting
7. Build awareness about energy investment investment.
and create a culture of energy conversation
The current Economic Development Plan has a strong
amongst residents, businesses, institutions,
potential to align with the goals of the Community
and industries.
Energy Plan, specifically with:
8. Build knowledge, skills, and technical capacity
through partnerships that deliver innovative – The three-year Workforce Development goal of
energy solutions at the local scale. securing significant investment in energy
– The innovation strategy to leverage Saint John
Goal #6 provides a strong link to pursue positive Energy as an important regional asset in developing
economic impact through the implementation of the innovative energy solutions
Community GHG & Energy Action Plan and to be – The Saint John’s foundational strengths that include
consistent with one of the key principles of the Plan energy infrastructure and support capabilities
which is to “create a competitive and economic advantage
for the community”.
THE RESULTS: THREE
ECONOMIC DEVELOPMENT
In 2019, with extensive consultation with community
POTENTIAL ECONOMIC
stakeholders, Economic Development – Greater Saint
John tabled its Economic Development Plan 2019-2021.
IMPACTS
The strategy is based on four areas of focus and four QUEST’s research shows that economic impact, through
strategic goals of 2019 to 2021. the implementation of Community Energy Plans, is
manifest in three key ways:
1. Keeping more energy dollars in the pockets
Four Focus Areas of consumers as a result of significant energy
1. Workforce development efficiency and spending those dollars in other
2. Entrepreneur development sectors of the local economy
3. Business investment & innovation 2. Attracting investment and the resulting job
4. Marketing greater Saint John creation from local energy infrastructure that
drives reduced energy use, such as solar system
installers, combined heat and power designers and
technicians, etc.
3. Attracting major corporate actors in the
transitioning energy economy that are seeking
26to enter regional, national and North American CREATE JOBS
markets
Jobs are created from this economic impact in three
ways:
KEEP THE MONEY LOCALLY
– Direct Jobs (Investment Phase) - These are jobs
To determine the impact resulting from items #1 and created directly as a result of the activities that drive
#2, QUEST provided a high-level analysis of potential energy cost reduction - for example, home insulation
job creation impact from a key recommendation of the companies, residential solar installers, etc.
Community GHG & Energy Action Plan: – Indirect Jobs (Savings Phase) - These are the jobs
created in the supply chains that deliver goods and
“At least half of residential and commercial [buildings]
services to the direct job category.
improve their energy efficiency”
– Induced Jobs (Savings Phase) - These are jobs that are
Based on a 2015 baseline, the related fuel used to heat, created when the newly hired workers in the direct
cool and light Saint John homes, businesses, offices and or indirect categories re-spend their new earnings on
institutional buildings is shown in the following figure: local goods and services.
Saint John - Primary and Secondary Calculating job impacts is determined by using known
Energy Distribution Percentage of Total GJ typical multipliers¹ for job creation in the status-quo
local economy. For example, in a typical multi-faceted
local economy, 17 jobs are created per million of
spending. Energy-related activity has a higher job-
creation effect at an estimated 20 jobs per million of
spending. In the saving phase, dollars that are no longer
going to utilities (estimated nine jobs per million) are
then being spent in the general economy at 17 jobs per
million.
Investment Savings
Phase
Phase Phase
Pre-CEP Implementation 17 9
Multiplier (Jobs/$M) (Average) (Utility)
Based on unit fuel estimates prices generally available,
Post Implementation 17
it is estimated that total energy annual costs are 20
Multiplier (Jobs/$M) (Average)
approximately $300 million. If we assume that a 9%
Net Job Creation Benefit
reduction in these costs can be achieved through the 3 8
(Jobs/$M)
targets of the Community GHG & Energy Action Plan
then we are able to determine that, at today’s energy To achieve the goal of a $27 million reduction in energy
prices, approximately $27 million could remain annually costs will drive an estimated investment of $216 million
in the community as a result of energy conservation and (based on an estimated 8-year simple payback).
the related costs.
Applying the estimated investments and the estimated
energy cost reductions we have a local impact of 648
jobs during the investment phase and 216 person-
years of employment for at least 20 years during the
savings phase.
¹ These multipliers are made available by the American Council for an Energy
Efficient Economy: Fact Sheet How Does Energy Efficiency Create Jobs?. Specific
sector-based multipliers for Saint John are not available. The figures shown are
provided to illustrate order of magnitude and comparisons among economic
sectors.
27ATTRACT MAJOR CORPORATE ACTORS
Aligning energy, climate and economic development policy and strategy can have a very positive impact on attracting
resources and investment to the community. This is strongly reflected in the alignment of the Community GHG &
Energy Action Plan and the Economic Development Plan 2019-2021. Specifically, the recommended Economic
Development priority of taking advantage of two local opportunities in the closed potash mines and the local natural
gas fields.
CONCLUSION
Saint John has demonstrated significant policy and strategy alignment that recognizes the economic development
potential of implementing Community Energy Plans through the community-involved development of both their
Community GHG & Energy Action Plan and the Economic Development Plan 2019-2021.
As Saint John continues to pursue its energy, climate and economic development goals it would likely benefit further
from developing energy efficiency strategies programs for their homes, businesses and institutions that keep energy
dollars in the local economy.
Attracting investment into the community through strong policy and strategy alignment is a key signal to investors
and product and service providers.
Saint John has done an excellent job of understanding their local situation and turning them into very scalable
opportunities that will economically benefit the citizens of Saint John.
28To learn more about QUEST, visit our website: www.questcanada.org or contact us at info@questcanada.org
You can also read