Electricity costs in Indiana: Are they going up or down? - Duke requests 19% rate hike (+$20/month)
←
→
Page content transcription
If your browser does not render page correctly, please read the page content below
Electricity costs in Indiana:
                  Are they going up or down?
               Duke requests 19% rate hike (+$20/month)

Pete Lenzen.    PLNAVY@YAHOO.COM “Duke customer since 1999, retired engineer, part‐time farmer; active in various non‐profits.”
“We will make electricity so cheap that only the rich will
                    burn candles.”
                  Thomas A. Edison

“Electricity generation emits more carbon dioxide in the
United States than does transportation or industry …. ”
                      Ernest Moniz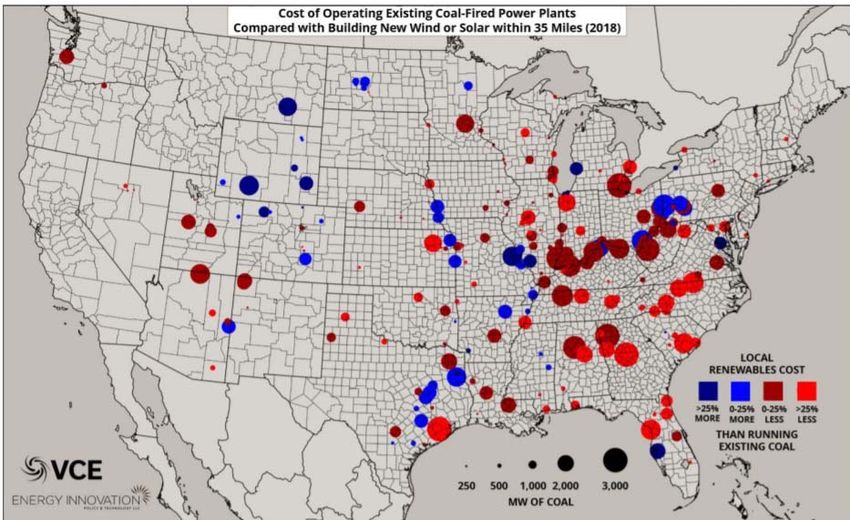
PURPOSE:

Duke has requested a 19% rate increase, which will cause a very
negative impact on lower income rate‐payers.

RUN costs for coal plants are higher than BUILD AND RUN costs
for wind and solar.

Duke should proactively invest in renewables. Many other
utilities, are accelerating the conversion of coal plants to
renewables to SAVE COSTS.

This rate increase should be disapproved.
Energy costs in the world
         Cents per kw‐hr

                           Ovo energy
Who are the players generating electricity?
‐ Public utilities
‐ Rural Electric Cooperatives (non profit)

What are the key issues driving change in this
market?
‐Cost
‐Climate change
Northern Indiana Public Service

                          PUBLIC, INVESTOR OWNED UTILITIES

                          Lobbying group – Indiana
                          Energy Association
                          https://indianaenergy.org/contact/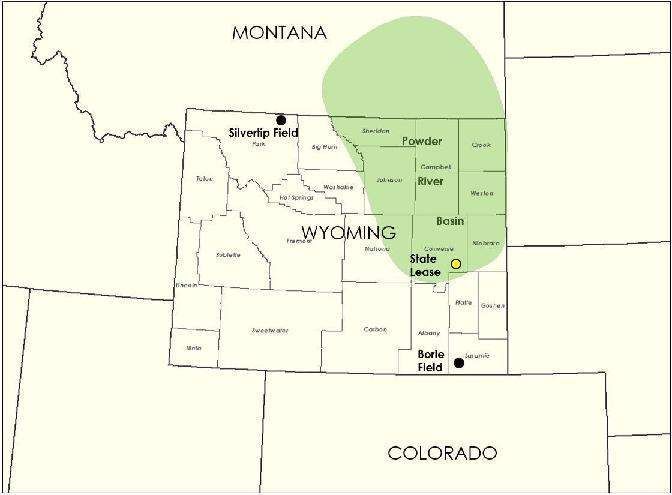
Rural Electric Membership Cooperative (REMC)
‐ Member‐owner of a not‐for‐profit electric utility.

‐ The rates and charges of all Indiana REMCs are regulated at the local level rather than at
the state level.

‐ 38 member cooperatives throughout the state of Indiana.

‐ Each Indiana REMC gets its wholesale power from one of two distribution cooperatives:

** Wabash Valley Power Association (WVPA), which is based in Indianapolis and
serves northern and central Indiana (www.wvpa.com)

** Hoosier Energy, which is based in Bloomington and serves southern and central
Indiana (www.hepn.com)

These are the REMC
territories in Indiana

What are the issues facing all
energy providers?
1. Climate change
‐ Issue has become clouded by political turmoil, driven by lobbyists
and some political leaders

‐ Most citizens and political leaders now believe our country needs
to do something about global warming.

‐ Many states, cities, public and private companies, non‐profits and
homeowners are doing their homework and taking proactive steps.

‐ The utilities have made statements regarding their efforts to
convert to renewables…We will look at the details
2. Energy Cost Containment

‐ Some internal costs are increasing (hardware, infrastructure, admin, etc.)

‐ Locally, Duke Indiana has requested a 19% rate increase to …:

      “…offset the costs of generating cleaner electricity,
      improving the reliability of electric service, and
      making ‘investments to serve a growing customer base’.”

‐ If approved, this increase means additional $20/month, for 1000 kwh usage.

‐ This will disproportionally affect lower income customers.
Let’s look at actual energy production costs…
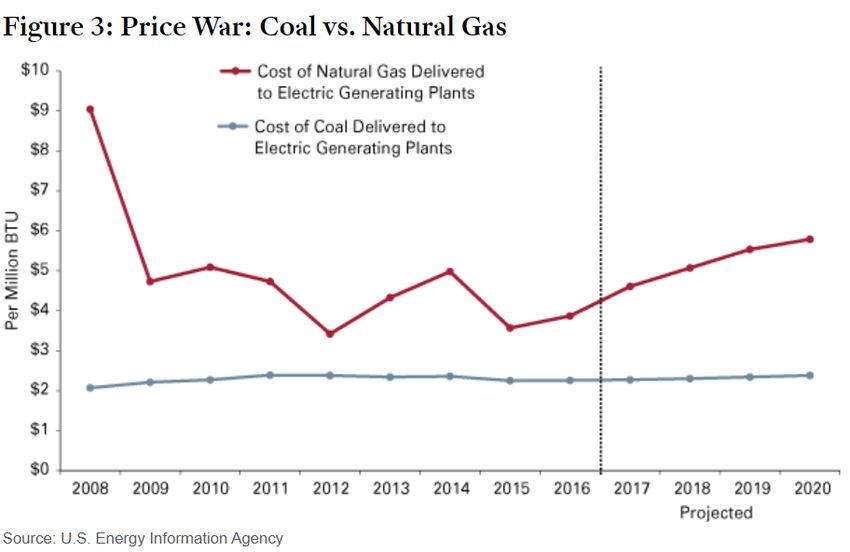
are they going up or down?Natural Gas vs. Coal While the price of natural gas is still
more expensive than coal, the cost of
running a coal plant is more
expensive.
Coal plants are not as nimble as
natural gas and can take significant
amounts of time to turn on and off,
while requiring advanced technologies
to reduce emissions (mercury and air
toxins) and provide energy.
Conversely, natural gas plants require a
significant upfront cost to convert
plants, but are much cheaper to run,
with only steam as a byproduct.
Several years ago, Indianapolis Power & Light’s (IPL) Harding Street Station invested $70
million to convert the plant from coal to natural gas.In recent years, natural gas displaced 1/3 of coal‐generated electricity in Indiana.
What about the cost of using renewables to
generate electricity?

•Wind turbines
•Solar PV
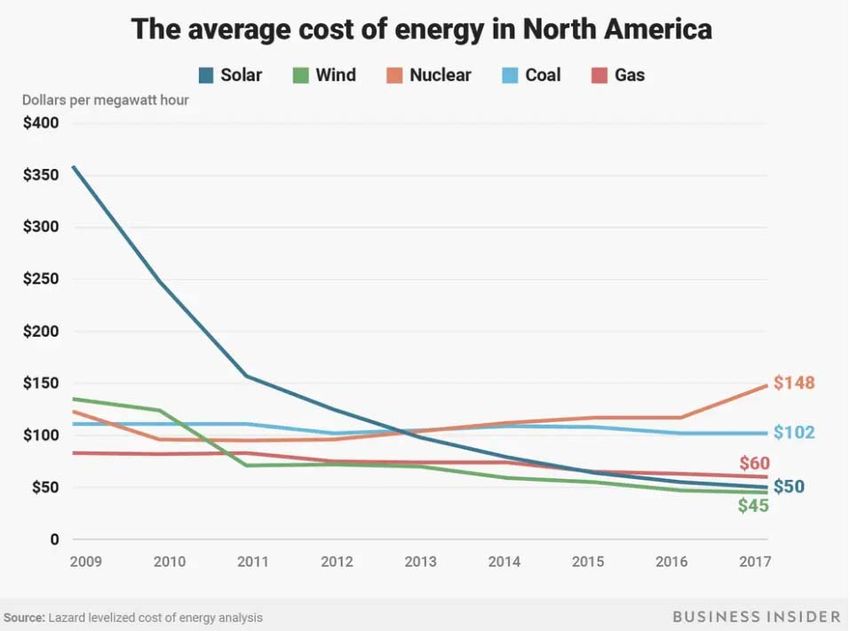
Forbes magazine (December 2018) provided a detailed analysis of
energy generation costs, and states two key points.

1. The price to BUILD new wind and solar has fallen below the cost
of RUNNING EXISTING coal‐fired power plants, and

2. customers save money when utilities replace existing coal with
wind or solar.

https://www.forbes.com/sites/jamesellsmoor/2019/06/15/renewable‐energy‐is‐now‐the‐
cheapest‐option‐even‐without‐subsidies/#71770c345a6b
What is driving this?
Solar panel and wind turbine costs have dropped an extraordinary
88% and 69% since 2009, respectively.

Meanwhile, coal generation costs have decreased by only 9%.

The price TO BUILD new wind and solar generation sources has
fallen below the cost of RUNNING existing coal‐fired power plants.
2018 analysis by Energy Innovation, compared costs of coal, wind and solar, (within
35 miles, which local utility regulators feasibly consider):

Coal generation is at a “cost‐crossroads” in the United States.

Due to the rapid recent cost decline of wind and solar, the combined fuel,
maintenance, and other going‐forward costs of coal‐fired power from many existing
coal plants is now more expensive than the ALL‐IN costs of new wind or solar projects.

In 2018, 74% of electricity produced by coal (211 GW) was more expensive than
wind/solar.

By 2025, even after Federal renewable tax credits phase out, half of the US coal‐
fired capacity (140 GW) will not be able to compete on cost."

https://energyinnovation.org/publication/the‐coal‐cost‐crossover/
Wind, solar are
cheapest.

Extrapolated
2019 data is
similar
INDIANA

< KEY
Examples of utilities
       making business decisions
     based upon this new cost data:

            (coal vs. renewables)

“The price TO BUILD new wind and solar generation
sources has fallen below the cost of RUNNING existing
               coal‐fired power plants.”
Colorado’s Xcel will retire 660 megawatts of coal capacity ahead of schedule in favor of renewable sources and battery storage, and reduce costs in the process. Midwestern utility MidAmerican will be the first utility to reach 100% renewable energy by 2020 without increasing customer rates. Indiana’s NIPSCO will replace 1.8 gigawatts of coal with wind and solar. Why are they doing this? It makes good business sense. It reduces their costs.
From PacificCorp’s Oct 2019 Integrated Resource Plan (IRP) filing:
PacifiCorp review of its 68 plants showed many of its coal‐fired units were more
expensive than cleaner options. The utility delayed its IRP four months to get more data.

New PacificCorp Plan: add 7 GW renewables + storage, close 20 of 24 coal plants

Utah: 3,000 MW solar with 635 MW of battery storage capacity

Wyoming: 1,920 MW of additional wind resources; plus 1,415 MW solar with 354 MW
of battery storage capacity

Oregon: 1,075 MW solar with 244 MW of battery storage capacity

Washington: 814 MW solar with 204 MW of battery storage capacity,

Idaho: 1,100 MW of new wind.
Duke Energy Florida September 2019 news release:

“… plans to reduce Florida rates by more than 3% while adding
more solar power and making grid improvements to enhance
reliability, security and resilience in 2020 and beyond.”

Three Florida solar power plants are nearing completion, early next
year, expected to produce almost 200 MW, enough to power
50,000 homes.

This Duke Florida’s focus on renewables continues with plans to
add 700 MW of cost effective solar through 2022.
In the last two months, Duke has announced solar and wind
projects in Oklahoma, Texas, Georgia and North Carolina, for 1500
MW of power generation.

Duke nationally provides 51,000 MW of power, of which 3000 MW
(6%) are from renewables. “ Dec 2018 from www.sustainabilityreport.duke‐energy.com

This is an important step in addressing it’s large contribution to
global warming, which is now causing erratic weather across the
plains, worse storms, flooding etc.

Now, what is happening in Indiana?
FIRST,

WHAT ARE OTHER PUBLIC UTILITIES
DOING IN INDIANA?
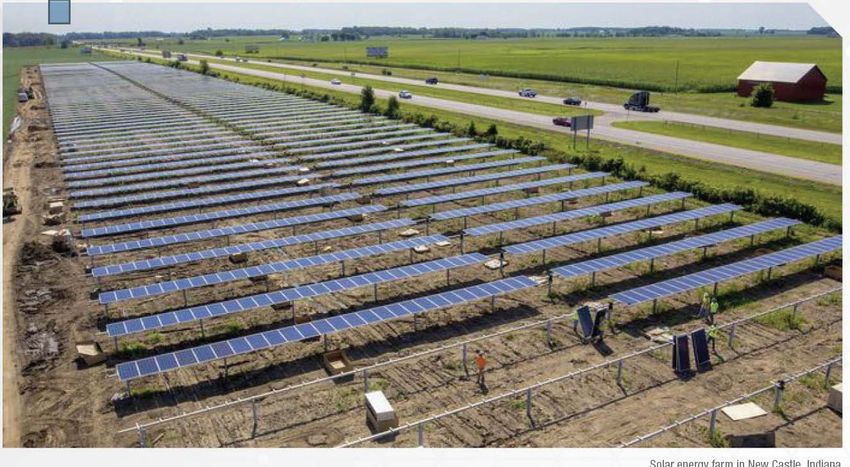
Many solar projects: 2017 – IPL and partners have approximately 97 MW of
solar projects operating or under development.

20MW Indianapolis Airport – reported to be largest solar array in world, associated
with airport. Built 2013‐2015

1.0 MW at Grocer's Supply
9 MW just northeast of the Indianapolis Motor Speedway (IMS) track
2.8 MW at Rexnord Industries
8 MW at Maywood Solar Farm
3.8 MW Citizens Energy project at Belmont Street
1.5 MW at Citizens Energy's 86th Street location

Currently, there are 36 operating solar farms in Indianapolis, which was ranked
fourth in the amount of solar PV per capita of 20 major cities in the 2017 report
published by Environment America Research & Policy Center. Indianapolis is ranked
behind Honolulu, San Diego and San Jose.
March 2019 – building 50MW solar array, $70+ million
investment, on 300 acres. Operational 2020

Also have two 2MW arrays on line, built in conjunction with city
of Evansville

In April 2019, Vectren received approval to retrofit its largest,
most‐efficient coal‐fired generation unit,
F.B. Culley Unit 3 at 270 MW in Warrick County, Indiana,
to ensure it remains in compliance with EPA rules related to coal
ash and waste water handling.
Market analysis indicated they needed to change their focus:

“By retiring costly and aging facilities and adding lower‐cost energy options, we can
generate more than $4 billion in cost savings for customers. The estimated energy
savings will begin to be realized by our customers as soon as 2023.”

“We’ll reduce carbon emissions by more than 90 percent by 2028 as a result of the
current transition plan — while providing continued support for customers who
generate their own electricity from renewable sources, such as wind and solar.”

“This decision to begin a decade‐long transition to a more balanced, more diversified
generation portfolio is driven by economics and firmly grounded in affordability and
reliability for customers. ”
“Results from the RFP showed that for our particular need, renewable energy
sources were lowest‐cost, followed by natural gas‐fired generation. The most
competitive were about half the cost of our current coal fleet.”

“Savings from renewables as compared to natural gas and existing NIPSCO coal units
are largely driven from the difference in lower (i.e. “zero”) fuel costs and operating
and maintenance expenses, as well as influence from the federal production and
investment tax credits.”

Energy mix today                                 2028 Projected energy mix
Coal ‐ 71%                                       Natural Gas ‐ 25%
Natural Gas ‐ 25%                                Renewables ‐ 65%
Renewables ‐ 4%                                  Other ‐ 10%

2020: 3 wind turbine projects operational 802 MW, 290+ turbines
2015 – first solar on line (2.5 MW), 2nd unit 2.6 MW in 2016

2016 – Two additional plants, for total 15 MW

June 2019 – partner with Univ. of Notre Dame, 20MW solar facility, in operation 2020
Hoosier Energy, the consortium of 18 small rural electric Indiana
cooperatives, is actively pursuing a goal of renewables to provide 10%
of their generation capacity by 2025,

First step: ten, 1 MW solar PV arrays, installed 2015‐2017 (each
supply 150 homes).

April 2018 ‐ announced plans for the largest solar array in the state,
200 megawatt Riverstart Solar Park in Randolph County.

Expected to begin operation in 2022, capability of producing enough
clean electricity to power about 37,000 households
Hoosier Energy, the consortium of 18 small rural electric Indiana
cooperatives, is actively pursuing a goal of renewables to provide
 10% of their generation capacity by 2025,

First step: ten, 1 MW solar PV arrays, installed 2015‐2017 (each
supply 150 homes).

April 2018 ‐ announced plans for the largest solar array in the state,
200 megawatt Riverstart Solar Park in Randolph County.

Expected to begin operation in 2022, capability of producing enough
clean electricity to power about 37,000 households
So, What is Duke Indiana doing?
June 6, 2019, press release, Duke Energy Indiana touted its operation
of a 17‐megawatt solar plant at a southern Indiana naval base, along
with the purchase of up to 20 megawatts of solar power from four
solar sites.

It is also rolling out a solar leasing pilot program for business and non‐
profits, limited to 10MW.

These programs are very small (0.5%) when compared to Duke
Indiana’s generation capacity of the ~6,600 megawatts of mainly coal‐
and gas‐fired plants. Duke nationally advertised 6% of capacity being
renewables.

Duke is NOT making significant investments in renewables in Indiana.
Duke Indiana tentatively plans to retire some coal assets early (but not soon).

Cayuga Station, Vermillion County, Ind., 2 coal units to close in 2028, 995 MW.

Gibson Station, 5 coal units, 3100 MW: The 622‐MW Unit 4’s retirement moved up to 2026,
while Units 1 and 2–both 630 MW–will operate until 2038.

Gallagher Station in Floyd County, Units 2, 4, both 140 MW, retire in 2022.

Hamilton County gas‐fired combined cycle plant retires in 2034.

Edwardsport coal‐to‐gas station in Knox County will operate until 2045.

By 2037, Duke plans to replace coal with 1,240 MW of natural gas, 700 MW of wind energy
and 1,650 MW of solar power. Duke could reduce its costs by doing this sooner!

https://www.power‐eng.com/2019/06/24/duke‐indiana‐unit‐will‐keep‐some‐coal‐fired‐capacity‐into‐
2040s/#gref
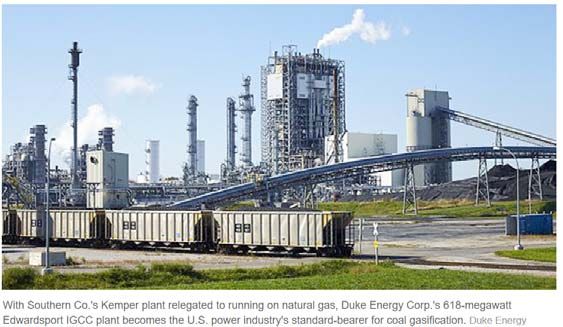
What about the experimental Duke Edwardsport gasification plant?
After a $2 billion cost overrun, it is running a
bit better now.

“…Edwardsport is among the cleaner COAL
plants in the nation in terms of pollutants such
as sulfur dioxide, nitrogen oxides and mercury,
                                                         A Duke Indiana residential
                                                         customer who uses an average of
BUT, it’s among the most expensive, relative             1,065 kilowatt‐hours a month was
to the amount of energy it produces. “                   paying $15.44 for Edwardsport
“https://www.eenews.net/stories/1060057629
                                                         alone, on top of usage costs.
Much of the time, this 660 MW plant runs on purchased, higher cost, natural gas only,
instead of gasified coal.
It has not met the Duke production promises, generally running in the 50‐80% rated capacity,
meaning HIGHER COST PRODUCTION.
HISTORY: In 2011, citing a need to add 600 MW capacity, Duke proposed to build a 618 MW plant that would let Indiana continue to tap its massive coal reserves, thereby spawning jobs and tax revenue. It claimed that new technology would capture CO2 emissions and store them underground or use them for enhanced oil recovery.“ However, this was not supported by testimony from Synapse Energy Economics, a Cambridge, Mass.‐based consulting firm hired by Citizens Action Coalition and others: ‐ Duke’s cost estimate and start‐up date were overly optimistic. ‐ Using a mix of energy efficiency and wind — even natural gas — would be a better deal for ratepayers. ‐ Alternative portfolio of wind and efficiency would save Duke $1.9 billion through 2030. ‐ Carbon capture was abandoned in 2013. ‐ ”The Edwardsport decision is a failure of utility forecasting, of risk analysis and of regulatory scrutiny.” https://www.eenews.net/stories/1060057629
UTILITY LOBBY ACTIVITIES AT THE INDIANA STATE HOUSE
‐ Goal is to influence legislators so legislation benefits the utilities.

 ‐ Relates primarily to the public, Investor Owned Utilities (IOU), and
the lobby group that represents them: Indiana Energy Association

‐ Raises concerns about undue influence on key legislators, which
could negatively impact their constituents.

‐ Utility leaders in Indiana, with the support of some Republican
lawmakers, strategically rebranded net metering from an
"incentive" to a "subsidy."
     https://www.indystar.com/story/news/2017/11/06/solar‐panels‐law‐passed‐lobbyists‐net‐metering/820792001/
UTILITY LOBBY ACTIVITIES AT THE INDIANA STATE HOUSE ‐ Campaign contributions. Since net metering policies in 2011, political action committees representing Indiana’s 5 investor‐owned utilities gave ‐ $1.7 million to state candidates. ‐ Lobbying. From 2014‐2017, utilities spent $2.78 million on lobbying. More than $530,000 was spent in the first reporting period of 2017 alone, which included the 2017 legislative session and the months leading up to it. ‐ Gifts and entertainment. During 2015‐2017, investor‐owned utilities and the organization that represents them spent more than $109,000 entertaining Indiana General Assembly legislators. More than $32,000 was spent entertaining members of the Senate and House committees focused on utility legislation. https://www.indystar.com/story/news/2017/11/06/solar‐panels‐law‐passed‐lobbyists‐net‐metering/820792001/
UTILITY LOBBY ACTIVITIES AT THE INDIANA STATE HOUSE
‐ Rep. VanNatter, on the House Committee on Utilities, Energy and Telecommunications, was
the top recipient of gifts and entertainment furnished by utilities.
‐ During 2015‐2017, he and his family received $8500 worth of meals, Colts games and other
entertainment.
‐ was also was a top recipient of campaign contributions. Since 2011, his campaigns received
about $42,000 from PACs representing Indiana utilities.

Other legislators opposed to existing solar net metering also received big utility contributions:

Sen. Eric Koch, R‐Bedford, and Sen. James Merritt R‐Indianapolis, Chair of Senate Utilities
Committtee, both received more than $34,000 from utility PACs,

Sen. Brandt Hershman, R‐Buck Creek, author of SB 309 and former member of the Senate
Utilities Committee, received at least $61,000.
https://www.indystar.com/story/news/2017/11/06/solar‐panels‐law‐passed‐lobbyists‐net‐metering/820792001/
SUMMARY:
‐ Duke has requested a 19% rate increase. This will cause a
very negative impact on lower income rate‐payers.

‐ RUN costs for coal plants are higher than BUILD AND RUN
costs for wind and solar.

‐ Many other utilities are accelerating the conversion from coal
plants to renewables to REDUCE COSTS.

‐ Duke Indiana is not proactively investing in renewables.

‐ This rate increase should be disapproved.
2019 – Indiana average $0.12 per kwh. Nation wide average $0.13
Chart shows 15% increase in electrical costs over past 10 years.
Duke is requesting 19% increase over next TWO (2) years.
Purdue University prepares
                          “Indiana Electricity
                          Projections” report, every
                          two years, for the IN
                          legislature, IURC.

                          The 2017 report reported
                          2.4% price growth in the
                          past 10 years (2005‐2015)
                          and predicted 1.2% annual
                          price growth over the next
                          20 years.

http://www.purdue.edu/dp/energy/SUFG/
Duke Indiana’s submitted 19% rate increase SHOULD BE DISAPPROVED. Duke Indiana needs to CHANGE DIRECTION, and take more aggressive steps to reduce energy costs by converting to lower cost renewables, instead of raising rates for consumers. Other utilities in Indiana, and Duke in other states, are reducing costs by converting to renewables, and preventing rate increases. Your voice is important! Please provide feedback to the legislature.
Consumers who wish to submit written comments for the case record may do so via the
OUCC’s website at www.in.gov/oucc/2361.htm, by email at uccinfo@oucc.IN.gov,

or by mail at: Consumer Services Staff, Indiana Office of Utility Consumer Counselor,
115 W. Washington St., Suite 1500 South, Indianapolis, IN 46204

The OUCC needs to receive all written consumer comments no later than Oct. 23, 2019 so
that it can:

1) Consider them in preparing its testimony and
2) File them with the Commission to be included in the case’s formal evidentiary record.

Comments should include the consumer’s name, mailing address, and a reference to
either “IURC Cause No. 45253” or Duke Energy. Consumers with questions about
submitting written comments can contact the OUCC’s consumer services staff toll‐free at
1‐888‐441‐2494.
OTHER BACKGROUND SLIDES
Hoosier Energy ‐ a generation and transmission cooperative (G&T)
provides electric power and services to 18 electric distribution cooperatives in Southern
and Central Indiana and Southeastern Illinois.

Hoosier Energy operates the coal‐fired Merom Generating Station, three natural gas
power plants, several renewable energy facilities and a 1,700‐mile transmission network.
Wabash Valley Power Alliance ‐ The Alliance is a not‐for‐profit electric generation
and transmission cooperative. Our members are 23 electric distribution cooperatives
(which makes us sort of a co‐op of co‐ops), in Indiana, Illinois, Missouri
Studies by NOAA, Purdue and many other top level organizations

‐ have shown a clear link between man‐made carbon release from fossil
fuels, and global warming,

‐ with negative effects being seen in coastal areas, erratic weather in the
Midwest (agriculture), with the worst impact on many poorer island nations
CONVERSION FROM COAL TO RENEWABLES
                   NON‐TRIVIAL IMPACT ON COMMUNITIES
 ‐ Closing coal plants (before their scheduled retirement dates) will mean job
losses for many towns. Many times, the mines represent the area’s highest‐
paying jobs, its largest employers, its biggest taxpayers and, in many ways, its
lifeblood.

‐ We need to help these communities with the transition.

‐ We need to review lessons learned from other industry transitions, (e.g., steel)

– Manufacturing has seen great changes in past 20+ years, from new technology,
sensors, engineering materials, and systems approach to product development.

‐ example – use of robots in automotive, battery and electronics manufacturing.
Germany – world leader in conversion to solar
What are they doing about coal plant shutdowns?
‐ Government‐appointed panel in January 2019 recommended
‐ end all coal‐fired power generation no later than 2038, citing the
impact on climate.
‐ The country generates more than a third of its power from coal.
‐ The country’s last deep‐shaft black coal mine closed in December
2018. But open‐cast lignite, or brown coal, mines are still in operation
(dirtier than black coal but cheaper to extract.)Germany – world leader in conversion to solar
What are they doing about coal plant shutdowns?
‐ Aug’19 ‐ approved a plan to spend as much as €40 billion ($44.4 billion) over the
next 20 years on projects designed to lessen the impact of the country’s complete
move away from coal‐fired power generation.
‐ Money available after lawmakers pass legislation to finalize the terms and timing
of Germany’s exit from coal.
‐Funds would be used to support transportation infrastructure and increase
access to broadband communications.
‐ Locating research institutes and federal offices in areas impacted by the
shutdown of coal plants. Some of the money is earmarked for areas with black
coal‐fired power stations. Powermag.com/germanyCOAL VS. RENEWABLES: THIS IS A HUGE BATTLE. Out‐of‐state coal interests are funding a battle to keep Indiana coal plants from closing. The Energy Policy Network, a 501(c)4 nonprofit organization incorporated in Texas in 2015. 2017 IRS Form 990: handful of out‐of‐state coal interests are funding EPN, including Peabody Energy and Cloud Peak Energy, two of the largest coal companies in the United States, and the National Mining Association. Locally, Peabody Energy, Alliance Coal (in 6 states), Sunrise Coal (3 plants western IN) and the Indiana Coal Council, a trade group for coal companies in Indiana, have all attempted to stop IURC from approving clean energy projects.
Wyoming as a whole produces far more coal
than any other state — about 41 percent of
the about 775 million short tons of coal
produced in 2017, according to the U.S.
Energy Information Administration. Indiana
is in the “top 10”, producing 32‐35 M tons

But the WY coal basin, known as the Powder
River Basin (PRB), has been producing less
and less lately. In fact, market sales have
dropped by half between 2001 and 2017.

Meanwhile, coal plant retirements across the   NIPSCO, due to "logistical constraints," does
                                               not burn Indiana coal, sourcing its fuel instead
country are being planned at a rapid pace.     from the PRB.
15,400 megawatts of coal‐fired generation
was retired in 2018, and dozens of units are   Be aware of Intense lobbying activities at the
on track to retire by 2025.                    IN statehouse, IURC, etc.
You can also read