EMPLOYMENT ASSESSMENT OF RENEWABLE ENERGY: Power sector pathways compatible with NDCs and national energy plans
←
→
Page content transcription
If your browser does not render page correctly, please read the page content below
EMPLOYMENT
            ASSESSMENT OF
            RENEWABLE
            ENERGY:
            Power sector pathways
            compatible with NDCs and
            national energy plans

JUNE 2020
Employment assessment of
                                                                                                                                                          renewable energy:
                                                                                                                                                          Power sector pathways
                                                                                                                                                          compatible with NDCs and
                                                                                                                                                          national energy plans
                                                                                                                                                          PARTNERS

PART OF GGGI’S TECHNICAL REPORTS SERIES:

1. Market Assessment of Fuel Pellets and Green Charcoal for Energy Uses in Senegal, Dereje Senshaw, 2017.
2. Policy Recommendations on Energy for Productive Uses in Rural Areas of Senegal, Dereje Senshaw, 2017.
3. GGPA Synthesis Report, Jan Stelter, 2018.
4. Meeting Global Housing Needs with Low-Carbon Materials, Christina Cheong and Donovan Storey, 2019.
5. Green Growth Index Concept, Methodology and Applications, Lilibeth Acosta, et al., 2019.
6. GGPA Methodology Report, Jan Stelter, 2019.
7. G20 Background Paper: Green Growth to Achieve the Paris Agreement, Frank Rijsberman, Orestes Anastasia, Pranab Baruah, Stelios Grafakos,
James Kang, and Dereje Senshaw, 2019.
8. Assessment of Feedback from Regional Expert Consultations on The Green Growth Index (Phase 2), Lilibeth Acosta, et al., 2019
9. Review of GGGI’s experience to design and operationalize national financing vehicles to finance climate and green growth policy
implementation, Fenella Aouane and Frank Rijsberman, 2019.
10. Assessment of complementarities between GGGI’s Green Growth Index and UNEP’s Green Economy Progress Index , Lilibeth Acosta, et al., 2019.
11. Green Growth in Action: Achieving Green Energy Transformation, Dereje Senshaw, Muharrem Askin, Bolormaa Chimednamjil, 2020.
12. Employment Assessment of Renewable Energy: Power Sector Pathways Compatible with NDCs and National Energy Plans , Stelios Grafakos,
Dereje Senshaw, Diana Alejandra Quezada Avila, 2020.

Copyright © 2020

Global Green Growth Institute
Jeongdong Building 19F
21-15 Jeongdong-gil
Jung-gu, Seoul 04518
Republic of Korea

The Global Green Growth Institute does not: (i) make any warranty, either express or implied; or (ii) assumes any legal liability or responsibility for
the accuracy, completeness, or any third party’s use or the results of such use of any information, apparatus, product, or process disclosed of the
information contained herein; or (iii) represents that its use by any third party would not infringe privately owned rights. The views and opinions of
the authors expressed herein do not necessarily state or reflect those of the Global Green Growth Institute.

© GGGI

ii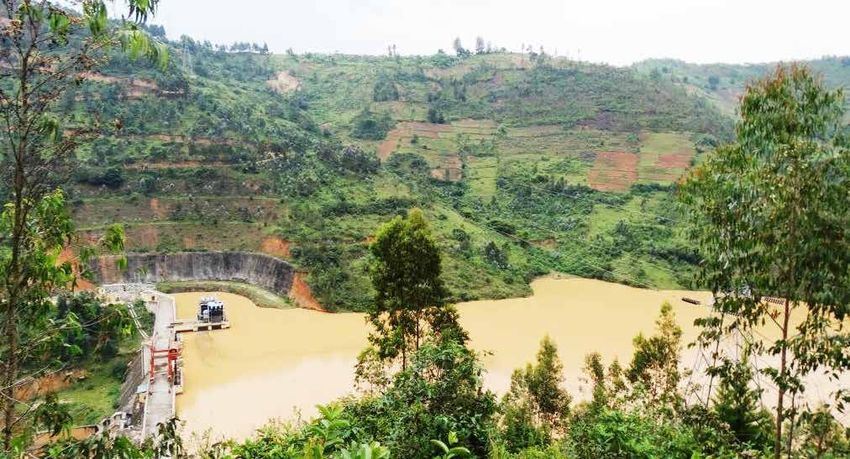
ACKNOWLEDGEMENTS                                                                                                             PREFACE
The Global Green Growth Institute (GGGI) prepared this report as one of the main outputs of the Macro-Economic               I am pleased to introduce this GGGI technical report entitled “Employment Assessment of Renewable Energy:
Analysis (MEA) program. The research team gratefully acknowledges the inputs and support of all experts that contributed     Power Sector Pathways Compatible with NDCs and National Energy Plans”. As economies transit from fossil
to the research during the methodology development, data gathering process, interpretation of the results of the analysis,   fuel-based energy to renewable energy sources, employment is a critical aspect of this transition, as much of the
and review process. The research team extends special thanks to the International Expert Group, partner organizations,       resistance to the green transformation comes from the fear of job losses in the brown economy. As the results of
international research institutes, GGGI Country Offices, consultants, and interns for supporting this research throughout.   our study demonstrate, renewable energy technologies have great potential to create jobs in short and medium-
                                                                                                                             term. This is highly relevant during the post-Covid19 crisis period when countries formulate their economic
Project lead: Dr Stelios Grafakos                                                                                            stimulus packages. This report represents, therefore, an important and timely contribution to the current process
Lead Authors: Dr Stelios Grafakos, Dr Dereje Senshaw, Diana Alejandra Quezada Avila                                          of identifying sectors and projects with high employment creation potential.
Consultants: Andres Toro (International), Emmanuel Sindikubwabo (Rwanda), Jaya Wahono (Indonesia), Jose
Castro – Ithaca Environmental (Mexico)                                                                                       GGGI has prioritized green employment and climate mitigation issues. Reduction of GHG emissions and creation
Intern: Soim Lee                                                                                                             of green jobs are two of GGGI’s six Strategic Outcomes. GGGI has also conducted extensively analytical work in
                                                                                                                             the fields of sustainable energy and green jobs. However, this is the first GGGI study that focuses on the nexus of
GGGI Country Offices                                                                                                         sustainable energy and green jobs.
Dr Kurnya Roesad and Wira Tenaya (Indonesia), Dr Pablo Martinez and Jose Ayala (Mexico), Michelle DeFreese
and Dr Brigitte Nyirambanguste (Rwanda)                                                                                      The current technical report is based on research conducted in three GGGI member countries - Mexico, Indonesia and
                                                                                                                             Rwanda. The study assessed the job creation potential of renewable energy technologies under various power sector
Reviewers within GGGI                                                                                                        pathways based on National Energy Plans and countries’ NDCs. Furthermore, the study identified and assessed the
Dr Frank Rijsberman, Susanne Pedersen, Jan Stelter and Dr Lilibeth Acosta                                                    occupations and skills required by the renewable energy sector for each stage of the value chain. The analysis highlights
                                                                                                                             the important role that assessments of employment effects can play during the revision of countries’ NDCs while
International Experts Group and Partner Organizations                                                                        simultaneously addressing the achievement of Sustainable Development Goals (SDGs) related to affordable and clean
International Organizations                                                                                                  energy (7), decent work and economic growth(8) and climate action(13). Despite the very different energy context and
Dr Marek Harsdorff - International Labour Organization (ILO)                                                                 economic background in Mexico, Indonesia and Rwanda, the renewable energy sector is, according to our analysis, an
Michael Renner and Celia Garcia-Baños - International Renewable Energy Association (IRENA)                                   important driver of employment creation in all of them and its importance is expected to continue to grow.
Dr Nicola Cantore - United Nations Industrial Development Organization (UNIDO)
International Research Institutes                                                                                            Our research team worked in close collaboration with a number of partners, including national renewable energy
Harry Fearnehough - New Climate Institute (NCI)                                                                              agencies in Indonesia, Mexico and Rwanda, as well as other international organisations and research institutes.
Jasper Donker and Xander van Tilburg - Energy Research Centre of The Netherlands (ECN part of TNO)                           At the same time, the study results inform and support policymakers and stakeholders in the three countries
Hector Rodriguez and Dr Helgenberger Sebastian - Institute of Advanced Sustainability Studies (IASS)                         assessed, and beyond. Quantifying the employment effects of investments in renewable energy provides valuable
Prof Shobhakar Dhakal - Asian Institute of Technology (AIT)                                                                  support to countries that are developing their renewable energy strategies and power sector decarbonization
Dr Spyridon Stavropoulos - Erasmus Happiness Economics Research Organization (EHERO)                                         plans. The creation of employment opportunities is an important co-benefit of NDC implementation. Job creation
Dr Ho-Seok Kim - Korean Environment Institute (KEI)                                                                          potential should, therefore, be included and highlighted as countries revise their NDCs in 2020.
Evidence-based and advocacy Organizations
William Brent and Rebekah Shirley - Power for All                                                                            We hope that energy and climate change departments, NDC responsible agencies, planning, environmental and
                                                                                                                             energy ministries, labor organizations, energy companies, project developers, and vocational training institutes and
National Ministries, Institutes and Energy Associations                                                                      universities could benefit from the study outcomes. The GGGI research team aims to continue working with its
Ministry of National Development and Planning (Bappenas), Indonesia                                                          partners and follow up on providing policy recommendations to the governments for incorporating the results in
Indonesia Geothermal Association                                                                                             their revised NDCs and National Energy Plans.
Indonesia Hydropower Association
National Institute of Ecology and Climate Change (INECC), Mexico

Copy editor: Marijke Vermaak                                                                                                                                         Dr. Frank Rijsberman
Design and graphics: Formato Verde                                                                                                                                   GGGI Director-General
Publication Coordinator: Nera Mariz Puyo

Please cite as: Grafakos, S., Senshaw, D., Quezada, D., and Toro A., (2020), Employment Assessment of Renewable
Energy: Power sector pathways compatible with NDCs and National Energy Plans, Global Green Growth Institute, Seoul.

iv                                                                                                                                                                                                                                                  v
EXECUTIVE SUMMARY                                                                                                                                                      under the NDC scenario. Human resources demand and supply are compared in Mexico’s case, showing that there
                                                                                                                                                                       is a surplus of labor in all fields of study4 related to RE for the projection period from 2020 to 2030.

                                                                                                                                                                       For Indonesia, the analysis included two power sector scenarios, namely the Power Supply Business Plan of the
                                                                                                                                                                       State Electricity Company (PLN) and the General Plan of National Electricity (RUKN). The RUKN scenario is more
The development and gradual enhancement of countries’ Nationally Determined Contributions (NDCs) have gained                                                           ambitious in terms of installed RE capacity, reaching 43 GW by 2030, compared to 28.5GW under the PLN scenario.
considerable attention since the 2016 Paris Agreement, ratified by 189 countries to date. Raising the level of ambition                                                Under the RUKN scenario the selected RE technologies such as hydro, geothermal and solar PV, could create about
in the NDCs can lay the foundation for limiting the global temperature rise to well below 2°C or even further to 1.5°C                                                 3.7 million direct jobs, whereas about 2.1 million direct jobs could be created under the PLN scenario. Every direct
to mitigate climate change. Climate mitigation action could generate benefits locally, in addition to the global benefits of                                           job created in the RE sector will create one additional job in the overall economy under both scenarios. Reaching
the GHG emissions reductions and therefore, could be the catalyst for setting more ambitious NDC targets. Reducing                                                     the RUKN scenario RE target by 2030 would require significant investments in RE of about USD 49 billion, while it
GHG emissions by enhancing renewable energy (RE) generation could also contribute to job creation and become a                                                         could generate around USD 24 billion in value-added to the Indonesian economy. According to the skills assessment
driving force of countries’ economic growth. According to the International Energy Agency (IEA), the power sector                                                      for solar PV in Indonesia, more than 120 thousand jobs will be in demand in project development (PD) by 2030.
contributes to 42% of global energy-related CO2 emissions. Simultaneously, RE electricity generation is becoming                                                       Furthermore, 64% of the PD employment will be created for management professionals, while technicians, engineers,
cheaper compared to coal and natural gas1. In this context, it is becoming essential to explore and estimate the RE                                                    and project non-professionals will be in higher demand in the other stages of the solar PV value chain.
employment opportunities of different decarbonization pathways and RE targets under the NDCs.
                                                                                                                                                                       For Rwanda, three scenarios were looked at: NDC unconditional, High Ambition (HA), and Sustainable Energy for All
While the potential for job creation in RE has been assessed at the global level, there is an increasing demand for                                                    (SE4All), whereas the first two scenarios were analyzed in depth as they represent the high and low ambition plans. The
RE employment studies at the national level. This study aims to assess the employment creation potential of RE                                                         NDC unconditional scenario requires a direct investment of USD 295 million on new RE capacity and operations to reach
technologies based on future power sector scenarios for three GGGI Member countries: Mexico, Indonesia, and                                                            its RE target. Under the NDC unconditional scenario, 14 thousand direct job-years and USD 136 million in value added will
Rwanda. Goals of this study include estimating the jobs that can be created by selected RE technologies compared to                                                    be created by 2030. Reaching the RE target under the High Ambition (HA) scenario by 2030 requires a direct investment
selected fossil fuel-based technologies, providing estimates of the required investments for achieving NDC RE targets,                                                 of USD 645 million in RE. The additional 171 MW RE capacity required under the HA scenario will generate around 31
and identifying and assessing the occupations and skills required by the RE sector for each stage of the value chain.                                                  thousand direct jobs. the direct investments in RE under the HA scenario generate around 316 USD million in value-added
                                                                                                                                                                       to the economy of Rwanda. Moreover, it was concluded that more than 75% of the direct job-years generated from solar
The study applied a scenario analysis to investigate the employment implications of RE technologies under                                                              PV technology relate to the technical and non-professional workforce requiring medium to low skill sets. Therefore, less
different power sector scenarios up to 2030. Two scenarios each for Mexico and Indonesia and three scenarios                                                           than 25% of the direct job-years created relate to high skill occupations such as engineers and management professionals.
for Rwanda were investigated for assessing the employment effects of selected RE technologies. In the case of
Mexico, the study compared the employment effects of the Business-as-Usual (BAU) and NDC scenarios, whereas                                                            Overall, all three countries assessed in the study will benefit from investments in RE compared to investments in
in Indonesia and Rwanda the scenarios were not compared with each other as they were developed based on                                                                fossil fuel-based technologies, as RE has greater potential in terms of employment and economic value-added in
different policy documents. The study utilized a RE value chain analysis for assessing the direct jobs that can be                                                     the wider economy beyond the RE sectors. Since the transition to RE involves high skilled occupations and human
potentially created, and Input-Output (I-O) modeling for assessing indirect and induced jobs and value-added                                                           resources, policymakers in each country should consider how to equip their labor force to undertake these tasks
created in the overall economy. The study also analyzed the occupations and skills required at each stage of the                                                       when developing policy measures such as education and vocational training programs.
RE value chain. The labor force supply for RE was estimated and classified by the type of human resource and
skill level using national statistics, particularly in the case of Mexico. Gaps between the supply of and demand for                                                   Considering the benefits of enhancing RE job creation, establishing emission reduction targets for the electricity
occupations and skills were identified based on the estimated local labor force supply at the state level.                                                             sector with RE targets which enable both decarbonization and job creation will be an effective way to facilitate
                                                                                                                                                                       a positive spillover effect. By setting more ambitious goals in their NDCs, countries could create a significant
For Mexico, the results show that installing the additional RE capacity required to reach the 2030 NDC target will                                                     number of quality jobs and economic value-added as co-benefits to reducing GHG emissions, while simultaneously
result in the creation of more than 600 thousand total job-years. Compared to the BAU scenario, this will create                                                       making progress toward multiple Sustainable Development Goals (SDGs).
370 thousand more direct job-years, 170 thousand more indirect, and 110 thousand more induced job-years
between 2020 and 2030. Deploying solar PV distributed generation (DG) is essential to reach the NDC target                                                             In order to harness the employment benefits of RE, low and middle-income countries need to create an enabling
and is expected to generate between 36% and 57% of the total job-years by 2030. The BAU scenario requires                                                              policy environment. Countries in need of financial support can explore smart financing mechanisms. Extending
18 billion USD of direct investment for new RE capacity and operations while reaching the NDC target requires                                                          helping hands from multilateral organizations and international development agencies can reinforce a friendly
an additional 13 billion USD of investment for RE. Direct value-added generated is USD 6 billion higher in the                                                         financing environment for those countries.
NDC scenario than the BAU scenario over the period 2020-2030. Selected RE technologies such as onshore wind,
solar PV DG2 and utility-scale create more direct job-years per TWh from new capacity than combined cycle3                                                             Lastly, future RE employment assessment studies should further investigate geographical and gender aspects.
                                                                                                                                                                       Identifying where RE jobs are likely to be located, assessing and mapping the potential occupations and skills gaps, and
1International Renewable Energy Agency, Renewable Power Generation Costs in 2018, May 2019, https://www.irena.org/publications/2019/May/Renewable-power-
                                                                                                                                                                       collecting good quality and detail disaggregated data will provide insights to design more appropriate policy programs.
generation-costs-in-2018.
2
  Distributed Generation refers to distributed energy generation systems.
3
  Combined cycle refers to the combined cycle gas turbine (CCGT), which is highly efficient electricity generation technology from otherwise lost waste heat exiting
from one or more gas (combustion) turbines.                                                                                                                            4
                                                                                                                                                                           Fields of study refer to Engineering and Construction, Technicians, Natural Sciences, Logistic and Quality Assurance, Management, Finance and Legal, and Health and Safety.

vi                                                                                                                                                                                                                                                                                                                                               vii
TABLE OF CONTENTS
1 INTRODUCTION 1 4.3 Jobs Assessment 36
1.1 Background 1 4.3.1 Variables and data collection 36
4.3.2 Employment effects of RE technologies 36
1.2 Study objectives 2
4.3.3 Employment effects of RE technologies for each power sector scenario 37
4.3.4 Employment effects comparison between RE and fossil fuel technologies 38
2 METHODOLOGY AND CONCEPTUAL FRAMEWORK 4
4.3.5 Economic impacts of each scenario 39
2.1 Methodology 4
4.3.6 Employment effects across the RE value chains 39
2.2 Assumptions, limitations and uncertain variables 10
4.4 Occupations and Skills Assessment 40
4.5 Recommendations 41
3 MEXICO 12 4.5.1 Recommendations to increase employment opportunities in the RE sector 41
3.1 Current Situation 13 4.5.2 Recommendations to improve the quality and availability of human capital, occupations, and skills 43
3.2 Power Sector Scenarios 15
3.2.1 Baseline Scenario (BAU Scenario) 15 5 RWANDA 45
3.2.2 NDC Scenario 15
5.1 Current Situation 45
3.3 Jobs Assessment 17
5.2 Power Sector Scenarios 47
3.3.1 Variables and data collection 17
5.2.1 NDC unconditional Scenario 48
3.3.2 Employment effects of RE technologies 17
5.2.2 Sustainable Energy for All (SE4All-60%) Scenario 48
3.3.3 Employment effects of RE technologies for each power sector scenario 18
5.2.2 High Ambition (HA-66%) Scenario 48
3.3.4 Employment effects comparison between RE and fossil fuel technologies 19
5.3 Jobs Assessment 49
3.3.5 Economic impacts of each scenario 20
5.3.1 Variables and data collection 49
3.3.6 Employment effects across the RE value chains 20
5.3.2 Employment effects of RE technologies 50
3.4 Occupations and Skills Assessment 21 5.3.3 Employment effects of RE technologies for each power sector scenario 50
3.5 Recommendations 25 5.3.4 Employment effects comparison between RE and fossil fuel technologies 51
3.5.1 Recommendations to increase employment opportunities in the RE sector 25 5.3.5 Economic impacts of each scenario 52
3.5.2 Recommendations to improve the quality and availability of human capital, occupations, and skills 27 5.3.6 Employment effects across the RE value chains 52
5.4 Occupations and Skills Assessment 53
4 INDONESIA 31 5.5 Recommendations 54
4.1 Current Situation 32 5.5.1 Recommendations to increase employment opportunities in the RE sector 54
4.2 Power Sector Scenarios 34 5.5.2 Recommendations to improve the quality and availability of human capital, occupations, and skills 55
4.2.1 PNL Scenario 34
4.2.2 RUKN Scenario 34
viii ix
LIST OF FIGURES AND TABLES
                                                                                           Figure 2.1    Methodology                                                                                                        4

                                                                                           Figure 2.2    Steps to estimate direct job-years                                                                                 7

                                                                                           Figure 2.3    Diagrammatic representation of employment effects captured in the study                                            8
6 CONCLUDING REMARKS                                                                  57
                                                                                           Figure 2.4    Methodology of the occupations and skills gap assessment applied in Mexico                                         9
6.1 Enhancing RE Job creation                                                         57
                                                                                           Figure 3.1    Breakdown of Mexico’s energy generation (TWh) in 2018                                                             13
6.2 Strengthening RE targets in NDCs and National Energy Plans                        58
                                                                                           Figure 3.2    Electricity generation (TWh) per technology and share of re per scenario modeled for Mexico                       16
6.3 Mainstreaming employment studies in NDCs, National Energy Plans, and              59
                                                                                           Figure 3.3    Installed capacity per technology per scenario (GW) by 2030 for Mexico                                            16
Official Development Assistance
                                                                                           Figure 3.4    Employment effects per re technology per scenario for Mexico                                                      18
6.4 Boosting RE deployment through an enabling policy environment, financing,         60
and green stimuli                                                                          Figure 3.5    Direct, indirect and induced job creation per type of expenditure for each scenario for Mexico                    18

6.5 Opportunities for future research and improved metrics                            61   Figure 3.6    Direct job creation per unit of electricity generation (GWh) from new capacity under the ndc scenario in Mexico   19

                                                                                           Figure 3.7    Direct job creation per unit of investment (USD million) under the NDC scenario in Mexico                         20

ANNEXES                                                                               63   Figure 3.9    Direct domestic investment for RE per scenario for Mexico                                                         20

Annex 1: Variable tables                                                              63   Figure 3.10   Direct domestic value-added from RE for Mexico                                                                    20

Annex 2: Equations utilized for the assessment of direct, indirect and induced        64   Figure 3.11 Direct job creation for the 2020-2030 period under the NDC scenario per stage of the value chain per                21
                                                                                                       technology for Mexico
job-years
                                                                                           Figure 3.12 Distribution of total direct jobs per type of human capital resource per value chain stage for solar PV             22
Annex 3: Share of investment locally sourced (in-country share)                       66               (utility-scale and distributed generation) under the NDC scenario for Mexico
                                                                                           Figure 3.13 Distribution of total direct jobs per type of human capital resource per value chain stage for onshore wind         22
Annex 4: Cost structure per technology                                                67               under the ndc scenario for Mexico
Annex 5: Sensitivity Analysis                                                         69   Figure 3.14 Percentage of demanded occupations/ skills per technology for 2020-2030 under the NDC scenario                      23
                                                                                                       (number of direct jobs)
Annex 6: Occupations, education fields, and level of skills of each stage of the RE   71
                                                                                           Figure 3.15 National electric system regions’ prospective additional capacity in renewable energies (solar PV and               24
value chain                                                                                            onshore wind) for 2020-2030, and 2018-2019 graduates in re sector careers

Annex 7: Literature review                                                            73   Figure 4.1    Breakdown of Indonesia’s installed capacity (GW) in 2018                                                          32

Annex 8: Background Methodology related information                                   75   Figure 4.2    Breakdown of Indonesia’s installed capacity (%) in 2018                                                           32

Annex 9: Temporal distribution of jobs generation per technology through the          76   Figure 4.3    Installed capacity (GW) and share of re per scenario modeled for Indonesia                                        35
modeling horizon                                                                           Figure 4.4    Installed capacity (GW) by 2030 per scenario modeled for Indonesia                                                35

                                                                                           Figure 4.5    Employment effects (in million job-years) per RE technology per scenario for Indonesia                            36

REFERENCE LIST                                                                        79   Figure 4.6    Direct, indirect, and induced job creation per type of expenditure for each scenario for Indonesia                37

                                                                                           Figure 4.7    Direct job creation per unit of electricity generation (GWh) from new capacity and per unit of investment         38
                                                                                                         (USD million) under the RUKN scenario in Indonesia
                                                                                           Figure 4.9    Direct domestic investment per scenario from RE for Indonesia                                                     39

                                                                                           Figure 4.10 Direct domestic value-added per scenario from RE for Indonesia                                                      39

                                                                                           Figure 4.11 Direct job creation for the 2020-2030 period under the RUKN scenario per technology per value chain                 40
                                                                                                       stage for Indonesia
                                                                                           Figure 4.12 Distribution of total direct jobs per type of human capital resource per value chain stage for solar PV             40
                                                                                                       under the RUKN scenario for indonesia

x                                                                                                                                                                                                                          xi
Figure 5.1 Breakdown of Rwanda’s installed capacity (%) in 2018 46
Figure 5.2 Installed capacity (MW) and share of re per scenario modeled for Rwanda 49
Figure 5.3 Installed capacity (MW) for ndc unconditional and ha scenarios by 2030 for Rwanda 49 LIST OF ABBREVIATIONS
Figure 5.4 Employment effects per RE technology for NDC unconditional and HA scenarios for Rwanda 50
Figure 5.5 Direct job creation per type of expenditure for each scenario for Rwanda 51
AMDEE Mexican Association of Wind Energy LCPDP Least cost power development plan (Rwanda)
Figure 5.6 Direct job creation per unit of electricity generation (GWh) from new capacity and per unit of investment 51
ASOLMEX Mexican Association of Solar Energy MW Megawatt
(USD million) under HA scenario for Rwanda
Figure 5.8 Direct domestic investment for NDC unconditional and HA scenarios for large hydro and solar PV for Rwanda 52 BAU Business-as-Usual MWh Megawatt hour
Figure 5.9 Direct value-added from RE under the NDC unconditional and HA scenarios for Rwanda 52 CAPEX Capital expenditures NDCs Nationally Determined Contributions
Figure 5.10 Direct job creation for the 2020-2030 period under the HA scenario per technology per value chain stage 52 C&I Construction and installation NRE New and renewable energy
for Rwanda
DG Distributed Generation OPEX Operational expenditures
Figure 5.11 Distribution of total direct jobs required per type of occupation in value chains for solar PV under the HA 53
scenario for Rwanda EM&D Equipment manufacturing and distribution O&M Operations and maintenance
Figure 1 Cost structure per technology for Mexico 67
ESSP Energy Sector Strategic Plan (Rwanda) PD Project development
Figure 2 Cost structure per technology for Indonesia 67
FTE Full-time equivalent PLN Power Supply Business Plan of the State
Figure 3 Cost structure per technology for Rwanda 68 Electricity Company (Indonesia)
GHG Greenhouse gas
PRODESEN Programa de Desarrollo del Sistema Eléctrico
Figure 1 RE employment sensitivity analysis for Mexico 69 Nacional
GIZ Deutsche Gesellschaft für Internationale
Figure 2 Direct jobs breakdown by technology by year under NDC unconditional scenario 70 Zusammenarbeit PV Photovoltaic
GW Gigawatt
Figure 3 RE employment sensitivity analysis for Rwanda 70 RE Renewable energy
GWh Gigawatt hour
Figure 1 Direct jobs break down by technology by year under BAU scenario 76 RUKN National Electricity General Plan (Indonesia)
GoR Government of Rwanda
Figure 2 Direct jobs breakdown by technology by year under NDC scenario 76 SDGs Sustainable Development Goals
HA High Ambition (Rwandan scenario)
Figure 3 Direct jobs breakdown by technology by year under PLN scenario 76 SE4All Sustainable Energy for All
IEA International Energy Agency
Figure 4 Direct jobs breakdown by technology by year under RUKN scenario 77 TVET Technical and Vocational Education and Training
ILO International Labor Organization TW Terawatt
Figure 5 Direct jobs breakdown by technology by year under NDC unconditional scenario 77
INECC National Institute of Ecology and Climate TWh Terawatt hour
Figure 6 Direct jobs breakdown by technology by year under HA scenario 77 Change (Mexico)
UNIDO United Nations Industrial Development
Table 3.1 Summary of Mexico’s background information 14 I-O table Input-Output table
Organization
Table 3.2 Scenario comparison of energy generation by 2030 for Mexico 15 I-O modeling Input-Output modeling USD United States Dollar
Table 3.3 Availability of human capital per field of study 23 IRENA International Renewable Energy Agency USDk Thousand United States Dollars
Table 4.1 Summary of Indonesia’s background information 33 LCR Local content requirement
Table 4.2 Scenario comparison of installed capacity by 2030 for Indonesia 34
Table 5.1 Summary of Rwanda’s background information 46
Table 5.2 Scenario comparison of installed capacity by 2030 for Rwanda 47
Table 1 List of occupations of each stage of the value chain stage, education fields, and skills level 71
Table 1 Literature review on renewable energy employment assessment studies 73
Table 1 Example and illustration of methodology steps 1 to 4 for solar PV in Indonesia 75
Table 2 Assumptions for learning factors variable for different energy technologies used in the countries assessed 75
xii xiii
1 INTRODUCTION

                                                    1.1 BACKGROUND

                                                    Under the Paris Agreement, governments have developed their Nationally Determined Contributions (NDCs).
                                                    NDCs are voluntary commitments by countries on GHG emissions reductions based on their priorities, capacity,
                                                    and historical responsibilities, and are essential elements of the Paris Agreement. Under the Agreement, countries
                                                    are expected increase the ambition of their NDCs every five years. The sum of countries’ NDC pledges lay the
                                                    foundation for reducing GHG emissions and limiting global temperature rises to 1.5°C relative to pre-industrial
                                                    levels5, as backed by science. When formulating or revising their NDCs, countries should consider the additional
                                                    benefits that can be generated by taking more ambitious action. Assessing the co-benefits of mitigation actions
                                                    highlights the importance of setting more ambitious NDCs not only for limiting global warming but also for
                                                    delivering multiple socio-economic benefits. Job creation is one of the most compelling climate mitigation co-
                                                    benefits that resonates with policymakers at both the national and local levels. Recent evidence shows that
                                                    climate mitigation action has significant job creation potential and therefore is becoming increasingly relevant and
                                                    important for policymakers6.

                                                    The power sector is one of the main carbon-emitting sectors, with fossil fuels representing the highest share in
                                                    the electricity mix in many countries. According to the IEA, the power sector contributes to 42% of global energy-
                                                    related CO2 emissions7. On the other hand, renewable energy (RE) penetration in the electricity system has been
                                                    increasing globally in recent years as its investment costs have been plummeting8. Electricity from RE is, in many
                                                    cases, cheaper compared to coal and even compared to natural gas. However, in most countries, RE is still far from
                                                    reaching its vast potential. The share of renewables represents only 26% of total electricity generation in 2018.

                                                    Several global studies highlight the opportunities for job creation provided by RE9. The International Renewable
                                                    Energy Agency (IRENA)’s research shows that if the targeted global RE investments in the energy sector were
                                                    met,10 “by 2050, the energy transformation would provide a 2.5% improvement in GDP and a 0.2% increase in
                                                    global employment, compared to business as usual”. The International Labour Organization (ILO)’s flagship 2018
                                                    report, Greening with Jobs, estimates that GHG reduction measures in the energy sector to meet the long-term
                                                    goal of the Paris Agreement, will create around 24 million jobs11. Although the potential for job creation in RE has
                                                    been assessed at the global level, there is a growing need to investigate the employment effects at the national
                                                    level. Despite the importance of RE employment co-benefits, few national-level assessments of employment
                                                    effects of RE capacity targets under the NDCs exist, particularly in low and middle-income countries (see Annex 7).
                                                    It is increasingly relevant to study the employment effects of the energy transition at the national level as more
© Solar Plant Rwamagana. Photo by Vifo Rwanda Ltd
                                                    and more countries commit to carbon neutrality by 2050 and explore pathways to power sector decarbonization.

                                                    5
                                                      IPCC, Global Warming of 1.5°C, 2018, https://www.ipcc.ch/site/assets/uploads/2018/10/SR15_SPM_version_stand_alone_LR.pdf.
                                                    6
                                                      New Climate Economy, Unlocking the Inclusive Growth Story of the 21st Century, 2018, https://newclimateeconomy.report/2018/.
                                                    7
                                                      International Energy Agency, Tracking Power, May 2019, https://www.iea.org/reports/tracking-power-2019.
                                                    8
                                                      International Renewable Energy Agency, Renewable Power Generation Costs in 2018, 2019.
                                                    9
                                                      Jay Rutovitz, Elsa Dominish, and Jenni Downes, Calculating global energy sector jobs: 2015 methodology, (Prepared for Greenpeace International by the Institute for Sustainable
                                                    Futures, University of Technology Sydney, 2015), https://opus.lib.uts.edu.au/bitstream/10453/43718/1/Rutovitzetal2015Calculatingglobalenergysectorjobsmethodology.pdf.
                                                    10
                                                       International Renewable Energy Agency, Global Energy Transformation: A Roadmap to 2050 (2019 Edition), 2019, https://www.irena.org/-/media/Files/IRENA/
                                                    Agency/Publication/2019/Apr/IRENA_Global_Energy_Transformation_2019.pdf.
                                                    11
                                                       International Labour Organization, World Employment Social Outlook 2018: Greening with Jobs, 2018.

xiv                                                                                                                                                                                                                               1
Furthermore, policymakers can gain valuable insights from comparing the employment creation potential of RE with                                                                •   to support and strengthen evidence-based policy frameworks of countries NDC revision and
fossil fuel-based technologies. Lastly, the transition to RE can also lead to losses in certain sectors in certain regions,                                                         implementation concerning power sector RE targets from an employment perspective;
which need to be understood to be addressed and managed in a socially just manner.
                                                                                                                                                                                •   to support countries to incorporate the assessment of the employment generation potential in the
International organizations and research institutes have recently started to respond to the need for assessing the                                                                  development of RE strategies and NDCs; and
potential for RE employment creation at the national level. Two international projects funded by the International
Climate Initiative (IKI), Co-benefits, and Ambition to action, assess the employment impacts of power sector                                                                    •   to identify and assess the occupations and skills required by the RE sector to support and advance the
decarbonization on selected low and middle-income countries. GGGI completed a green jobs employment study                                                                           energy transition.
in Fiji in 201912. GGGI also provides support to its Member and partner countries in enhancing their NDCs. GGGI
has also assessed the RE conditional targets and required investments in the NDCs of GGGI countries, identifying                                                           The study results are intended to inform and support different stakeholders and policymakers in the three
investment needs and the potential for raising the level of ambition on RE13. In this study, GGGI aims to bridge the                                                       countries assessed. Countries’ NDC related agencies, climate change-related and energy departments, planning,
knowledge gap on national level RE employment studies, and to support GGGI countries to identify employment                                                                environmental and energy ministries, labor organizations, energy companies and developers, and vocational
co-benefits of the RE targets set in their NDCs and national energy plans. To avoid duplication and maximize potential                                                     training institutes and universities could benefit from understanding the study outcomes.
synergies with other RE employment assessment initiatives, GGGI formed an international experts group (IEG)
consisting of experts from international organizations such as IRENA, ILO, UNIDO, research-based institutes such as                                                        The geographical scope of the study covers three pilot countries from three different continents: Mexico, Indonesia,
the New Climate Institute, Energy Research Centre of the Netherlands (ECN), Institute of Advanced Sustainability                                                           and Rwanda14. In Mexico and Indonesia, fossil fuels currently dominate the electricity mix, however, their governments
Studies (IASS), Erasmus School of Economics (ESE), and evidence-based policy organizations such as Power for All.                                                          have put forward plans to reduce their share considerably by 2030. There are various future development pathways
The IEG provided technical guidance and advice throughout this study. Lastly, the study benefited from feedback                                                            for the electricity supply systems that would lock the economies of Mexico and Indonesia into or out of different carbon
from the Sustainable Energy and Jobs Platform, initiated by IRENA in January 2020, where GGGI is a core member.                                                            emission levels for the next decades. Policymakers can gain valuable insights by studying the employment implications of
                                                                                                                                                                           these pathways. Mexico has identified RE targets under its NDC, whereas Indonesia has yet to align its NDC and climate
                                                                                                                                                                           policy with its energy plans. Rwanda has a relatively much smaller electricity supply system, with a high percentage of
The study is also particularly pertinent to the discussion and debate on post-COVID19 economic recovery                                                                    hydropower in the electricity mix compared to fossil fuels. However, great potential remains to enhance hydropower and
measures. As countries’ economies enter into recession and unemployment levels increase rapidly, the study                                                                 solar energy penetration and the government is planning to increase their capacity and share over the next ten years.
results shed some light on the employment potential of RE. Evidence on employment potential provides
policymakers with an excellent opportunity to harness the environmental benefits of RE technologies while at the                                                           The study applies a scenario analysis approach to investigate the employment effects of RE technologies under
same time boosting the economy.                                                                                                                                            different power sector scenarios. The power sector scenarios are based on national energy policies and plans of
                                                                                                                                                                           the countries assessed. In the case of Mexico, the study compared the employment effects of the Business-as-
                                                                                                                                                                           Usual (BAU) and NDC scenarios, whereas in Indonesia and Rwanda the scenarios were not compared with each
1.2 STUDY OBJECTIVES                                                                                                                                                       other as they were developed based on different policy documents.

                                                                                                                                                                           The study also provides estimates on the number of jobs that can be created by selected RE technologies per unit
The study assesses the potential for employment generation of new installed capacity of RE in the power sector in three                                                    of electricity generation (TWh) and unit of investment (USD) compared to selected fossil fuel-based technologies.
GGGI countries. The analysis highlights the important role that assessments of employment effects can play during the                                                      The integrated methodology that combines power sector scenario analysis with RE value chain analysis to assess
revision of countries’ NDCs. Quantifying the employment effects of investments in RE could provide significant support to                                                  the direct jobs in the RE sector, and I-O modeling to assess indirect and induced jobs and value-added15 created
countries that are developing their RE strategies and power sector decarbonization plans. Ultimately, the study provides                                                   in the overall economy. Lastly, the study assesses the occupations and skills required to tap the employment
evidence-based policy support to national governments for assessing the employment effects of RE targets in the power                                                      opportunities of the energy transition at the different stages of RE value chains. It is recognized that assessing the
sector during the revision of their NDCs while simultaneously addressing the achievement of Sustainable Development                                                        quality of jobs that can be created in RE is an important issue, however, this is not in the scope of this study.
Goals (SDGs) 7 (affordable and clean energy), 8 (decent work and economic growth) and 13 (climate action).
                                                                                                                                                                           The report is structured as follows: Chapter 2 describes the overall methodological approach, the data collection
The study has the following objectives:                                                                                                                                    and data analysis methods, along with information on the input variables. Chapters 3, 4 and 5 outline the cases and
                                                                                                                                                                           reporting the results for Mexico, Indonesia, and Rwanda respectively. The three country chapters have a common
    •    to identify and assess RE technologies’ potential to generate employment under different future power                                                             structure that consists of five sections. The first section briefly describes the current situation of the electricity supply
         sector pathways;                                                                                                                                                  system and relevant policies, the second section presents the different power sector scenarios, the third section
                                                                                                                                                                           focuses on the results of the jobs assessment, the fourth section presents the results of the occupations and skills
                                                                                                                                                                           assessment, and the last section draws policy recommendations. Chapter 6 presents the conclusions of the study.
12
   GGGI, Fiji Green Jobs Assessment: A Preliminary Study of Green Employment in Fiji, July 2019, https://gggi.org/report/fiji-green-jobs-assessment-a-preliminary-study-
of-green-employment-in-fiji/.                                                                                                                                              14
                                                                                                                                                                             As the electricity systems of the three selected countries are very different in terms of scale, technology mix and RE potential, the study does not aim to draw any
13
   Dereje Azemraw Senshaw and Jeong Won Kim, “Meeting conditional targets in nationally determined contributions of developing countries: Renewable energy                 direct comparisons between them.
targets and required investment of GGGI member and partner countries,” Energy Policy 116, (May 2018): 433–443, https://doi.org/10.1016/j.enpol.2018.02.017.                15 Value-added is the contribution of an industry to the national GDP of the country.

2                                                                                                                                                                                                                                                                                                                                             3
2 METHODOLOGY AND CONCEPTUAL
Further detail on the activities and methods incorporated in the methodological approach follows:
Data collection
FRAMEWORK
Mexico, Indonesia and Rwanda’s NDCs and national energy policies and plans were reviewed, focusing on the
RE targets and shares in the electricity mix by 2030. An extensive desk review to collect data and information on
countries’ NDCs and national electricity plans focused on electricity supply scenarios while looking at RE capacity
targets during the NDC time horizon of 2020 to 2030.
2.1 METHODOLOGY
Selected RE technologies were assessed in each country. RE project developers’ surveys and experts’ interviews were
conducted to collect data on value chains and cost structure in all three countries for the selected RE technologies.
After conducting a comprehensive literature review, detailed in Annex 7, the project team developed the research
methodology. The study utilized different data collection methods, stakeholder engagement processes, and Data on capital expenditures (CAPEX) and operational expenditures (OPEX) were collected from national energy
conducted scenario analysis in the selected countries, looking at different power sector scenarios up to 2030. The sources. CAPEX, OPEX and Levelized Cost of Energy (LCOE)16 information for each technology in each country
overall employment modeling methodology combined two methods: (i) value chain analysis of the different RE are summarized in Annex 4. Data on the share of CAPEX and OPEX invested in the country (in-country or domestic
technologies for direct jobs assessment, and (ii) I-O modeling for assessment of indirect and induced jobs and added share of investment17) were collected from secondary sources for Mexico, interviews and secondary sources for
value creation. The study also analyzed the occupations and skills required for each stage of the RE value chain and, in Indonesia, and interviews for Rwanda.
the case of Mexico, compared requirements with the current supply of skills from universities and vocational training
institutes. In this study, the employment assessments resulted in the estimation of the number of job-years at full- Technology-related data such as load and learning factors were collected from national energy sources. Learning
time equivalent (FTE) that could be generated by the new capacity of RE technologies during the modeling horizon factors indicate how fast the costs of RE technologies decline through the modeling horizon due to learning and
2020 - 2030. The terms “jobs” and “job-years” are hereafter used interchangeably and refer to job-years. improvements in RE deployment. Learning factors for all three countries for all technologies were collected from
secondary national energy sources.
Average annual salaries by economic sector were collected from national statistics. National I-O tables for
DATA COLLECTION STAKEHOLDER ENGAGEMENT
Mexico and Indonesia were obtained from the OECD statistics database18. Given the data availability and quality
Policy Documents Local engagement and ownership
National Statistics Scenario development challenges in Rwanda, particularly concerning annual average salaries and the lack of availability of Input–Output
Experts’ Interviews and Surveys Data validation tables, the study estimates only the direct employment and economic impacts of RE deployment for Rwanda.
Stakeholder Engagement
Power sector scenarios to 2030
The research team engaged with national stakeholders through workshops, interviews, and surveys to validate and
discuss different electricity supply and power sector scenarios and their assumptions formed an essential part of the
MODELING OF EMPLOYMENT EFFECTS study. During these consultations, stakeholders such as government officials and experts from related ministries and
departments and RE associations were able to validate technology and cost data that were collected.
OCCUPATIONS AND RE VALUE CHAIN INPUT – OUTPUT
SKILLS ASSESSMENT ANALYSIS ANALYSIS
Occupations and skills in the Different stages of the RE value chain Input – Output table
Power sector Scenario Development and Analysis
different stages of RE value chain In-country share and labor share of
investments
In close collaboration with government officials from relevant ministries, future power sector pathways were
selected and analyzed under different assumptions. Assumptions included different RE capacity targets according
to countries’ NDCs and national energy policies and plans. In all three countries, the study analyzed existing
Indirect jobs
Skills gap Direct jobs
Induced jobs
scenarios developed by the energy planning departments which have been published in policy and planning
assessement Investments
Added Value documents. In all three countries, at least two scenarios, with different levels of RE capacity shares, were
analyzed. In Mexico’s case, two electricity generation scenarios, BAU and NDC, were compared, where both
meet the country’s energy demand. However, in Indonesia’s case, two power sector scenarios were analyzed with
Figure 2.1 Methodology framework
16
Levelized Cost of Energy (LCOE) is the present value of the price of electricity production over the lifetime of a plant, including construction, operation and
maintenance, and fuel costs.
17
“In-country share” or “domestic share” of investment is the percentage of the investment that is spent in the country.
18
OECD, Input-Output Tables 2018 edition, updated December 2018, https://stats.oecd.org/Index.aspx?DataSetCode=IOTSI4_2018.
4 5different levels of capacity by 2030, as they were developed by different agencies and published in different policy • Step 5: Estimate the direct job-years for new capacity installed for the period of 2020-2030. In order to
documents based on different assumptions. In Rwanda’s case, the study analyzed three power sector scenarios estimate the direct job-years for new capacity installed through the modeling horizon, results were scaled linearly,
that were derived from national energy policy documents. extrapolating into the future and multiplying by the MW of new installed capacity under each power sector scenario.
Modeling of employment effects Figure 2.2 provides a diagrammatic representation of the steps in the methodology.
The employment effects of the different power sector pathways were modeled and assessed by combining a
CAPEX OPEX
bottom-up technology value chain analysis and a top-down macroeconomic analysis based on I-O modeling. The components components
combination of the RE value chain analysis with I-O modeling resulted in the estimation of direct, indirect and (USD/MW) (USD/MW/year)
induced jobs that can be created by investing in a new capacity of RE sectors.
STEP 1 In-country share
Analysis of the different stages of the RE Value Chain (%)
multiplied by
The study analyzed the different stages of the RE value chain according to the ILO classification19, Equipment
In-country investment
Manufacturing and Distribution (EM&D), Project Development (PD), Construction & Installation (C&I), Operation
(USD/MW)
& Maintenance (O&M), Cross-cutting/Enabling Activities and Others. Investment costs (CAPEX and OPEX) of
each technology were broken down into technology cost components such as, in the case of solar PV, module,
STEP 2 Match CAPEX and OPEX components
inverter, racking, installation, etc. Annex 8 provides an example of the solar PV components considered in the study. with economic sectors (I-O table)
The direct job-years were calculated by following a stepwise approach, as illustrated in figure 2.2. and Annex 8.
STEP 3 Labor share
(%)
multiplied by
• Step 1: Identify each component’s share of the CAPEX and OPEX that has been invested in the country
(in-country or domestic share, %). Investment on imports or imported components produced in other Labor investment
countries are not accounted for as they generate employment in the component’s country of production. (USD/MW)
Average annual salary per sector
• Step 2: Match each RE technology component with an economic sector from the Input-Output (I-O) table. The STEP 4
(USD/year)
divided by
objective of this step is to identify the economic sector that corresponds to the different RE technology components.
The I-O tables do not specify RE-related sectors and industries. Therefore, to estimate the employment impacts Direct jobs
in the RE industries we constructed them by associating each RE technology component with the corresponding (per MW/year)
economic sector from the I-O table. For instance, the solar PV components correspond to industries from the I-O
STEP 5 Power sector scenarios up to 2030
table, such as “electrical equipment”, “fabricated metal products”, “construction”, “other business sector services”,
(MW Installed capacity)
“real-estate activities”, etc. By associating all RE technology components with corresponding I-O table sectors we multiplied by
can estimate the jobs that can be created by increased spending in RE technologies. An example of how solar PV Total direct job-years
components are matched with economic sectors from the I-O table is provided in Annex 8.
Figure 2.2 Steps to estimate direct job-years
• Step 3: Identify the part of the investment for each RE technology component that is spent on labor
(labor share, %). This step identifies the level of investment for each component that is spent in the labor
market. In Indonesia and Rwanda, data on labor share were collected mainly from primary sources. In Estimating indirect and induced employment effects
Indonesia, in the case of solar PV, labor share estimates for each technology component associated with The study also utilized an I-O modeling approach to estimate the indirect and induced jobs and added value that
an economic sector were derived from the I-O table. For Mexico, labor share estimates for technology could be created in the overall economy by the required investments in RE.
components associated with an economic sector were derived from the I-O table.
I-O modeling is a macroeconomic analysis method that utilizes I-O tables describing the interdependencies
• Step 4: Estimate the direct job-years per MW installed by dividing the domestic investment on labor between the different sectors/industries in an economy. This method is widely applied to estimate the impacts
per economic sector by the average annual salary in the sector. The best way to approximate the salaries of positive or negative economic shocks, for example from changes in aggregate demand, by analyzing the ripple
related to the RE technology value chain is by looking at the average salary in the associated economic effects of sectoral investments in the overall economy.
sectors. As the average salary in the economic sector might not reflect the exact salary of the workers at the
different stages of the RE technologies value chain, a sensitivity analysis to investigate the impact of 10 % The mathematical equations utilized to estimate direct, indirect and induced job-years during the modeling
changes in the average salary of the economic sectors to the employment was conducted. horizon are provided in Annex 2. Modeling was performed using the Economic Impact Model for Electricity Supply
(EIM‑ES)20 developed by the New Climate Institute.
19
International Labour Organization, Skills and Occupational Needs in Renewable Energy, November 2011, https://www.ilo.org/skills/pubs/WCMS_166823/lang--en/index.htm. New Climate Institute, Economic Impact Model for Electricity Supply v1.0, November 2018, https://newclimate.org/2018/11/30/eim-es-economic-impact-
20
model-for-electricity-supply/.
6 7Overall, the modeling approach estimates the total direct, indirect and induced employment measured in FTE • M = Medium skilled – Technician/ skill craft/ supervisory
job-years, employment per USD invested, per GWh generated, and employment impact disaggregated per stage of • L = Low skilled – semi-skilled and unskilled
the RE value chain. Furthermore, the approach assesses the direct domestic investment, the portion of the energy
technology investment that is spent in the country and the value-added created in the overall economy by the indirect STEP 1 STEP 2
and induced effects of the domestic investment. Figure 2.3 represents the employment effects captured in the study.
Proportion (%) of identified human OPEX
resources (or occupations) for each components
INDUCED stage of the value chain per (USD/ MW/ year)
Jobs created when direct and RE technology
indirect employees spend income in
the economy
Gap of
% of graduates who work human
Estimated number of
in their fields of study
INDIRECT multiplied by
direct jobs per
difference multiplied by % of graduates who resources
technology (for
Jobs in supporting and enter the RE sector
supplying Industries 10 years occupations)
(assessment
period)
DIRECT Demand of human resources Supply of human resources
Jobs created in
RE sectors (for occupations) (for occupations)
Figure 2.3 Diagrammatic
representation of employment
effects captured in the study
Sources
Sources
Human Resources: IRENA (2017) ANUIES Data Base 2019
Skills level: ILO (2011)
Occupations and skills assessment Figure 2.4 Methodology of the occupations and skills gap assessment applied in Mexico
The study estimates the number of jobs by type of human resource as defined by IRENA21 and by skill level as For Mexico, human resources were matched with education/study fields based on ANUIES database28. Then the
defined by the ILO22, disaggregated by RE value chain stages (EM&D, PD, C&I, O&M, Cross-cutting/Enabling
labor force supply was quantified and classified by type of human resource and skill level, using national statistics
Activities and Others) per technology. The study calculates the proportion (%) of identified human resources or
occupations at each stage of development for solar PV and wind technologies by using the human resource factors (i.e. ANUIES database) on the number of graduates and technicians per education/study field and per state,
estimated by IRENA23. Each stage requires occupations categorized broadly as engineers, technicians, management as shown in figure 2.4. Gaps between the supply of and demand for occupations and skills were identified by
professionals, and non-professionals. The ILO24 and IRENA25 provide examples of occupations for each category (see comparing the estimated local supply of labor force at the state level to estimates of occupations required based
also annex 6). For example, “engineers” include software and manufacturing engineers. The broad category “tech- on the future development of RE in different states. Annex 6 presents how different human resources/occupations
nicians” includes technicians that could be chemical laboratory technicians or electrical technicians and factory required for the different stages of the solar PV value chain are associated with different education/study fields.
and construction workers. Representative examples of “management professionals” that require high skill levels
include logistics specialists, procurement professionals, financial analysts, environment and safety experts and land
development advisors. Equipment transporters, truck drivers and logistics operators that require relatively low
skill levels are considered “non-professional” occupations in the RE sector. “Non-professional” jobs are the occupa-
tions that do not require specialized professional knowledge or skills. The study estimates the demand for human
resources or occupations, measured in jobs. For example, if construction and installation account for 1,000 jobs
over 10 years, and 30% of the time that is allocated to solar PV construction and installation is for engineers, it is
estimated that roughly 300 engineers will be needed over the same period.
The study utilizes the ILO26 and IRENA27 (see also annex 6) skill level of occupations coding for solar PV and
onshore wind technologies to identify the skill level per occupation:
• H = High skilled – Professional/ managerial
26
International Labour Organization, Skills and Occupational Needs in Renewable Energy, 2011.
27
International Renewable Energy Agency, Renewable energy benefits: Leveraging local capacity for onshore wind, 2017; International Renewable Energy Agency, 28
ANUIES, Información Estadística de Educación Superior , accessed November 12, 2019, http://www.anuies.mx/informacion-y-servicios/informacion-estadistica-de-
Renewable energy benefits: Leveraging local capacity for solar PV, 2017. educacion-superior/anuario-estadistico-de-educacion-superior.
8 9You can also read