Energy Optimization Using Daylight In Lecture - JMEST
←
→
Page content transcription
If your browser does not render page correctly, please read the page content below
Journal of Multidisciplinary Engineering Science and Technology (JMEST)
 ISSN: 2458-9403
 Vol. 8 Issue 5, May - 2021

 Energy Optimization Using Daylight In Lecture
 Theatres
 1 2
 Oyeleye, M. O. Makanju, T. D.
 Electrical and Electronics Engineering Electrical and Electronics Engineering
 Federal University of Technology Federal University of Technology
 Akure, Nigeria Akure, Nigeria
 mooyeleye@futa.edu.ng Makanjutd@gmail.com

Abstract—This research evaluates effectives of One of the principles of sustainable buildings with low
daylight contributions in the lighting design of lighting cost is to utilize available daylight at all time of the
selected lecture theatres in Federal university of day for lighting. A proper designs of DL design of
Technology, Akure, (FUTA) Nigeria and its cost distributed top lights on either side or on top of building can
implications. Measured data were collected using reduce the electrical lighting consumption [7, 8, 9]. There
measuring tape for dimension of the buildings and is possibility of students in daylight schools to experience
TES 1332A digital lux meters for daylight lux level health benefits of better immunity, growth, and eye- sight
contributions in the buildings under different time comfort [10, 11].
of the day (8:00 am to 6:00pm) using room index Electric lighting energy utilization in buildings is 40 -50%
method to determine the number of measuring of the total energy cost and most of the electrical energy use
points. The Daylight Factor (DLF) was determined in illumination is produced by burning fossil fuels [4, 5].
from window area, building area, materials This fossil fuel source is characterized by higher
reflectance and orientation of the building. Five illumination load consumption thus increases the price and
years’ solar radiations data were obtained from caused negative impacts on the environment [5]. According
Nigerian Meteorological Agency. Using existing to [12], simulation -based and field survey studies from
algorithm, average daylight contribution was various regions of different climates acknowledge that
computed from the data. The DLF and correlation daylighting design approaches can result in energy savings
statistics were evaluated and analyzed for the -30% to 77%. This can be assessed using average daylight
measured and computed daylight contributions. factor. The average daylight factor depends on the size and
The results show that 3-in-1-A building do not area of windows, the light transmittance of the glass, the
requires artificial lighting during the day at all; brightness, colour of the internal surfaces and finishes, and
FBN needs artificial lighting in the evening; and other external obstructions which may restrict the amount
1000 capacity needs artificial lighting in the of day lighting entering the room [6, 13]. It has been
morning and evening. Daylight incorporation in identified by studies that there is a greater dependency on
this work saves 21.6 % to 100% of energy. The non-natural source of light for illumination in most
cost of daylight contribution in the three buildings libraries, classrooms, and office building to operate despite
is largely significant, 1.5 million per year, and 47.1 attendant increase in electricity tariffs which cause an
million naira for 30 years amounting to 51.4% of increase in cost of electricity consumption. This research
the expected lighting charges for a year and 30 therefore evaluates the contribution of daylight in selected
years in this work respectively. A proposed model stand-alone lecture theatres in FUTA. The decrease in cost
with effective control is established in this work. of energy by reducing the number of luminaires has
This saves substantial cost of energy. The resurrected the need for daylight in buildings. It is thus
proposed model should therefore be used in necessary to determine the daylight factor for different
lighting design for lecture theatres in order to buildings and incorporate it in lighting design for lighting
reduce energy consumption. energy cost reduction.
Keywords—(Daylight, Daylight Factor, Artificial 1.1 Light Sources and Cost of Lighting in Buildings
Lighting and Energy) Light sources are sources of light Production which can be
 I. INTRODUCTION divided into natural and artificial sources. However, sources
 of light differ in provision of energy to the charged particles
Daylight (DL) is a treasured natural resource that is useful such as electrons. If the energy comes from heat it is called
in passive solar building design [1]. Appropriate DL design incandescent while it is called luminescent if it is from
saves lighting power energy [2]. Sun is the source of DL chemical or electric energy [14]. Electrical wiring of
that is emitting energy close to 4.5 x 10⁹ years [3]. artificial low voltage lighting (≤ 600V) of a building can
According to [4, 5], the use of daylight energy in last for 30 years [15] while building itself can exist for
illumination of commercial/educational building reduces 60years [16]. The used of daylight for lighting during this
artificial energy demand and greenhouse effects. DL is a period will reduce cost of energy consumption.
contented light source for end users with luminous According to [17], energy savings can be maximized by
variations [6]. utilizing daylight in lighting design for buildings that are

 www.jmest.org
JMESTN42353786 13979

Journal of Multidisciplinary Engineering Science and Technology (JMEST)
 ISSN: 2458-9403
 Vol. 8 Issue 5, May - 2021

mainly occupied during the day such as class rooms, Table 3: Surface reflectance of materials that make up
libraries, offices and halls. According to [18], in 2010 the buildings [Adapted from 24]
building sector accounts for the energy consumption in S/N Surface Reflectance material Values
Table, 1. White paint on plain 0.8
 Ceiling plasterboard
Table 1: Energy consumption by commercial and 1 White paint on Acoustic 0.7
residential buildings [ Adapted from 18]. Tile
 White paint on Non-fines 0.6
S/N Energy accounted for by building sector concrete
 White Paint on 0.8
1. 51% of the global electricity consumption Plasterboard; Tiles
 White Fibre cement brick; 0.4
 2. 32% of global energy consumption in building
 concrete, light grey
 sector
 smooth
 3. 24% of the total energy was consumed by residential
 Wall Brick, common 0.3
 buildings
 2 Concrete, light grey 0.25
 4 8% of the world energy was consumed by
 commercial building cement, rough; brick,
 Red: Timber Panelling,
 light oak, Mahogany
1.2 Daylighting and daylight factor
 Timber Panelling; Dark 0.2
1.2.1 Daylighting Brick; Dark 0.15
[2] defined daylighting as the controlled admission of Black Chalkboard 0.05
natural light into a building to reduce electric lighting and Paper White 0.8
thus saves energy consumption. Daylighting helps to create
a visually stimulating, productive environment for building 3 Floor 0.45
occupants, reduce emission and safes 33.3 % of total and 0.35
building energy costs [19, 20]. Furniture Timber; medium, PVC 0.25
Daylight is a full-spectrum source of light to which human Tiles; Brown, Marbled
vision is adapted. Daylighting has two general benefits Carpet Green
namely improve quality of light in a space and reduction in Timber Dark 0.2
the amount of electrical lighting energy required.
 Tiles; Red, Carpet; Dark 0.1
1.2.2 Daylight factor
 1.3 Room Index
Daylight factor (DLF) is the ratio of the interior illuminance
level of a building to exterior illuminance level. According Room Index is used to consider the room proportions and
to [21], daylight factors depend on availability of natural height of the luminaire above the working plane [25]. It is
light based on latitude of the building site and surrounding also used to determine the minimum number of measuring
conditions of the building, climate, orientation of buildings, position of illumination level of a building as presented in
transmittance of glazing materials of the building, area of Table 4.
window, vertical angle of sky with respect to the building,
the total internal surface area and area weighted average Table 4: Room Index and Minimum Number of
reflectance of all surfaces making up the area. The Measuring Positions [26, 27]
Illuminating Engineering Society (IES) and British S/N Room index value Minimum number of
Research Establishment (BRE) remarks on building with measuring positions
daylight factor is presented in Table 2 [ 22, 23]. The 1 5% Strongly daylight room Daytime electric lighting not needed.
 Five years’ empirical solar radiation data were collected
 from Nigeria metrological agency (NIMET). Measuring
 Tape (Figure 1) and a reliable lux meter (Figure 2)
 previously used on a past research were used for
 dimensional measurements and lux level values
 determination in the buildings respectively.

 www.jmest.org
JMESTN42353786 13980

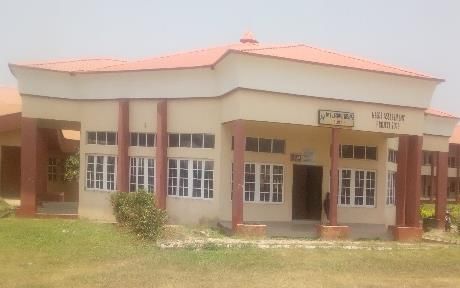
Journal of Multidisciplinary Engineering Science and Technology (JMEST)
 ISSN: 2458-9403
 Vol. 8 Issue 5, May - 2021

 Where HB is height of the building and HS is height of the
 shadow of the building which was determined at
 measurement time of 8:00am, 12:00pm and 5:00Pm.
 iii. Reflectance of the materials
 The percentage of reflectance of the materials, R, that make
 up the building area was determined using Table 3.

 iv Transmittance of the glazing materials
 The transmittance of the window was determined based on
 the nature of the materials used from building catalogue.
 “6” was used to obtained the daylight factor for each of the
 buildings.
Figure 1: Measuring Tape ∑ ∗ ∗ ∗
 = 2 [22, 28] (6)
 (1− )
 Where Aw is Area of the window in (m2) of the building, J
 is transmittance of glazing material of the building, O is
 angle of sun from the building, M is maintenance factor
 (walls, doors, ceilings), A is total internal surface area and
 R2 is area weighted average reflectance of all surfaces
 making up A.

 2. 3 Determination of Daylight Contribution (DLC)

 In order to determine daylight contribution, two methods
 namely lux meter measurement and daylight factor
 computation were used. Lux meter was used to measure the
 daylight contribution in the buildings. Daylight factor was
Figure 2: TES 1332A Lux Meter used to compute the daylight contribution based on the data
 collected.
2.2 Determination of Daylight Factor (DLF)
 2.3.1 Determination of daylight contribution using lux
In order to determine the DLF, the window to wall area meter
ratio, the angle of the building to the sun, the reflectance of
the material that make up the building area and the Room index method was used to determine the measuring
transmittance of the glazing material were determined. points in the building in order to determine the daylight
 i. Determination of window to wall area ratio contribution using lux meter. Lux meter was used to
 (WWAR) measure the lux level at the specific measuring points.
 “7” was used to determine the room index, RI, [24, 25].
In order to determine the DLF “(1)”, “(2)”, “(3)” and “(4)” =

 (7)
were used to compute the windows area, AWD; total wall ( + )
area plus window area, + ; window area, ; and Where L is internal length of the building, W is width, and
window to wall area ratio, (WWAR) respectively. Hm is height.
 = ∑ =1 (1) The number of measuring point corresponds to room index
Where Lw is length of the window, Bw is breadth of the value (Table 4).
window, w is first number of window and n is last number
of the window.
 + = ∑ =1 (2)
Where + is the total wall area including window, i
is the first number of section a building was divided into,
Lis the length of each section, B is the breadth of each
section and n is the last section of the building.
 = + − (3)
Where is the area of wall.
Equation 4 was used to determine window to wall area
ratio, WWAR. Figure 3: 1000 Capacity LT

 WWAR = 100 (4)

 ii. Determination of sun angle
The sun angle in respect to each building was computed
using “(5)”.
 = Tan-1 (HB/Hs) [1] (5)

 www.jmest.org
JMESTN42353786 13981

Journal of Multidisciplinary Engineering Science and Technology (JMEST)
 ISSN: 2458-9403
 Vol. 8 Issue 5, May - 2021

 1 Lux = 0.0092W/M2
 (12)
 The daylight contribution (DLC) was computed using
 “(13)”
 DLC = DLF x (13)
 Where DLF is the daylight factor, VR is the outdoor visible
 radiation
 2. 4 Correlation of Measured and Computed Data

 The correlation between the measured and computed
 available data for five years were evaluated using “(14)”.
 Figure 4: FBN LT ∑( − )( − )
 ( , ) = 2 2
 (14)
 √∑( − ) ∑( − )
 Where DLm is measured daylight, and DLc is computed
 daylight.

 2. 5 Evaluation of Energy Cost Using Daylight

 The number of fittings expected in a building using existing
 standard, lumen per watt method, -Ns, is given in “(15)”.
 ∗
 = [14, 25] (15)
 ∗ ∗
 Where Es is lux level base on the task performed in the
 building, A is area of the building, Uf and Mf are utilization
 and Maintenance factor respectively, L is lamp lumen.
 The total wattage of luminaries (Tw) in the building was
 Figure 5 :3-In-1-A LT computed using “(16)”.
 Tw = N * W (16)
Two different lux meters were used to measure the lux level Where W is wattage of the luminaries and N is number of
of the study area at regular interval during the day. The luminaries
measurements were taken under different condition of the The Cost per hour in the building was computed using
day -morning (8-9 am), afternoon (12-1 pm) and evening “(17)”.
(5-6pm) in the month of August, 2020, due to the usage of Ch = Tw* Tr (17)
the lecture theatres. Where Tr is the tariff rate.
 The cost of electrical lighting energy for 30 years is
2.3.2 Determination of daylight contribution using considered in this works based on electrical wiring system
daylight factor life span [15].

The outdoor illumination level (lux) was determined from 2.6 Optimization Model for Lighting Design with
solar radiation (SR) data obtained using “(8)” to “(10)”. Daylight Factor (OMLDDF)
The energy of the solar radiation (ESR) and outdoor
illumination (Visible radiation) level (EVR) were obtained Required number of lamp with daylight contribution
using “(8)” and “(9)” respectively. The percentage of (NRDC), is optimization model given in “(18)”.
 ( − )
outdoor illumination level ( ) in the solar radiation was = (18)
 ∗ ∗
obtained using “(10)”.
The outdoor illumination level obtained from “(11)”is Where Es is standard lux level base on the task performed
converted to lux using equation “(12)”. in the building, EDLC is lux level contributed by daylight, A
 2 1.44 x 10⁻² . is the area of the building, Uf and Mf are utilization and
 = ∫ 1 3.74 x 10⁻¹⁶ −5 . ( − 1) [29, Maintenance factor respectively and L is the lamp lumen.
 30] (8)
 2 1.44 10−2 2.6.1 Effective Lighting Control System
 = ∫ 1 3.74 10−16 −5 . ( − 1) [29,
30] (9) The number of luminaries Ns will be switched ON during
 darkness or when it is cloudy. In the presence of daylight
 = [29, 30] contribution, the modelled number of required lamp (NRDC)

 (10) will only be switch ON.
Where 1 2 are the wavelength range of the Solar
radiation and 1 2 are the wavelength of the visible
light and T is the temperature of the sun.
The visible radiation is obtained from solar radiation using
equation 11
 = (11)

 www.jmest.org
JMESTN42353786 13982

Journal of Multidisciplinary Engineering Science and Technology (JMEST)
 ISSN: 2458-9403
 Vol. 8 Issue 5, May - 2021

3. Results and Discussions Morning 951 422 713 170 317 60
 Afternoon 3081 837 2054 363 1232 151
3.1 Results Evening 289 658 193 173 96 107

The Results of the research are presented in Figure 6 and Year 2019
Table 5 to 9. TIME DLC DLE DLC DLE DLC DLE
 Morning 756.7 422 568 170 252 60
 35 FBN Afternoon 3202 837 2135 363 1281 151
 Daylight Factor (%)

 30 6 Evening 240.3 658 160 173 80 107
 25
 4 Table 7: Correlation of the experimental value against
 20
 15 computed Data
 15 12 Building/Year 2015 2016 2017 2018 2019
 10 2
 3-in 1-A 0.64 0.65 0.68 0.67 0.72
 5 10 6
 9 FBN 0.95 0.95 0.96 0.96 0.98
 4
 0 1000 Capacity 0.73 0.73 0.76 0.75 0.78
 9:AM 12:30PM 5:00Pm
 Time Table 8: Determination of number of luminaries in
 buildings in the absence of DLC
 No of
 Bul Bul
 Recomm Luminaries
 Build Area b b
Figure 6: Daylight factor of the buildings ended N=
 ings (m2) rati lum
 lux (Es*A)/(Lume
 ng en
Table 5: Room index and corresponding position n*Uf*Mf)
 Buildings Room index Minimum 3-in 301.3 550
 measuring 1-A 7 500 85 0 49
 position 550
 3-in 1-A 7.9 25 FBN 289.5 500 85 0 47
 FBN 7.2 25 550
 1000 422.6 500 85 0 69
 1000 15.7 25
 Capacity

Table 6: Computed daylight (DLC) and experimental
daylight (DLE) contribution
 Buildings
 TIME
 3-in-1-A FBN 1000 Capacity
 Year 2015
 DLC DLE DLC DLE DLC DLE
 Morning 903 422 677 170 301 60
Afternoon 2754 837 1836 363 1102 151
 Evening 204 658 136 173 68 107
 Year 2016
 DLC DLE DLC DLE DLC DLE
 Morning 1016 422 763 170 339 60
Afternoon 3314 837 2209 363 1326 151
 Evening 197 658 131 173 66 107
 Year 2017
 TIME DLC DLE DLC DLE DLC DLE
 Morning 951 422 713 170 317 60
Afternoon 3081 837 2054 363 1232 151
 Evening 289 658 193 173 96 107
Year 2018
 TIME DLC DLE DLC DLE DLC DLE

 www.jmest.org
JMESTN42353786 13983
Journal of Multidisciplinary Engineering Science and Technology (JMEST)
 ISSN: 2458-9403
 Vol. 8 Issue 5, May - 2021

 Table 9: Cost of energy saved by incorporating daylight
 Powe Powe
 r of r of
 requi requi
 red red
 Artifi Artifi
 cial cial % of Power
 Proposed
 lumin lumin of Daylight
 Model
 aries aries Contributio Cost of Net
 [Number of
 PowerW PowerW = (No = (No Cost of n = [(Power Tarif Required Cost of Net Cost
 Required
 ithout ithout of of Daylight of Daylight f Artificial Energy of Energy
 Artificial
 Daylight Daylight requi requi Contribution Contributio Ratin Lighting Per For 30
 Luminaries =
 (W) (kW) red red (N) n)/(Actual g(N) Per Year Year(N Years
 (Es-
 artific artific designed (N) )
 EDLC)*A/(Lume
 ial ial Power
 n*Uf*Mf)]
 lumin lumin )]*100
 aries aries
 x x
 Lamp Lamp
 rating rating
 )W ) kW
202
 0
3in 907,520.96/
 4159 4.16 0 0 0 907,520.96 /yr 100 60.62 0
1-A yr 0
FB 871,776.61/ 570,141
 3995 3.99 31 2613 2.61 301,634.71/yr 34.6 60.62 17,104,25
N yr .91
 7.30
100 1,272,583.0 1,000,2
 5831 5.83 54 4583 4.58 272,332.78/yr 21.4 60.62 30,007,50
 0 6/yr 50.29/
 8.70
 3,051,880.6 1,570,3
 1,481,488.45/yr 47,111,76
 3/yr 92.20
 6.00

 47,111,76
 44,444,653.50 91,556,418. 6.00
 /30yrs 90 /30yrs /30yrs
3.2 Discussions the DLC in 3 in 1-A building do not need artificial lighting
From Figure 6, the results of daylight factor (DLF) varies at all time; FBN building do not need artificial lighting in
from time to time. The DLF for 3 in -1-A building is 12 % afternoon but morning and evening while 1000 capacity
15% and 6 % in morning, afternoon and evening needs artificial lighting in morning afternoon and evening.
respectively. According to IES and BRE recommendations, From Table 8, the number of luminaries needed for the
a building with daylight factor greater than 5% do not need buildings shows that 1000 capacity required the highest
artificial light during the day. This implies that the 3 in 1-A number of luminaries follows by 3 in 1-A and FBN
building do not need artificial lighting during morning buildings respectively. This implies that the building area is
afternoon and evening. The FBN building has a DLF of directly proportional to number of luminaries.
9%, 10% and 4% in the morning, afternoon and evening From Table 9, the percentage of energy saved during the
respectively. The daylight factor is greater than 5% in the day (8am – 6pm) in each of the building shows that 3 in 1-
morning and afternoon period, hence artificial lighting is A building saved energy by 100%, FBN and 1000 Capacity
not needed. However, in the evening when the daylight saved energy by 34.6 % and 21.4 % respectively. For year,
factor is less than 5%, artificial light is needed to 2020 the cost of daylight contribution is 0.91, 0.3 and 0.27
complement the daylight. The daylight factor of 1000 million naira for 3 in 1-A, FBN and 1000 capacity buildings
capacity building varies from 4%, 6% and 2% for morning, respectively. The cost of artificial lighting in the absence of
afternoon and evening respectively. Afternoon daylight daylight is 0.91, 0.87 and 1.27 million naira for 3- in-1,
factor is greater than 5%, artificial light is not required. FBN and 1000 capacity building respectively. The net cost
However, in the morning and evening artificial lighting is of energy per year is zero naira; 0.6 million naira and 1
required for good illumination in the building. million naira for 3 in 1-A, FBN and 1000 capacity buildings
From Table 5, the room index of the buildings varies from respectively. It means that the use of DLC in the lecture
7.2 to 15. 7 which corresponds to 25 minimum measuring theaters saves 1.5 million naira per year. For 30 years,
point used in this research. without variation in the tariff order, the cost of daylight
From Table 6, there are variations in the measured and the contribution alone is 44.4 million naira; the cost of artificial
computed values from time to time. However, Table 7, lighting alone is 91.6 million naira and the net cost of
shows correlation between the two values at all time. the energy is 47.1 million naira for the three lecture theatres in
correlation varies from 0.64 to 0.98. The correlation result consideration. This implies that contribution of daylight
shows that there is close similarity between the measured saves 44.4 million naira; the lighting energy without
and computed data. However, the measured daylight daylight is 91.6 million naira; and cost of energy payable
contribution is preferred in this analysis because it is a for 30yrs is 47.1 million naira in the buildings under
direct physical measurement on site. This implies that with consideration. Thus daylight renewable source of energy

 www.jmest.org
JMESTN42353786 13984
Journal of Multidisciplinary Engineering Science and Technology (JMEST)
 ISSN: 2458-9403
 Vol. 8 Issue 5, May - 2021

can be incorporated in lighting design with control circuit [6] Gwaivangmin, B. (2016). The impact of daylighting in
for the buildings energy optimization. the development of sustainable electric power
 and building infrasructures in Nigeria. Continental
 Journal of Engineering sciences, 2016, Vol, 11,
4. Conclusions No, 2 pp.42 - 52.
The research evaluated the contribution of daylight in 10.5707/cjengsci.2016.11.2.42.52. hal-014259.
lighting design for stand-alone lecture theatres. The
research shows that 3-in-1-A building do not require [7] Motamedi, O. (2012). Energy analysis of top lighting
artificial lighting during the morning afternoon and strategies for office buildings in Austin.
evening, FBN needs artificial lighting in the evening, 1000 (Dissertation). University of Texas, Austin.
capacity needs artificial lighting in the morning and
evening. The three buildings in this study are in alignment [8] Afolami, A., Aluko, O. O. and Adegbie, M. O. (2013).
with existing literature of 5% daylight factor. Buildings Evaluation of daylight levels in an administrative
incorporates daylight in lighting design in this work saves building in Akure, Nigeria. Journal of
21.6 % to 100% of energy. The cost of daylight Environment management and safety Vol 4, No,
contribution in the three buildings per year varies from 0.27 1, Pp. 18-34.
million naira to 0.96 million naira; the DLC in the studied
lecture theatres saves 1.5 million naira per year base on the [9] Buhari, A. A. and Alibaba, H. Z. (2019). Analysis of
present tariff. Daylight quality in Institutional Libraries.
This work established lighting optimization model. Large International journal of electrical and Electronics
significant amount of money is saved in incorporating Research, Vol, 7 No, 4, Pp. 6-20.
established model. This research established that building
that base its evaluation of DLC on 5% recommendation of [10] Mahdavinejad, M, Mohammadi, S. (2016). Parametric
IEC and BRE optimize electrical energy of lighting. Optimization of Daylight and Thermal
The established model of lighting energy optimization, in Performance Through Louvers in Hot and Dry
this research, with effective lighting control should be used Climate of Tehran Journal of Fundamental and
in lighting design for lecture theaters in order to reduce Applied Sciences Vol, 8 No, 3, Pp. 1221-1236.
energy consumption.
 [11] Fasi, M., Budaiwi, I. (2015). Energy performance of
REFERENCES windows in office buildings considering daylight
 integration and visual comfort in hot climates.
[1] Badri, N. M., Kumar, R and Sushant, K.M (2018). Energy Build. Vol, 108, Pp.307–316
 Analysis of Daylighting Using Daylight Factor
 and Luminance for Different Room Scenarios, [12] Dubois, M. C and Blomsterberg, A. (2011). Energy
 International Journal of Civil Engineering and saving potential and strategies for electric
 Technology, Vol, 9, No, 10 Pp. 949–960. lighting in future North European, low energy
 office buildings: A literature review,” Energy
[2] Othman, S. (2017). Post occupancy evaluation of Build., vol. 43, no. 10, pp. 2572–2582.
 daylight in school of environmental science
 prototype buildings, Modibbo Adama university [13] Ander, G. D. (2014). Day lighting. Retrieved May 15,
 of Technology, FUTY, Journal of the 2020, from whole Building Design Guide.
 Environment Vol 11., No, 1, Pp. 41-54.
 [14] Oyeleye, M. (2019). illumination Evaluation of
[3] Mahmoud, O. (2016). Investigation of the daylighting Lecture Theatre, Case Study of 1000 Seat
 and the thermal environment of Nigeria’s low- Lecture Theatre, Federal University of
 income housing: the case of Abuja The thesis Technology, Akure, Nigeria. European Journal
 submitted in partial fulfilment of the of Engineering Research and Science, Vol, 4,
 requirements for the award of the degree of No, 7 Pp. 31-36.
 Doctor of Philosophy of the University of
 Portsmouth School of Architecture, University of [15] NACHI (2021): How long does electrical wiring last
 Portsmouth. in a home www.homeinpectioninsider.com
 assessed on February, 2021. Pg 1.
[4] Ullah, I. (2014). Daylight for Healthy Indoor
 Environment and Energy Benefits. International
 Journal of Ophthalmology & Eye Science” [16] Dias, W. P. S (2013). Factors influencing the service
 (IJOES), 2014. life of building. The institution of Engineers Sri
 Lanka. Vol. 46, Pp 1-7.
[5] Intergovernmental Panel on Climate Change.
 Cambridge University Press, Cambridge, UK, [17] Philips C.D. (2013). Science and Art and Daylighting
 New York, NY, USA, 2013. Bringing Naturalization [online] Accessed 02
 Aug 2014 from
 www.ndri.ir/Sites/Files/261/DayLighting.pdf

 www.jmest.org
JMESTN42353786 13985
Journal of Multidisciplinary Engineering Science and Technology (JMEST)
 ISSN: 2458-9403
 Vol. 8 Issue 5, May - 2021

 [26] Kandar, M. Z; Sulaiman M. S., Rashid, Y. R., Ossen,
[18]Intergovernmental Panel on Climate Change. D. R., Abdullah, A. M., Wah, Y. W and Nikpour,
 Cambridge University Press, Cambridge, UK, M. (2011). Investigating Daylight quality in
 New York, NY, USA, 2014. Malaysian Government office buildings through
 daylight factor and surface luminance.
[19] Ahmed, A.Y. and Jackline A. (2020). Assessment of International Journal of Civil and Environmental
 Daylight Performance of advanced daylight Engineering Vol 5; No 11, Pp. 589-594.
 strategies in large university class room; case
 study at JUST. Alexandria Engineering Journal, [27] Ayoosu M. I., Lim, Y. W. and Leng, P. C (2020).
 Vol, 59, Pp. 791-802. Daylighting performance assessment of side-lit
 university lecture theatres in the hot-humid
[20] Mardaljevic, J.; Andersen, M.; Roy, N.; Christoffersen, climate of Makurdi in Nigeria. International
 J.; Gateway, T.; Enac, E., and Lipid, I. A. journal of recent technology and Engineering
 Daylighting Metrics: Is There a Relation between Vol. 8, No, 5, pp. 4584-4589.
 Useful Daylight Illuminance and Daylight Glare
 Probability? In Proceedings of the Building [28] Shuyang, L. I., Danny H. W. and Wenqiang, C. (2019).
 Simulation and Optimization Conference Estimation of point Daylight Factor (PDF)
 BSO12, Loughborough, UK, 10–11 September Average Daylight Factor (ADF) and Vertical
 2012. Daylight Factor (VDF) under various obstructed
 CIE Standard Skies. International Building
[21] Samani, S. A. (2011). The Influence of light on Performance Simulation Association (IBPSA)
 Student’s learning performance in a learning 16th conference Rome, Italy, Pp. 1177-1182.
 environment. A knowledge internalized
 perspective. World Academy of Science and [29] Gerhard, K. and Nicole, M. (2009). Planck blackbody
 Engineering. radiation law: presentation in different domains
 and determination of the related dimensional
[22] IES (2012). Lighting Measurement 83-12, Approved constants: Journal of the Calcutta mathematical
 method IES Spatial Daylight Autonomy and society Pp. 1-12.
 Annual Sunlight Exposure pg. 1-9.
[23] SHA (2018). BRE Daylight and Sunlight Assessment [30] Sterhov, A. I. and Loshkarev, I. Y. (2019).
 Published by SHA Environmental 105, Adelphi Determination of the proportion of natural light in
 court 1-3 East street Epsom KT 17 1BB. Pg. 3. solar radiation using the method of conversion of
 lighting units into energy. Journal of Physics:
[24] Decrolux (2018). Australian lighting standard: AS/NZ Conference Series 1353 (2019) 012002, Pp. 1-6.
 1680.1: Interior and workplace lighting general IOP Publishing doi:10.1088/1742-
 principles accessed 4th April 2020. 6596/1353/1/012002.

[25] Oyeleye, M. O. and Akanni, S. A. (2019) Evaluation
 of Lux Level Adequacy: Case Study of School of
 Engineering, Federal University of Technology,
 Akure. International Journal of Science and
 Engineering Investigations (IJSEI), Vol 8, No,
 90 Pp. 74-79.

 www.jmest.org
JMESTN42353786 13986
You can also read