Environmental Effects from Wave Power - Artificial Reefs and Incidental No-take Zones - Tethys
←
→
Page content transcription
If your browser does not render page correctly, please read the page content below
Digital Comprehensive Summaries of Uppsala Dissertations
                from the Faculty of Science and Technology 2115

                Environmental Effects from Wave
                Power
                Artificial Reefs and Incidental No-take Zones

                ANKE BENDER

    ACTA
UNIVERSITATIS
 UPSALIENSIS    ISSN 1651-6214
                ISBN 978-91-513-1403-7
  UPPSALA       URN urn:nbn:se:uu:diva-466694
    2022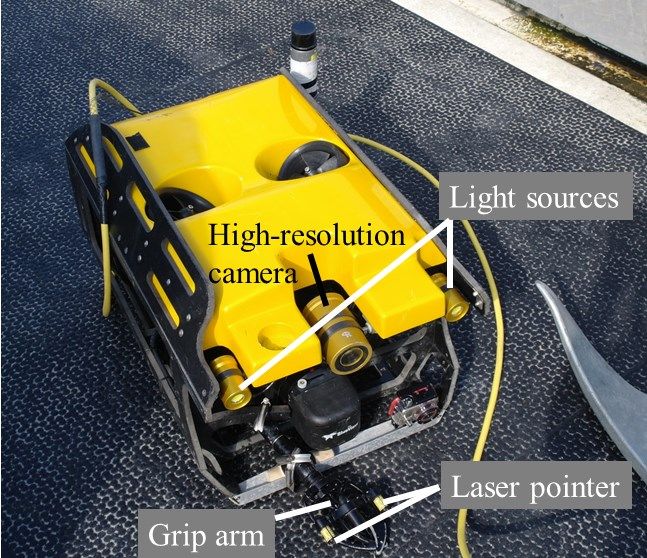
Dissertation presented at Uppsala University to be publicly examined in Polhemsalen,
Ångströmlaboratoriet, Lägerhyddsvägen 1, Uppsala, Thursday, 24 March 2022 at 09:15 for
the degree of Doctor of Philosophy. The examination will be conducted in English. Faculty
examiner: Dr. Louise Kregting (Queen´s University Belfast).

Online defence on Zoom: https://uu-se.zoom.us/j/6628146642

Abstract
Bender, A. 2022. Environmental Effects from Wave Power. Artificial Reefs and Incidental
No-take Zones. Digital Comprehensive Summaries of Uppsala Dissertations from the Faculty
of Science and Technology 2115. 62 pp. Uppsala: Acta Universitatis Upsaliensis. ISBN
978-91-513-1403-7.

Marine renewable technologies have rapidly been developing over the past decade. Wave
power is one of the renewable sources and has the potential securing the renewable electricity
production. However, all renewable energy extraction affects the environment in some way
and for a true sustainable energy generation, environmental effects need to be investigated.
Beside uncertain effects from the technologies to habitats or organisms e.g., collision risks,
electromagnetic fields, noise, past studies have also shown benefits on diversity, size and
abundance of species around marine renewable technologies as a result of habitat creation by
the devices and fishery exclusion in designated offshore park areas.
   This thesis deals with environmental effects from heaving point-absorber wave energy
converters developed at Uppsala University and deployed on the Swedish west coast at the
Lysekil research site and the Sotenäs Project wave power park over a period of four years.
The scope was the investigation of artificial reef effects from wave power foundations on local
mobile, mega and macrofauna during visual inspections using scuba diving on the first hand.
On the second hand, the effects from the incidental no-take zone on decapods and two sea pen
species were investigated applying cage fishing and ROV seabed surveys. A third focus was
on environmental monitoring around MRE sites and monitoring of MRE installations, both in
an experimental and theoretical approach.
   In the Lysekil research site, the results highlight that abundance and diversity can be
enhanced locally around wave power foundations compared to control areas. The
abundance and size of decapods were not significantly different within the wave power park
and up to a distance of 360 m outside of it. In the Sotenäs Project wave power park a positive
effect on Nephrops norvegicus size and burrow density but not on abundance was found on a
scale of up to 1230 m. Sea pen abundance was enhanced inside the wave power park.
However, interannual variation was strong.
   In conclusion, wave power foundations can influence abundance and diversity of marine
organisms around foundations on a very local scale (meters). With the methods in this study,
the investigations did not reveal strong effects on the abundance and size of decapods on a
larger scale up to 1230 m away from foundations as a result of the no-take zone. However, a
focus should be put on a further development of environmental monitoring routines around
MRE sites and their evaluation.

Keywords: Marine renewable energy, Wave power, Environmental monitoring, Artificial reef,
No-take zone, Decapods, Nephrops norvegicus, ROV, Cage fishing

Anke Bender, Department of Electrical Engineering, Electricity, Box 534, Uppsala University,
SE-751 21 Uppsala, Sweden.

© Anke Bender 2022

ISSN 1651-6214
ISBN 978-91-513-1403-7
URN urn:nbn:se:uu:diva-466694 (http://urn.kb.se/resolve?urn=urn:nbn:se:uu:diva-466694)
To Juan and Lucía,
   to my German and my Spanish family.

“It takes as much courage to have tried and failed
           as it does to have tried and succeeded.“

                       −Anne Morrow Lindbergh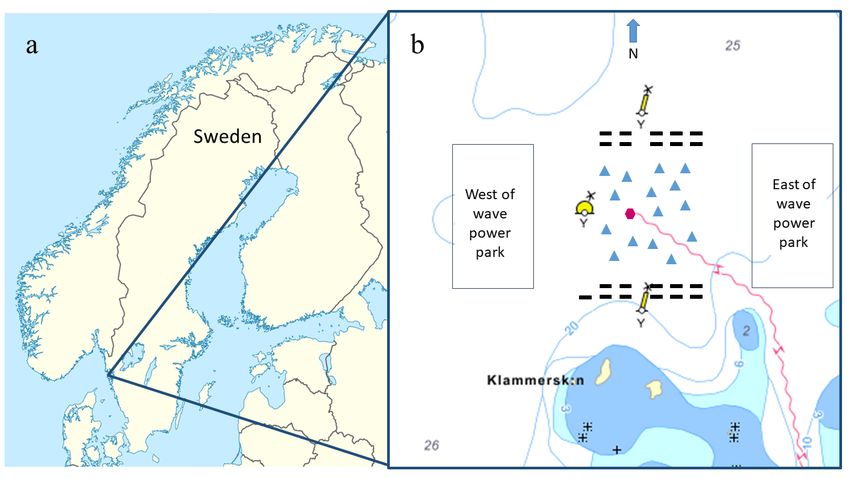
List of Papers

This thesis is based on the following papers, which are referred to in the text
by their Roman numerals.

      I.     Bender, A., Langhamer, O., Sundberg, J. Colonisation of wave
             power foundations by mobile mega- and macrofauna – a 12 year
             study.
             Marine Environmental Research, (2020) 161(105053)
             doi.org/10.1016/j.marenvres.2020.105053

      II.    Bender, A., Langhamer, O., Molis, M., Sundberg, J. Effects of
             a Wave Power Park with No-Take Zone on Decapod Abun-
             dance and Size.
             Journal of Marine Sciences and Engineering, (2021) 9(864);
             doi.org/10.3390/jmse9080864

      III.   Bender, A., Sundberg, J. Effects from wave power generators on
             the distribution of two sea pen species on the Swedish west coast.
             13th European Wave and Tidal Energy Conference Series, EW-
             TEC (2019)

      IV.    Bender, A., Langhamer, O., Molis, M., Sundberg, J. Effects of
             distance from a wave power park with no-take zone on
             Nephrops norvegicus abundance, size, and burrow density.
             In Manuscript

      V.     Bender, A., Sundberg, J., Effects of Wave Energy Generators
             on Nephrops norvegicus.
             4th Asian Wave and Tidal Energy Conference Series, AWTEC
             (2018)

      VI.    Bender, A., Francisco, F., Sundberg J. A review of Monitoring
             Methods and Models for Environmental Monitoring of Marine
             Renewable Energy.
             12th European Wave and Tidal Energy Conference Series, EW-
             TEC (2017)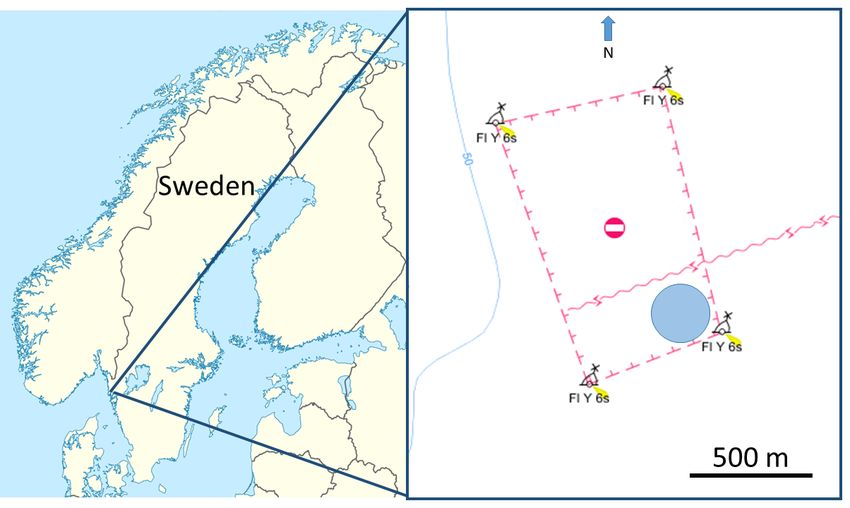
VII. Rémouit, F., Chatzigiannakou M. A., Bender, A., Temiz, I.,
           Sundberg, J., Engström, J. Deployment and Maintenance of
           Wave Energy Converters at the Lysekil Research Site: A Com-
           parative Study on the Use of Divers and Remotely-Operated Ve-
           hicles.
           Journal of Marine Science and Engineering (2018), 6, 39;
           doi:10.3390/jmse6020039

      VIII. Francisco, F., Bender, A., Sundberg, J. Use of Multibeam Im-
            aging Sonar for Observation of Marine Mammals and Fish on a
            Marine Renewable Energy Site.
            Submitted to PLOS ONE

Reprints were made with permission from the respective publishers.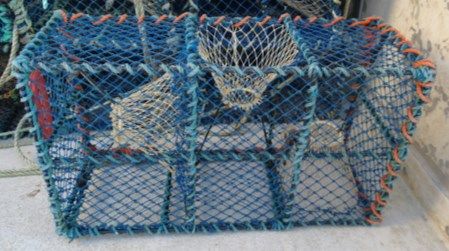
Contents

1.      Introduction ......................................................................................... 11
     1.1 Marine Renewable Energies – Wave power.................................. 11
     1.2 Environmental interactions around offshore renewable energies .. 13
        1.2.1 Artificial reef effects, structural complexity thereof and no-
                take zones............................................................................... 13
        1.2.2 Environmental monitoring and monitoring around offshore
                renewable energy sites and devices ....................................... 15
2.       Aim of the thesis .................................................................................. 17
3.      Study area and methods ....................................................................... 18
     3.1 The Lysekil project − Uppsala University wave power research .. 18
        3.1.1 The Lysekil research site ....................................................... 21
        3.1.2 Environmental studies in the Lysekil project......................... 22
        3.1.3 Study species ......................................................................... 23
        3.1.4 Methods ................................................................................. 23
     3.2 Sotenäs Project wave power park .................................................. 24
        3.2.1 Study species ......................................................................... 25
        3.2.2 Methods ................................................................................. 26
     3.3 Monitoring and environmental monitoring around MRE sites
            and devices .................................................................................... 28
4.      Synthesis of main results and discussion ............................................. 29
     4.1 Artificial reef effect and complexity as a feature to enhance
            abundance ...................................................................................... 29
     4.2 No-take zones / Marine Protected Areas ....................................... 32
        4.2.1 No-take zone − Lysekil research site ..................................... 32
        4.2.2 No-take zone – Sotenäs Project wave power park ................. 34
     4.3 Monitoring around MRE sites and devices ................................... 39
5.       Conclusions ......................................................................................... 42
6.       Limitations & Future work .................................................................. 44
7.       Summary of papers .............................................................................. 45
8.       Swedish summary − Svensk sammanfattning ..................................... 49
9.       German summary − Deutsche Zusammenfassung............................... 51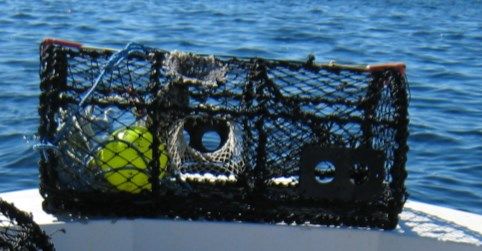
Acknowledgements ....................................................................................... 53
References ..................................................................................................... 55
Abbreviations

Abbreviation    Description
ANOSIM          Analysis of similarities
AUV             Autonomous vehicle
CE              Control east
CW              Control west
H               Holes
IWP             Inside wave park
MPA             Marine protected area
MRE             Marine renewable energy
NH              No holes
OSPAR           Oslo Paris
ROV             Remotely operating vehicle
SDG             Sustainable Development Goal
WEC             Wave energy converter
1. Introduction
The global demand for electricity has risen continuously over time and pre-
dictions call for a further increase in the future [1]. Development of new elec-
tricity consuming technologies, process engineering and industrialization con-
tribute to the rising demand for electricity. At the same time an awareness of
climate change and the need to take action is a widespread topic in society and
politics. There is a loud call for a change towards a sustainable electrical pro-
duction and a generally sustainable development. The United Nations has set
up 17 Sustainable Development Goals (SDG) to be achieved by 2030. Among
those SDG, two are interlinked; focus on sustainable electricity production to
attenuate climate change: Affordable and Clean Energy (Goal 7) and Climate
Action (Goal 13) [2]. Among other aims of the SDG is a substantial increase
in the share of renewable energy in the global energy mix and an enhancement
in international cooperation to facilitate access to clean energy research and
technology, including renewable energy [2]. Furthermore, affordable, scalable
solutions are now available to enable countries to leapfrog to cleaner, more
resilient economies. The pace of change is quickening as more countries are
turning towards renewable energy utilisation and a range of other measures
that will reduce emissions and increase adaptation efforts. The transition from
conventional energy sources towards renewable energies contributes to Goal
7 as well as to Goal 13 [2]. Marine renewable energy (MRE) development,
such as offshore wind, wave and tidal energy, is driven by the need to meet
rising energy demands but also decrease greenhouse gases. Many countries
include the development of MRE projects in their strategy to secure future
energy demands. However, the expansion of MRE can create conflicts, such
as competition for space in an already busy marine environment and environ-
mental compatibility of these relatively new technologies should be secured
including environmental monitoring along the development.
1.1 Marine Renewable Energies – Wave power
Marine renewable energy is harvested from ocean waves, tides, currents,
ocean temperature and salinity gradients. Ocean waves originate from the
asymmetrical irradiation of the sun on the earth’s surface. The result is a var-
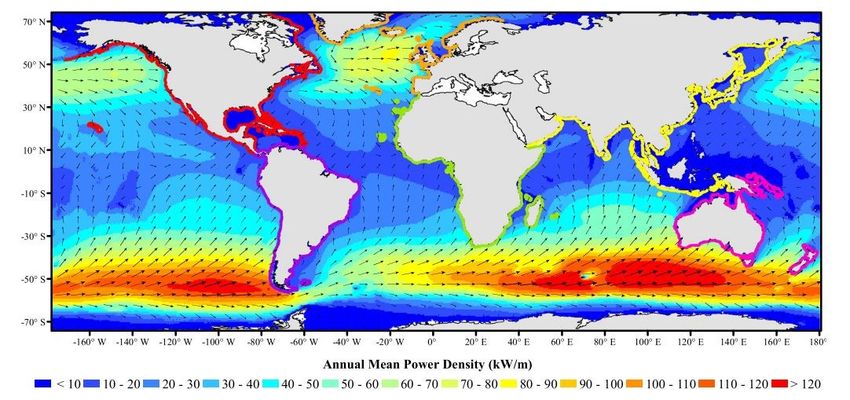
11iation in temperature followed by an atmospheric pressure change which in- duces motion of air masses and wind is thereby created. The wind transfers its energy into the waves blowing over the ocean surface. Ocean waves have the potential to contribute significantly to global electricity production (Figure 1). The global gross resource of energy from the ocean waves has been estimated to be around 3.7 TW [3]. The distribution of waves, and thereby wave energy, is uneven over the world including seasonal variation. This is a common fea- ture of all renewable energy resources. Figure 1. Average annual wave power density (color code) and average annual direc- tion of the power density (vectors) (Source [4]). Since the beginning of modern wave power research in 1970ies (as a reaction to the oil crisis) various types and designs have been developed [5]. Designing a wave energy concept includes several challenges. The structure has to be resistant to the rough conditions of a long-term deployment in the ocean (e.g., hydrodynamical forces, saltwater, scouring, erosion, biofouling, ice for- mation) and different coastal locations with different wave climates may re- quire different types of technologies. Additionally, the system needs to be eco- nomically viable and be suitable to handle the huge changes in power input. It is thus not a big surprise that many designs have not reached the commercial- ization stage or have not even been built or tested in full scale and real condi- tions. However, there remain a substantial number of new wave energy con- verter (WEC) designs under consideration. The developed of this multitude of WEC concepts can be roughly classified into the following groups, based on their working principle: oscillating water column [6], overtopping devices [7], oscillating bodies and wave-activated bodies – e.g. linear generator point ab- sorber at Uppsala University [8–10]. 12
1.2 Environmental interactions around offshore
    renewable energies
The transition from conventional energy sources towards MRE does not auto-
matically guarantees environmental compatibility. Although, MRE supports
climate change mitigation, a true sustainable transition includes extensive, ge-
ographically adapted, monitoring programs and mitigation processes during
all phases of the realization process in order to minimize eventual negative
environmental impacts.
   For a better understanding and assessment of the potential risks, a com-
monly used method is the investigation of the interaction between stressors
and receptors. For MRE, commonly suggested stressors are the marine renew-
able energy device or system itself; this may stress or harm the environment,
even kill the organisms or disturb and destroy their habitats. Elements of the
MREs that may cause these problems include such parts as the moving blades
of a tidal turbine, mooring lines, power cables anchors and foundations [11].
Receptors are organisms, species, individuals, habitats or ecosystem elements
in the area or traversing the area of MRE projects and with the potential to
response to the stressor [12]. The list of potential influences from wave power
devices for the marine environment is long, and threats and impacts may vary
among construction, operational and decommissioning stages [13,14]. Possi-
ble negative impacts may come from habitat loss or degradation, collision risk
or entanglement, noise, visual impacts and electromagnetic fields. However,
past studies could reveal positive environmental effects as a result of appro-
priate siting, design and management [15].
   In the following chapter, this research focuses on two features. One is the
potential of MRE devices to contribute positively to biodiversity, abundance
and size of organisms, as a result of the artificial reef effect from for example
the foundations. Another focus is on the possible beneficial effects on organ-
isms from incidental no-take zones or de facto marine protected areas (MPA)
as a result of the new infrastructure.

1.2.1 Artificial reef effects, structural complexity thereof and
      no-take zones
In this chapter, the focus is on changes in benthic and pelagic habitats caused
by marine renewable energy devices with particular focus on artificial reef
effects and incidental no-take zones.

1.2.1.1 Artificial reef effects and structural complexity
Submerged artificial structures have been reported to attract and concentrate
fishes and invertebrates [16–21]. For centuries, humans have taken advantage
of the behaviour of commercially interesting aquatic organisms, such as fishes

                                                                              13
and lobster, to be attracted to submerged objects and this knowledge was pre- viously used in small-scale artisanal fishing. This phenomenon can be called the artificial reef effect. MRE installations act like artificial reefs and attract mobile organisms like decapods, demersal and pelagic fishes. This effect has been found and measured on wind power devices where fish species aggre- gated around offshore wind turbine foundations [22–28], but also on and around wave power installations [29–31]. By increasing the complexity of the seafloor, the aggregation behaviour can be explained by several reasons such as additional shelter against currents and predators, additional food sources, increased feeding efficiency and provision of nursery and recruitment areas [32]. This can potentially lead to changes in abundance, diversity and size of the local community [29,33–38]. Structural complexity and habitat characteristics are well known to play an important role in community structure [39–41]. The complexity of the struc- ture itself can have an influence as well by modifying a number of ecological processes such as resource availability, recruitment and predation [42]. This knowledge is used in artificial reef designs for conservation purposes and management tools [43]. In the MRE sector, effects of different degrees of complexity have been investigated and differences in abundance were found for mobile species. Wind power foundations with a larger degree of complex- ity such as scour protection on monopiles compared to jacket foundations, showed increased numbers of brown crabs, Cancer pagurus, or cod, Gadus morhua [34]. Similar effects were found in a wave power site for brown crabs, which showed significantly higher abundances on more complex foundations [29,44]. MRE installations are often deployed on soft bottom substratum [11]. As more MREs are deployed the amount of artificial structures increases, and questions on their effect on the biodiversity, abundance and size of organisms rise. Investigations of simple but effective modifications of, for example, foundations could contribute to environmental benefits and even support spe- cific species. Because the construction of MRE will add additional amounts of hard substrate to the marine environment, concerns have been expressed about MRE devices providing a colonization opportunity for non-native spe- cies or function as stepping stones [45]. However, investigations until now do not imply a higher risk for invasions compared to other marine installations such as marinas or coastal protection structures [11]. 1.2.1.2 No-take zones and marine protected areas (MPAs) As a result of the new infrastructure of an MRE site, human activities such as boat traffic or fishing, are often restricted or prohibited in or near such areas. These restrictions can create a de facto marine reserve through the creation of incidental no-take or exclusion zones. This incidental marine reserve can be beneficial for the recovery of the local populations, habitats, vulnerable spe- cies or local fisheries and even support adjacent areas if spill-over occurs [46]. 14
This may be especially true for species inhabiting soft muddy or sandy sedi-
ments, which can benefit from exclusion zones in the form of no-take zones
or MPAs, where destructive demersal fishing like trawling was previously
conducted. The associated sea pen and burrowing megafauna, such as the Nor-
way lobster (Nephrops norvegicus) communities are of key conservation im-
portance as defined under the case report for the Oslo Paris (OSPAR) list of
threatened and / or declining species and habitats and in the Background Doc-
ument for Seapen and Burrowing megafauna communities [47,48].
    Knowledge about the positive effect of no-take zones or areas with re-
stricted activities is used in marine conservation activities and spatial plan-
ning. The strength of protection may vary, with a no-take zone being a strong
level of protection, followed by spatial and temporal exceptions for fishing
and other activities. No universal formula exists for a successful MPA, but
characteristics such as large size, old age, magnitude of enforcement (e.g.,
fishing restrictions) and isolation of the area are shared by many successful
MPAs [49].
    Site section of new MRE projects focuses on suitability for energy extrac-
tion; however, both pelagic species and benthic species can benefit from areas
with restricted activities which were previously exposed to invasive bottom
fishing techniques such as trawling. Although not the main intention, positive
effects on organisms inside MRE sites as results of restricted activities have
been documented and the benefit of a no-take zone has proven to increase size,
biodiversity, body mass and reproductive potential as a direct result of protec-
tion [26,50,59,60,51–58].
    Clearly, the main focus of these structures is the successful harvest of en-
ergy and not the protection of species or habitats. However, in an already busy
marine environment co-location of MPA projects can be a key to reducing
competition for ocean use and conservation needs.

1.2.2 Environmental monitoring and monitoring around
      offshore renewable energy sites and devices
Technological development of MRE devices is progressing rapidly but non-
technological barriers can hinder the development of the wave energy sector
[61]. One of these non-technological barriers is the potential environmental
risk and the uncertainties regarding the potential environmental impacts pro-
duced by MRE farms. As a relatively new technology, MRE devices require
extensive monitoring programs as part of their consenting process. Installa-
tions need to comply with environmental regulations which are often based on
“the precautionary principle,” meaning the prohibition of installations of de-
vices where scientific data do not permit full evaluation of environmental
risks. The remaining uncertainties around the environmental impacts of MRE
devices contribute to the perception by regulators and stakeholders that those

                                                                             15
technologies are risky. The European Marine Strategy Framework Directive (Directive 2008/56/EC) and ecological risk assessments [61], for example, are tools to identify interactions between human activities and pressures to eco- system components. At this stage, there are only a few cases in which a negative impact on organisms from MRE devices has been observed or measured [11,62]. A neg- ative impact indicates here a number of animals negatively affected by a de- vice or system. However, each MRE site and its associated organisms are unique and standardized monitoring techniques barely exist. Research is still needed to achieve a common standardized methodology for ecological risk assessments for MRE projects [28,63,64]. Many questions of environmental effects around this relatively young technology are still up to date and long- term investigations are scarce [62]. The key is to understand how the device may interact with the environment to help define the monitoring needs [65]. 16
2. Aim of the thesis

The central aspect of my thesis deals with environmental effects and impacts
from heaving point-absorber wave energy converters developed at Uppsala
University and deployed at the 1) Lysekil research site and 2) at a second wave
power park, Sotenäs Project wave power park, on the Swedish west coast.
   In the Lysekil research site, the aim was to investigate the long-term artifi-
cial reef effect on mobile mega- and macrofauna by of the ecological founda-
tions (foundations without generator for ecological studies in the Lysekil re-
search site, hereafter also referred to as foundations), including differences
between more complex and non-complex foundations. Evaluation of the ef-
fects of the incidental no-take zone on the abundance and size of the decapod
community on a mid-term scale was another core aspect.
   In the Sotenäs Project wave power park, the aim was to investigate the in-
fluence of the incidental no-take zone on the abundance, size and burrow den-
sity of the economically important and ecologically interesting decapod spe-
cies Nephrops norvegicus and on the abundance of the locally abundant sea
pen species Virgularia mirabilis and Pennatula phosphorea.
   An overarching aspect of my thesis work has been environmental monitor-
ing around MRE sites and monitoring of MRE installations. This was con-
ducted both, in an experimental as well as more theoretical approach. The ex-
perimental execution was realised using a multifunctional environmental
monitoring platform based on sonar systems for ocean energy applications and
the more theoretical approach was implemented in reviewing methods and
models for MRE monitoring and environmental monitoring.

                                                                              17
3. Study area and methods
3.1 The Lysekil project − Uppsala University wave
power research
The Lysekil project was started in 2002 by the Division of Electricity at Upp-
sala University. The main purpose was the development of a robust but effec-
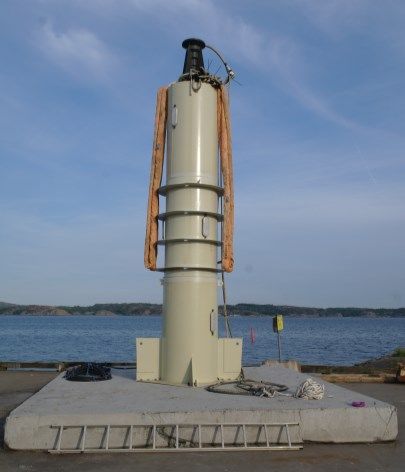
tive and sustainable wave power generator. As a result, a heaving point-ab-
sorber wave power generator was developed (Figure 2). The research com-
prises of different fields such as power systems and generators, hydrodynamic
modelling, and environmental impact of wave energy parks. The concept of
the converter is based on simplicity and consists of only a few moving parts.
The buoy at the sea surface is moved by the motion of the waves and has a
connection via a line to the direct driven linear generator on the seabed. The
absorbed power is transferred to the translator inside the generator where the
motion is converted to electricity with the help of the movement of the trans-
lator relative to the fixed stator. More detailed information about the Lysekil
project can be assessed in [8,66]. During the time period of this study the wave
power generators were not connected to wave buoys, no electricity was gen-
erated and thus the park can be referred to as inoperative during the study
period.
Figure 2. Uppsala University linear Wave Energy Converter (WEC) on foundation,
without buoy, onshore before deployment.
18Previous research at Uppsala University on wave power, conducted from 2006
to date, resulted in the following doctoral theses produced by the wave energy
group of the Division of Electricity:
• Wave Energy Conversion, Linear Synchronous Permanent Magnet
Generator, Oskar Danielsson, 2006
• Electric Energy Conversion Systems: Wave Energy and Hydro-
power, Karin Thorburn, 2006
• Modelling and Experimental Verification of Direct Drive Wave En-
ergy Conversion. Buoy-Generator Dynamics, Mikael Eriksson,
2007
• Energy from Ocean Waves. Full Scale Experimental Verification
of a Wave Energy Converter, Rafael Waters, 2008
• Wave energy conversion and the marine environment: Colonization
patterns and habitat dynamics, Olivia Langhamer, 2009
• Ocean Wave Energy: Underwater Substation System for Wave En-
ergy Converters, Magnus Rahm, 2010
• Electrical systems for wave energy conversion, Cecilia Boström,
2011
• Hydrodynamic Modelling for a Point Absorbing Wave Energy
Converter, Jens Engström, 2011
• Buoy and Generator Interaction with Ocean Waves, Simon
Lindroth, 2011
• Experimental measurement of lateral force in a submerged single
heaving buoy wave energy converter, Andrej Savin, 2012
• Submerged Transmission in Wave Energy Converters: Full Scale
In-Situ Experimental Measurements, Erland Strömstedt, 2012
• Experimental results from the Lysekil wave power research site,
Olle Svensson, 2012
• Full scale applications of permanent magnet electromagnetic en-
ergy converters, Boel Ekergård, 2013
• Offshore marine substation for grid-connection of wave power
farms - An experimental approach, Rickard Ekström, 2014
• Buoy geometry, size and hydrodynamics for power take off device
for point absorber linear wave energy converter, Halvar
Gravråkmo, 2014
• Underwater radiated noise from point absorbing wave energy con-
verters: Noise characteristics and possible environmental effects,
Kalle Haikonen, 2014
• Grid connected three-level converters: studies for wave energy con-
version, Remya Krishna, 2014
• Modelling wave power by equivalent circuit theory, Ling Hai, 2015
19• Grid connection of permanent magnet generator based renewable
energy systems, Senad Apelfröjd, 2016
• Sea Level Compensation System for Wave Energy Converters, Va-
leria Castellucci, 2016
• Numerical Modelling and Mechanical Studies on a Point Absorber
Type Wave Energy Converter, Yue Hong, 2016
• Theoretical and experimental analysis of operational wave energy
converters, Erik Lejerskog, 2016
• Numerical Modelling and Statistical Analysis of Ocean Wave En-
ergy Converters and Wave climates, Wei Li, 2016
• Demagnetization and Fault Simulations of Permanent Magnet Gen-
erators, Stefan Sjökvist, 2016
• Cooling Strategies for Wave Power Conversion Systems, Antoine
Baudoin, 2017
• Multilevel Power Converters with Smart Control for Wave Energy
Conversion, Deepak Elamalayil Soman, 2017
• Automated Production Technologies and Measurement Systems
for Ferrite Magnetized Linear Generators, Tobias Kamf, 2017
• Wave Loads and Peak Forces on Moored Wave Energy Devices in
Tsunamis and Extreme Waves, Linnea Sjökvist, 2017
• Wave Energy Converters: An experimental approach to onshore
testing, deployments and offshore monitoring, Liselotte Ulvgård,
2017
• Modelling and advanced control of fully coupled wave energy con-
verters subject to constraints: the wave-to-wire approach, Liguo
Wang, 2017
• Robotized Production Methods for Special Electric Machines, Erik
Hultman, 2018
• Automation of underwater operations on wave energy converters
using remotely operated vehicles, Flore Rémouit, 2018
• Adapting sonar systems for monitoring ocean technologies, Fran-
cisco Francisco, 2019
• Offshore deployments of marine energy converters, Maria Angeliki
Chatzigiannakou, 2019
• Adaptation of wave power plants to regions with high tides, Mohd
Nasir Ayob, 2019
• Grid Integration and Impact of a Wave Power System, Arvind
Parwal, 2019
• Wave Power for Desalination, Jennifer Leijon, 2020
• Numerical and experimental modelling for wave energy arrays op-
timization, Marianna Giassi, 2020
20• On the System Optimization of Magnetic Circuit with Alternative
Permanent Magnets and its Demagnetization, Jonathan Sjölund,
2021
• In the Air Gap of Linear Generators for Wave Power, Anna Frost,
2021
3.1.1 The Lysekil research site
The Lysekil research site is situated on the west coast of Sweden approxi-
mately 5 NM south of the city of Lysekil. A northern (58° 11’ 850’’ N; 11°
22’ 460’’ E) and a southern (58° 11’ 630’’; N 11° 22’ 460’’ E) navigational
buoy marks the research area to help prevent interference with boat traffic.
The rocky shorelines are covered by algae and the sea floor below the rocky
slopes are soft [67]. The water depth is around 25 m with a tidal range of 0.3
m [68]. Water surface temperatures range between 15–20°C in the summer
months and 0–2°C in winter, and salinity averages 25 ‰ [69]. The wave cli-
mate is considered to be mild with an estimated energy flux of around 5 kW/m
[70].
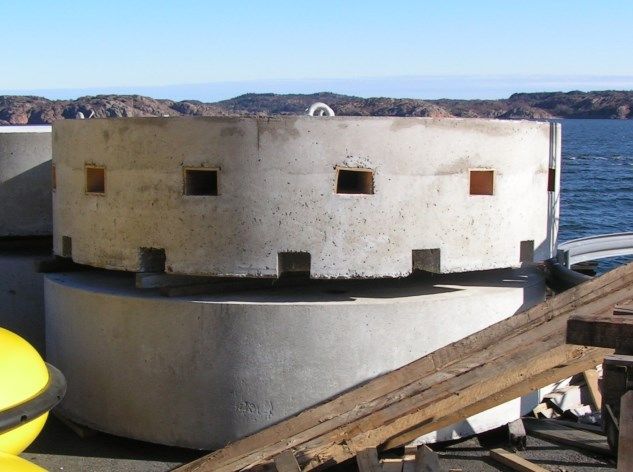
Figure 3. (a) Location of the Lysekil research site on the Swedish west coast. (b) Sea
chart of the wave power park, marked with two yellow rod-shaped sea markings. The
yellow buoy between the two rod-shaped sea markings indicates the position of the
wave-measuring buoy. The red line indicates the position of a sea cable. Blue triangles
mark the position of generators, black rectangles mark ecological foundations, and the
red hexagon indicates the position of the marine substation. Sampling locations east
and west of the wave power park are marked as squares. Numbers indicate water depth
and light-yellow areas represent islands. Note: size and position of symbols are not to
scale.
21In 2006, the first full-scale generator was deployed at the Lysekil research site followed by further generator deployments in the following years [8,66,71]. A total of 21 ecological foundations were deployed at the site in 2007 to con- duct studies on environmental impacts (Figure 3). Each foundation is cylin- drical, ca. 3 m in diameter, 1 m in height and with a weight of 10 tons (Figure 4). Eleven of the 21 foundations are perforated on the lateral side of the cylin- der with 26 rectangular holes measuring 12 cm in width, 15 cm in height and 30 cm in depth (Figure 4). Those reflect the more complex foundations. Half of the holes are situated on the lower edge of the cylinder and the other half are in the upper third. Figure 4. Two ecological foundations for environmental and ecological studies in the Lysekil research site. The upper ecological foundation includes manufactured holes for increased complexity, and the lower foundation resembles a non-complex founda- tion. 3.1.2 Environmental studies in the Lysekil project Environmental studies on possible environmental impacts from the devices on marine organisms were part of the Lysekil project from the beginning to achieve the goal of developing sustainable wave power. For that purpose, ac- companying studies were conducted in relationship with the generator re- search. The focus of past projects included benthic assemblage investigations around the wave power areas, studies of the reef effect from foundations and generators and biofouling assessments on foundations and buoys [72]. In a second project the noise characteristics of the units and its possible effects were studied [73]. The purpose of the third project was the development and use of a sonar system platform for environmental monitoring and monitoring of the MRE device [74]. 22
3.1.3 Study species
In the Lysekil Project, the study focus was on the local mobile fauna associ-
ated with the ecological foundations and in the nearby control areas assessed
visually during scuba diving inspections. Observed species were primarily
decapods, fishes and echinoderms, but polychaetes, bivalves and molluscs
were also sporadically observed. Among the most abundant species were the
brown crab (Cancer pagurus), the cod (Gadus moruha), the spiny starfish
(Marthasterias glacialis) and the common starfish (Asterias rubens) A com-
plete species list can be found in Paper I.
The investigation on the abundance and size of the decapod community in and
around the wave power park was conducted with two cage models (Paper II).
Among the most abundantly caught decapods were the brown crab, the shore
crab (Carcinus maenas) and the sandy swimming crab (Liocarcinus depura-
tor). Other less abundant species were the great spider crab (Hyas araneus),
common hermit crab (Pagurus bernhardus), the hermit crab (Pagurus pu-
bescens), a squat lobster species (Galathea spp.), and the European lobster
(Homarus gammarus).

3.1.4 Methods
During my project, two methods were applied in the Lysekil research site.
During the four study years 2016–2019 the ecological foundations were sam-
pled in July and August using scuba diving for visual inspections on the eco-
logical foundations (Paper I). All mobile fauna associated with the founda-
tions and within 1 m from the foundations were recorded during visual cen-
suses. The same procedure was applied for a nearby control areas in approxi-
mately 10 m distance to the foundations. Species richness, total number of
individuals, Shannon-Wiener biodiversity ‘H’ (H =∑ [(pi) × ln (pi)] (pi =
abundance of a species/total abundance; ln = natural log)) and Pielou’s even-
ness ‘E’ (E = H/HMAX (H = Shannon-Wiener Diversity index; HMAX = the
highest possible diversity for that sample (calculated by ln (richness)) were
calculated for the foundations and controls. Abundances of brown crabs (Can-
cer pagurus) were compared between the complex and the non-complex foun-
dations. Multivariate and univariate analyses were conducted in PRIMER
v.7.0. Other analyses were performed with R (Version 3.5.1, R core team
2018) enabled via RStudio (version 1.1.463, Vienna, Austria) [75].
   During the same time period, cage fishing for decapods was carried out
with two cage models (Figure 5a and b) inside the wave power park, east and
west of it along a gradient up to 360 m away from the foundations (Paper II).
The cages were baited with half a salted herring before their 24 h deployment.
GPS positions of each cage were taken during deployment and the distance to
the closest foundation was calculated. The cages were used to assess and com-
pare the abundance and size of the decapod community in and outside the

                                                                           23
park. All individuals were identified to species, documented and the carapace width of all captured decapods was measured. All individuals were marked with a t-bar anchor to detect possible recaptures. Individuals were returned to respective sampling locations after the procedure. A linear model (R base v 3.5.1, function: “lm”) [75] was used to fit the number of decapods and average carapace width per cage as a function of distance to the closest ecological foundation for both cage types independently, either for each year separately, or combined for all years. All analyses were conducted using statistical soft- ware R (version 3.5.1, Vienna, Austria), enabled via RStudio (version 1.1.463, Vienna, Austria) [75]. a b Figure 5. (a) Small cage type, with two entrances one on each long side (white funnel- shaped net); (b) large cage type, with two entrances, one on each long side (white funnel-shaped net). The yellow surface buoy and line are stored in the left chamber of the cage. 3.2 Sotenäs Project wave power park The Sotenäs Project wave power park is located 5 km offshore the west coast of Sweden, near the municipality of Smögen (Figure 6a). The seafloor at the site is at a depth of around 50 m and the area has a homogenous flat muddy seabed with little relief. Rocky slopes characterize the nearby shore line and the winds and waves come predominantly from the west. The tidal range is ca. 0.3 m [68] and average salinity in the area is approximately 25 ‰ [69]. In 2014 and 2015 a total of 36 gravity-based heaving point-absorber wave power generators were deployed at the site in a circular arrangement in the south eastern corner of the designated park area (Figure 6b) [76]. During the years of the study, 2016−2020, no buoys were connected to the linear generators, thus the wave power park can be referred to as inoperative during the study period. 24
a b
Figure 6. (a) Location of the Sotenäs Project wave power park on the Swedish west
coast; (b) Sea chart of the wave power site, marked with four yellow sea marking
buoys. Blue circle inside the wave power park indicates the location of the 36 circular
arranged gravity based linear generators. The sea cable is represented as the red waved
line Note: size and position of symbol are not to scale.
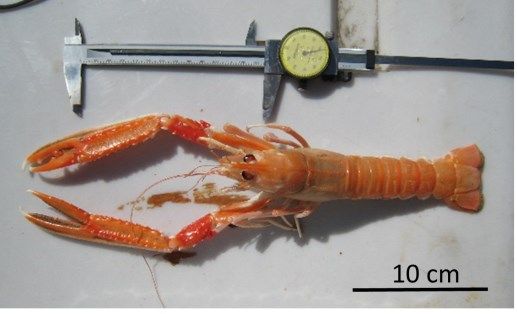
3.2.1 Study species
In the Sotenäs Project wave power park, the study focus was on the economi-
cally and ecologically important Norway lobster, N. norvegicus (Figure 7) and
on two species of sea pens Pennatula phosphorea and Virgularia mirabilis
(Figure 8). All three species are burrowing megafauna inhabiting soft muddy
or sandy habitat which is considered of key conservation importance by the
OSPAR convention [47,48].
N. norvegicus belongs to the family of Nephropide, occurs at a depth between
20−800 m and requites a specific sediment composition of clay and silt to
excavate its burrows (Figure 8). The Norway lobster is territorial and does not
migrate far from its burrow after settlement. This behavior can be taken ad-
vantage of for investigations on abundances among different areas.
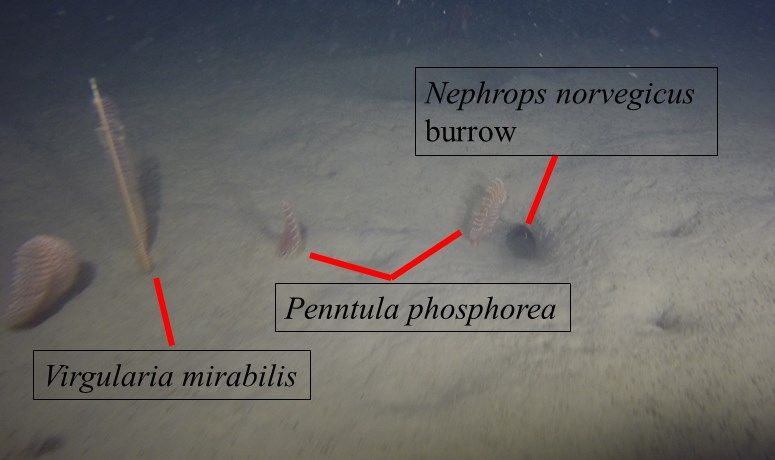
25Figure 7. Norway lobster, Nephrops norvegicus, during measuring procedure. Two sea pen species are abundant along the Swedish west coast. Pennautla phosphorea can grow up to 40 cm in length (including the peduncle), with only around half of this protruding above the sediment. The axial polyp is firm and fleshy and contains red sclerites, which give it its red colour and also the Latin name (Figure 8). It can retract to some extent into the sediment [77] and has been recorded in sandy or muddy sediments between 15 m and 100 m depth. Virgularia mirabilis is a long and slender sea pen, up to 60 cm in length and usually off-white to beige in colour (Figure 8). This species of sea pen has a highly muscular peduncle allowing it to burrow and retract completely into the sediment [78]. Figure 8. Photograph of a Norway lobster burrow and two sea pen species during the ROV survey 2017. Dark spot at the right site of the picture indicates a Norway lobster burrow. Long, slender beige sea pen is Virgularia mirabilis. The three, red, shorter, feather like sea pens are Pennatula phosphorea. 3.2.2 Methods In the Sotenäs Project wave power park, two methods were applied comple- mentary in the same area. Cage fishing for Norway lobster was conducted during the years 2016−2018 and in 2020 using cages for Norway lobster (Fig- ure 5a). Sampling occurred always between late April and late May once a 26
year to ensure comparable seasonal conditions (Paper III, IV and V). Cages
were applied in the wave power park, and east and west of it. They were baited
with a herring before its 48 h deployment. Captured Norway lobster were
measured (carapace length), tagged with a t-bar anchor to identify potential
recaptures and after the procedure returned to the respective sampling loca-
tion. GPS positions were taken and the distance of the cages to the center of
the circular arrangement of the gravity-based foundations (hereafter referred
to as center of the foundations) were calculated (up to 1230 m). A linear model
(R base v 3.5.1, function: “lm”) [75] was used to fit the number of Norway
lobsters and the average carapace length per cage as a function of distance to
the center of the foundations, both for each year separately or combined for
all years. All analyses were conducted using statistical software R (version
3.5.1, Vienna, Austria), enabled via RStudio (version 1.1.463, Vienna, Aus-
tria) [75].
    ROV surveys were conducted complementary during two years, 2016 and
2017, each time between early June and early July (Figure 9). With the help
of the ROV, recordings of the seabed inside the wave power park, along with
areas east and west of it were conducted. Norway lobster burrows and sea pens
were counted for each video section and number per m2 calculated (Paper III,
IV and V). GPS positions were taken and the distance of the video sections to
the center of the foundations were calculated. All analyses were conducted
using statistical software R (version 3.5.1, Vienna, Austria), enabled via RStu-
dio (version 1.1.463, Vienna, Austria) [75] and PRIMER v.6.0.

Figure 9. Medium size ROV, attached with grip arm, laser pointer, high-resolution
camera and tether.

                                                                              27
3.3 Monitoring and environmental monitoring around
MRE sites and devices
This section will not focus on specific methods used in the Papers VI-VIII. A
sustainable implementation of MRE is a key and therefore a need exists to
investigate more about the prerequisites and consequences ocean energy can
have on the marine environment. Reliable, cost effective and all-over environ-
mental monitoring frameworks are a necessary support and safeguard for
ocean energy operations. The harsh conditions in where MRE devices are of-
ten placed reflect a challenge for the monitoring equipment, that need to with-
stand and survive the marine conditions with fast moving water and high
waves beside the ability to manage power to operate instruments and onboard
data acquisition systems.
Technological advancements in different instrument classes and the im-
provement of methodologies have helped the understanding of MRE devices
on the marine environment and some of these technologies are also used to
monitor and enable maintenance for the devices themselves. Common instru-
ments to observe interactions of MRE devices and marine organisms are pas-
sive and active acoustic instruments and optical cameras such as hydrophones,
sonars or high-resolution optical cameras, which are often used and combined
in multipurpose platforms or packages. However, most of today’s multipur-
pose platforms and instruments are developed for research purposes and addi-
tional effort need will be needed to assure the use on a commercial and large
scale for future MRE projects.
A paragraph about challenges and the necessity of standardized monitoring
methods, the further development and need to mature existing technologies to
be able to compare results, process data volumes thereof and finally simplify
and speed up consenting processes, where applicable, is discussed in chapter
4.3.
284. Synthesis of main results and discussion
4.1 Artificial reef effect and complexity as a feature to
enhance abundance
Artificial reef effect
The foundations in the Lysekil research site act as artificial reefs. Twelve
years after deployment the species richness, number of individuals, and Shan-
non-Wiener biodiversity all increased on and around the foundations com-
pared to that at the control sites (Paper I). Pooled data of the study years
(2016−2019) showed significantly larger species richness, number of individ-
uals, and higher biodiversity on the foundation (2016−2019) compared to the
first two years after deployment (2007, 2008). The control sites between the
two study periods did not differ significantly in species richness, number of
individuals, and biodiversity (Figure 10 and Table 1). The evenness decreased
significantly from the first to the second study period (Figure 10 and Table 1).
No non-native species were found at any time.
29Figure 10. Average (a) Species richness (±SE), (b) Total number of individuals (±SE), (c) Shannon-Wiener biodiversity index (±SE), (d) evenness (±SE) on y-axis, respec- tively, of pooled data from 2007 and 2008 and 2016–2019 comparing wave power foundations, blue bars, (complex and non-complex foundations combined) and con- trols, orange bars, of both survey periods on x-axis. * indicates p < 0.05. Table 1. Mann-Whitney U tests (mean value ± standard error (SE) and p-value) for comparison of pooled abundance of species richness, total number of individuals, Shannon-Wiener biodiversity index and evenness between foundations 2007 and 2008 and foundations 2016−2019 and controls 2007 and 2008 and controls 2016−2019. Mann-Whitney U test 2007 & 2008 2016-2019 Species richness Mean ±SE Mean ±SE p-value Foundations 4.33 ± 0.26 8 ± 0.29 < 0.001 Controls 2.13 ± 0.21 2.58 ± 0.2 0.117 Total number of individuals Mean ±SE Mean ±SE p-value Foundations 10.88 ± 0.97 35.23 ± 2.99 < 0.001 Controls 5.35 ± 1.14 5.82 ± 0.68 0.224 Shannon-Wiener biodiversity index Mean ±SE Mean ±SE p-value Foundations 1.14 ± 0.06 1.64 ± 0.04 < 0.001 Controls 0.57 ± 0.07 0.68 ± 0.07 0.285 Evenness Mean ±SE Mean ±SE p-value Foundations 0.27 ± 0.01 0.21 ± 0.01 < 0.001 Controls 0.3 ± 0.01 0.3 ± 0.01 0.851 The larger species richness, number of individuals, and Shannon-Wiener bio- diversity on and around the foundations compared to controls can be explained by the additional structures, the foundations, acting as artificial reefs. Those 30
structures provide substrate, shelter, and additional food sources by the
epibenthic growth [16,22,30,79–81]. Furthermore, studies comparing commu-
nities on artificial reefs with communities on natural reefs or in randomly cho-
sen control areas almost always showed larger density and biomass (e.g., Wil-
helmsson et al. (2006) [82]), where vertical artificial structures had a positive
effect on fish abundance, which is in accordance with our findings [83]. The
sandy seabed areas of the controls reflect a well establish and old habitat com-
pared to the foundations, where high evenness would be expected. Evenness
shows higher values for the control sites compared to the foundations, both
for the pooled data and individual years. One likely explanation why this is
the case is the general low species richness and low number of individuals in
the control sites and the way of calculation for evenness. The decrease in even-
ness on the foundations from the first study period to the second study period
can be explained by the occurrence of single individuals in the later years
which did not reside on the foundations earlier. In the second sampling period
(2016−2019), foundations were populated to a larger extent by echinoderms
and crustaceans and general species abundances were larger. Colonisation of
newly introduced habitat occurs gradually but is also dependent on installation
season [28]. Establishment of less mobile species such as echinoderms and
nudibranchs for example requires sufficient food sources, cover of epibenthic
communities and appropriate habitat with shelter opportunities to hide from
predators [16,30,79,81].

Structural complexity
During all years (2007, 2008 and 2016−2019), but one (2018), the numbers of
Cancer pagurus were up to three times greater on complex foundations com-
pared to non-complex foundations (Figure 11, Paper I). In 2018 the number
of brown crabs were still 1.5 times greater than on non-complex foundations.
A three-way crossed multivariate Analysis of similarities (ANOSIM) revealed
a significant difference between the complex foundations and non-complex
foundations (global R =0.581; p < 0.0001) but not between the years (global
R = 0.166; p
Figure 11. Mean number of Cancer pagurus (±SE) on y-axis comparing complex
foundations with holes (H) and non-complex foundations with no holes (dark blue
bars) and (NH) for all years (light blue bars) on x-axis.

Manufactured holes in the foundations reflect a more complex habitat which
brown crabs are attracted to. As an example, shortly after deployment the side
holes of the foundations were frequently used by Cancer pagurus [30]. During
the second period of the investigations (2016−2019), occupancy was still
large. The preference of C. pagurus for the holes may be due to the holes’
shelter function and enhanced protection from predators, as well as due to the
rich epibenthic growth on the foundations which provided additional food
sources, which has been found to be of crucial importance in other studies
[32,84].

4.2 No-take zones / Marine Protected Areas
4.2.1 No-take zone − Lysekil research site
Two cage types were applied to investigate the potential effects of the wave
power site as an incidental no-take zone on the decapod community (Paper
II). No clear pattern in the number of individuals could be found among the
two cage types, results were mainly non-significant, indicating only a small
difference in abundance with distance to the foundations.
    The results of the decapod abundance for the large cage type are presented
in the following section. The number of decapods caught with the large cages
was on average 1.7 individuals per cage. Pooled data of all years (2016−2019)
showed a decrease, on average, by 0.02 individuals for every additional 100

32
m away from the ecological foundations (linear model: abundance = -0.0002
* D + 1.69), indicating a statistically non-significant relationship (F (1,170) =
0.06; p = 0.81) (Figure 12). The variation in decapod abundance was large and
is also reflected by a low level of explained data variance by the model (r2 =
0.04%). Linear regression of single years indicated a non-significant relation-
ship between decapod abundance and distance to the ecological foundations
(Figure 12 and Table 2). When data were analyzed for each year separately,
the number of captured decapods increased every 100 m away from the wave
power park by 0.2, 0.1, and 0.01 individuals in 2016, 2017, and 2019, respec-
tively. In 2018, the number of captured decapods decreased every 100 m away
from the wave power park by 0.2 individuals. The relationship between deca-
pod abundance and distance to the ecological foundations was non-significant
for all years and pooled data of all years.
Figure 12. Number of decapod individuals captured with cages in 2016−2019. Black
dashed line represents pooled regression line of all years. Fitted values of single years
are represented by dashed lines in colors according to years in the legend. Each sym-
bol represents a single cage, with circles, quadrats, and triangles indicating cages po-
sitioned inside, to the east, and to the west of the wave park, respectively.
Table 2. Results of the linear models with number of decapods per cage as a function
of distance to the closest ecological foundation (= D) for the different year and all
years pooled.
Large Number F-statistic r2 p-value Linear model
Cages of cages
2016 32 0.87 0.03 0.359 0.002 * D + 2.04
2017 36 0.50 0.015 0.482 0.001 * D + 1.29
2018 41 1.01 0.03 0.321 -0.002 * D + 1.45
2019 63 0.01 0.0001 0.931 0.0001 * D + 1.71
Pooled 172 0.06 0.0004 0.81 -0.0002 * D + 1.69
33The non-significant results of the decapod abundance on a larger scale (up to 360 m away from the foundations) can have several explanations. With an area of only 0.5 km2, the wave power park in our study is comparably smaller than most MPAs in Europe, where mean size of MPAs are 55 km2 [51]. Small MPAs have also been found to be less effective than larger protected areas [49]. Foundations reflect artificial reefs and are known to attract organisms [85–87], however, predators of decapods such as seals and larger fish like cod could also be among the attracted organisms (Paper VIII) which could com- pensate for a potential increased number of decapods in the wave power park. Furthermore, recreational fishing inside the wave power park, even though undesired, has occurred throughout the study years (personal observation). The coastal habitats on the Swedish west coast are extensively used by recre- ational fisheries [88] and recreational fisheries have been shown to contribute to mortality of marine mobile fauna and may also have contributed to mortal- ity of decapods [89,90] and thereby compensate eventual increased decapod abundances. The Lysekil research site did not significantly influence the abun- dance of decapods in the park and up to 360 m around it. The results suggest that the incidental no-take zone plays a limited role as an additional benefit for the decapod community in terms of abundance. 4.2.2 No-take zone – Sotenäs Project wave power park Sea pens (Virgularia mirabilis and Pennatula phosphorea) Sea pens are benthic organisms which can potentially benefit by the incidental no-take areas of wave energy sites and analyses of two species were conducted in the site Sotenäs Project wave power park (Paper III). The investigations on two sea pen species (Virgularia mirabilis and Pennatula phosphorea) in the Sotenäs Project wave power park with a two-way crossed ANOSIM revealed a significant difference between sites, inside wave power park, east and west of it (global R = 0.642; p = 0.001) and between years (global R = 0.576; p = 0.001). Significant differences were found between all pairwise comparisons of the three locations, inside wave power park and control area west (R=0.602; p
6

      Mean number of sea pens per m2
                                       5

                                       4

                                       3

                                       2

                                       1

                                       0
                                           CW 2016   CW 2017   IWP 2016   IWP 2017   CE 2016   CE 2017
                                                                Location and year

Figure 13. Mean abundance (±SE) per m2 of the two sea pen species on y-axis for the
three locations inside the wave park (IWP), and the two control areas east (CE) and
west (CE), and the two years 2016 (blue bars) & 2017 (red bars) on x-axis.

Restriction of marine activities inside MRE sites, such as fishing and boat
traffic of designated areas, could be beneficial for benthic organisms
[51,58,91]. Slow-growing benthic species such as sea pens can benefit from
de facto no-take zones of MRE sites especially since damaging fishing meth-
ods such as trawling can be destructive to both seabeds and associated organ-
isms. Analyzing both years independently, the abundance of sea pens was al-
ways largest inside the wave power park (Figure 13). Although this met the
expectations, it does not explain the large differences between the two years
for the location inside the park and the control area west. An explanation for
the difference in abundance between the years could be the withdrawal behav-
iour. Both investigated sea pens species, Virgularia mirabilis and Pennatula
phosphorea, are capable of withdrawing into their tubes in the soft bottom
[77,78]. However, sea pens closely passed by the ROV did not show this be-
haviour. Sea pens are slow growing organisms and thus the sudden increase
in abundance from one to another year cannot be explained by a recruitment
event. Even though sampling locations were chosen to resemble similar con-
ditions, patchiness could occur and the control east may have provided less
favourable conditions for sea pens and thereby been inhabited by lower den-
sities compared to the control location west of the wave power park and inside.
    Another reason could be an inaccuracy in video analyses due to the higher
speed of the ROV in 2017 compared to 2016. Transects were approximately
taken in the same location in both years, however, working at a depth of 50
m, the scanned area can be easily shifted by a few meters, also influencing the
abundance by scanning a different area and resulting in the discrepancy be-
tween the years.

                                                                                                         35
You can also read