Equal Parts Sleeping and Eating: A Year in the Life of a Bear
←
→
Page content transcription
If your browser does not render page correctly, please read the page content below
NATIONAL CENTER FOR CASE STUDY TEACHING IN SCIENCE
Equal Parts Sleeping and Eating:
A Year in the Life of a Bear
by
Scott J. Donnelly
Division of Science
Arizona Western College, Yuma, AZ
In this case study you will learn the basics about bear denning and hibernation, and about the nutritional landscape bears
must navigate to prepare for the long months of winter inactivity and caloric deprivation using true/false, short answer,
calculations, and both qualitative and quantitative analysis of tables or graphs.
Part I – The Long Sleep
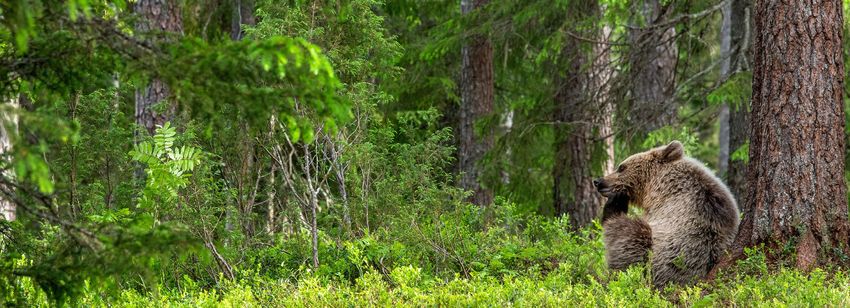
Imagine yourself in the gathering chill of an early November day entering a natural depression at the base of a large
tree1 and curling up into a tight ball, with your head between your arms and your legs tucked into your abdominal
area; the fetal position. Slowly you fall into an extended state of lethargy and physical inactivity. And now imagine
that you move only to adjust your sleeping position; otherwise, you are motionless. It is not until the arrival of spring
warmth sometime in late March or early April that you wake from your slumber. And during the 150 days or so of
your long-term immobilization and dormancy, you do not eat food of any kind, drink any liquids, or expel any urine
or feces. Whatever waste is generated stays inside your body. Think you would survive?
Of course, the above is fanciful for humans as it would result in death, as it would for almost every other kind of
mammal in the animal kingdom. But not so for Ursus arctos (brown bear) and Ursus americanus (black bear).
Every year during the winter months, bears lapse into a state of extended dormancy and slumber. Why do they do
this? There is strong evolutionary pressure for bears to stay in their dens over the course of a long, cold, and foodless
winter. Denning (and consequently hibernation) is an adaptive strategy to protect against starvation and eventual
death during seasonal periods of prolonged food shortages and caloric deprivation.
Hibernation for bears is not a deep sleep. Rather, bears hibernate to conserve energy by reducing energy expenditure
for vital and necessary metabolic and physiological functions during periods when food is sparse or not available. Bear
hibernation is characterized by a number of radical and profound physiological and metabolic changes. And because
of these changes, hibernation allows bears to stay put in their habitat rather than having to expend valuable energy
migrating as do elk, many birds, and caribou to another habitat perhaps tens to hundreds of miles away looking for
nutritious food.
Question
1. What factors (biological and environmental) might trigger or influence a bear to enter their den and start the
winter denning period?
1
A grizzly often digs its den at the base of a large tree that preferably is on a steep mountain slope so snow covers the den entrance and hence
helps to insulate the den. Black bears typically do not dig their dens but rather seek out natural cavities in rocks, trees, or the ground.
Case copyright held by the National Center for Case Study Teaching in Science, University at Buffalo, State University of New York.
Originally published May 5, 2021. Please see our usage guidelines, which outline our policy concerning permissible reproduction of this work.
Credit: Licensed image © Sergey Uryadnikov | Dreamstime, id 188544543.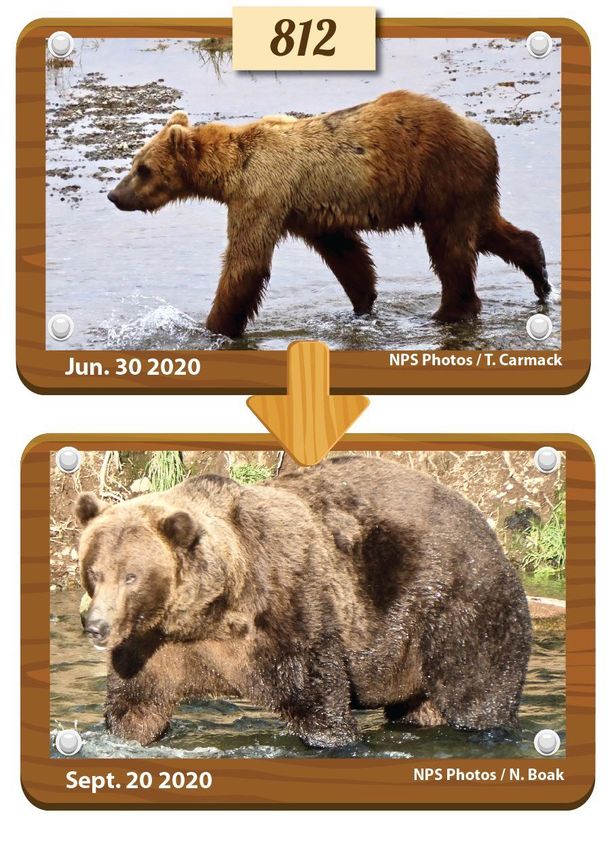
NATIONAL CENTER FOR CASE STUDY TEACHING IN SCIENCE

Humans do not all go to bed or wake up at the same time, nor do they all sleep for the same length of time. Bears
are no different. Some begin denning earlier (and some later) than others and some emerge from their dens earlier
(and some later) than others. The result is that for a population of bears in the same area some bears den for longer or
shorter lengths of time than other bears. Let’s analyze some research data regarding the duration of bear winter den-
ning for grizzly bears (Ursus arctos horribilis)2 in the Greater Yellowstone Ecosystem (GYE) from 1975–1999.

                 Figure 1. Cumulative percent of GYE grizzly bears that have entered their winter den. (Adapted from Haroldson et al., 2002.)

                Figure 2. Cumulative percent of GYE grizzly bears that have emerged from their winter den. (Adapted from Haroldson et al., 2002.)

 2
       Grizzly bears (Ursus arctos horribilis) are a sub-species of brown bears (Ursus arctos). In North America, brown bears that live in the interior of a
       land mass and not near the Gulf of Alaska and Pacific Ocean coasts are known as grizzly bears.

“Equal Parts Sleeping and Eating” by Scott J. Donnelly                                                                                               Page 2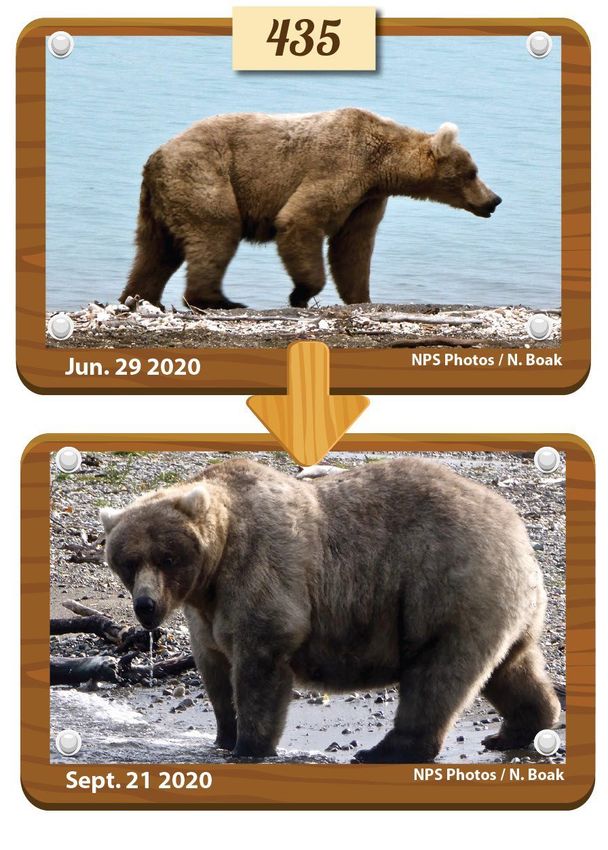
NATIONAL CENTER FOR CASE STUDY TEACHING IN SCIENCE

 Questions
     2. Determine whether each of the seven statements below (a–g ) is true or false. The questions are based on the
        interpretation of Figures 1 and 2 on the previous page.
        a. Among GYE female bears the mean den entry is approximately the first week in November and the range of
           den entry spans the fourth week in September to the third week in December. ___________

        b. Overall and in general male GYE grizzly bears begin the denning period later and emerge from the den earlier
           than both female groups. ___________

        c. Based on a cumulative percent of 30%, the duration of the denning period for known pregnant females is
           about 140 days and is longer than the denning period for both other females and males. ___________

        d. Based on a cumulative percent of 70% for each bear population grouping, males emerge from their den
           approximately 2.5 weeks earlier than females. ___________

        e. In general for a given cumulative percent of bear types, other females enter their den about 5–7 days earlier
           than known pregnant females. ___________

        f. Figures 1 and 2 indicate that for the average den duration (length) of GYE grizzlies: known pregnant females >
           other females > males. ___________

        g. When 80% of GYE male grizzlies have emerged from their winter dens, approximately 38% of other females
           and 27% of known pregnant females are still in their dens. ___________

     3. What are some factors that might explain the differences in the average denning duration among the three bear
        types (Known Pregnant3 Females, Other Females, and Males) described in Figures 1 and 2?

 3
    Pregnant female bears give birth while denning/in hibernation, so when they emerge from the den they have cubs.

“Equal Parts Sleeping and Eating” by Scott J. Donnelly                                                                          Page 3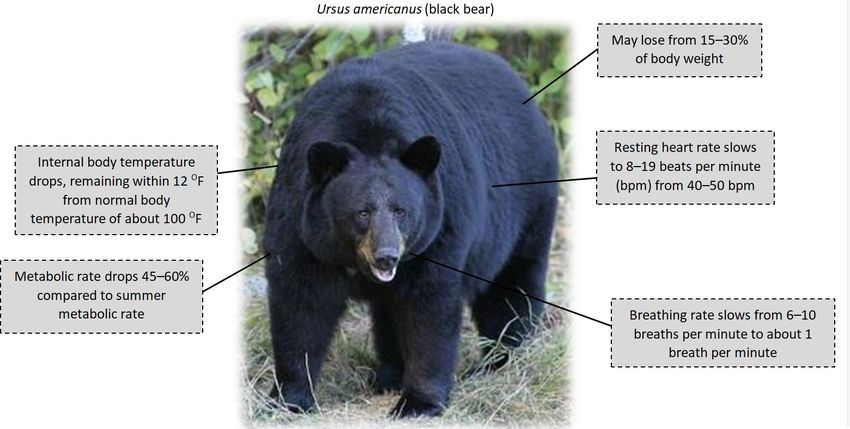
NATIONAL CENTER FOR CASE STUDY TEACHING IN SCIENCE

 Part II – Sweet Dreams
So what happens to a bear’s body between the time it eats its last meal just before entering the den to when it exits the
den, a period lasting from 100 to 150 or more days? Figure 3 below summarizes some of the impressive metabolic and
physiological adjustments and stresses1 that happen when bears hibernate.
It goes without saying that not eating anything for 100 to 150 consecutive days (and longer at more northern lati-
tudes) means that bears lose weight. But how much weight can a bear lose while denning?

           Figure 3. Summary of physiological and metabolic changes to bears during the denning period. (Photo by Dignitur, cc by-sa 3.0,
           )

 Questions
     1. As noted above GYE grizzly bears can lose from 15 to 30% of body weight2 (depending on sex and age) from the
        time the denning period begins in late autumn (start of hibernation) to the time a bear emerges from the den in
        the spring. Yet, few bears die while denning. Note the range in weight loss: 15 to 30%. One year perhaps a GYE
        grizzly might lose 17% of body weight during the denning period while the next year it loses 29%. What are
        some factors that might influence the extent of weight loss for a hibernating male GYE grizzly bear?

1
   Figure 3 does not include the physiological and metabolic stresses for pregnant female bears due to gestation, birth, and lactation; female griz-
   zlies give birth to two or three cubs in late January/early February. Once born, bear cubs do not leave the den and remain dependent on their
   mother’s fat- and protein-rich milk (18% and 6% on average; human milk is 4% fat and less than 1% protein) for up to almost a year (weaning
   typically begins July/August). (White et al., 2017)
 2
     While denning and hibernating, bears metabolize stored white fat reserves while having no significant net loss of muscle mass. Bears emerge
     from the den thinner but still strong as there is no net loss of muscle from protein catabolism. And there is no appreciable loss of water weight
     since metabolism of fat generates water as a product. The bear stays hydrated while hibernating without having to drink water. (Hellgren, 1998)

“Equal Parts Sleeping and Eating” by Scott J. Donnelly                                                                                        Page 4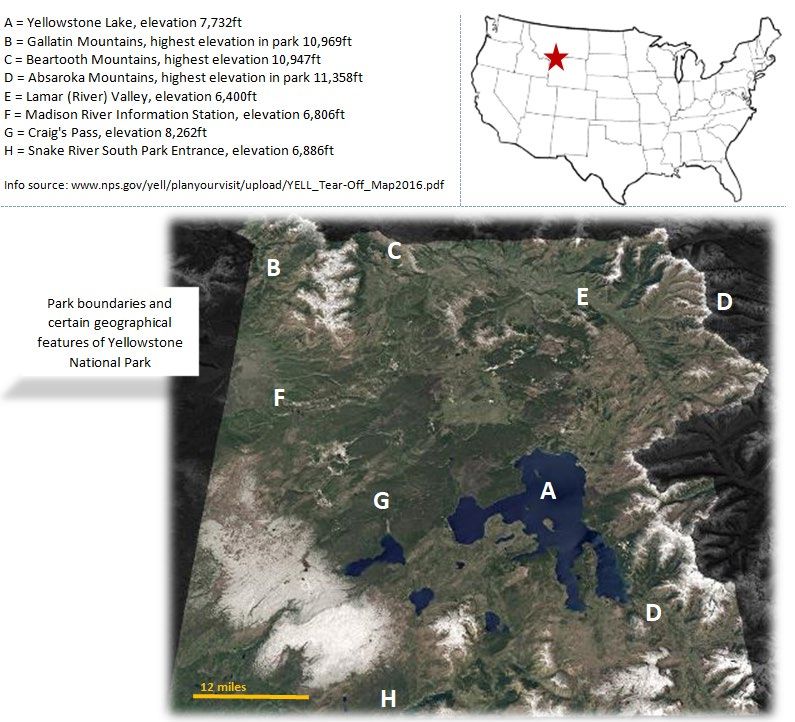
NATIONAL CENTER FOR CASE STUDY TEACHING IN SCIENCE

  2. Assume that a GYE grizzly bear enters its den on November 20 weighing 405 lbs, and emerges on April 20,
     having lost 28% of its weight. If the weight that is lost by the bear is due only to the metabolism of stored white
     fat (energy-mass value: 9kcal/g fat), then:

      a. What is the total weight lost by the bear (lbs)? ___________

      b. What is the weight of the bear at den emergence (lbs)? ___________

      c. What is the average daily rate of fat metabolism in terms of lbs/day and in terms of kcal/day? ___________

      d. What is the total energy from fat metabolism (kcal)? ___________

  3. Based on the values in Question 2, is the GYE grizzly described more likely a male, a female with newborn cubs,
     or a female without cubs? Offer rationale/evidence for your choice.

“Equal Parts Sleeping and Eating” by Scott J. Donnelly                                                              Page 5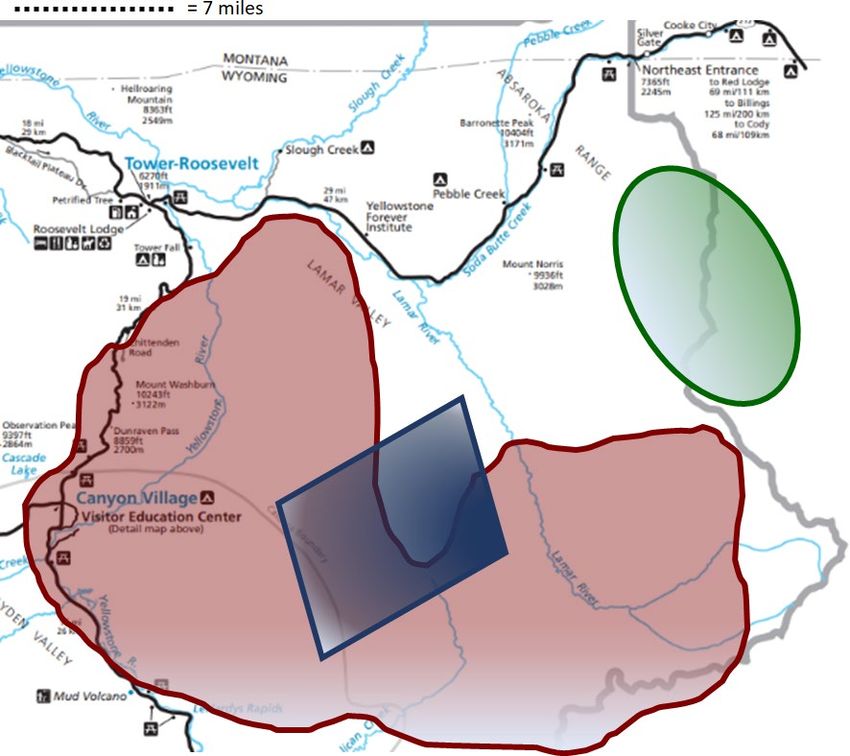
NATIONAL CENTER FOR CASE STUDY TEACHING IN SCIENCE

 Part III – Oh, Give Me a Home Where the Grizzly Bear Roam
Yellowstone National Park (YNP) is located in the far northwestern corner of Wyoming. Small portions spill over
into neighboring Montana and Idaho. YNP is the core of the larger Greater Yellowstone Ecosystem (GYE). Both
grizzly and black bears roam YNP and GYE. As shown in the NASA satellite image below (Figure 4), the terrain and
habitats they live in are varied and extreme: low and high elevation treeless meadows lush with edible grasses, forbs,
and wildflowers; wide grasslands; dense coniferous forests in which to hide; cold, deep lakes, wide, fast-flowing rivers,
and shallow, slow-flowing streams; steep canyons; and ancient, snow covered mountains with sub-alpine habitat above
tree line standing between the bears and where they want to go next. It is within these diverse and varied habitats that
Ursus arctos horribilis and Ursus americanus search and forage for up to 20 hours every day in late summer for energy-
rich, nutritious meat, grasses, forbs, berries, and nuts to put on the fat before the food supply and availability rapidly
diminish with the coming of another cold, foodless winter.

                                Figure 4. Park boundaries and geographical freatures of Yellowstone National Park.

“Equal Parts Sleeping and Eating” by Scott J. Donnelly                                                                          Page 6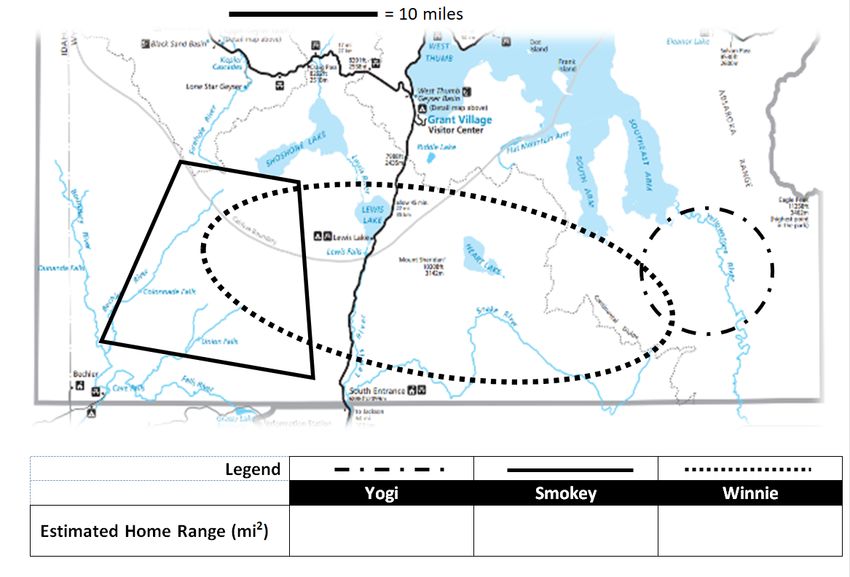
NATIONAL CENTER FOR CASE STUDY TEACHING IN SCIENCE

Once a bear emerges from its winter den, it is hungry and still “drunk” from its energy-conserving, slow metabolism
during hibernation. The first two weeks or so of post-den emergence is known as “walking hibernation.” During this
time, bears resemble the zombies in The Walking Dead, slow and lethargic in movement, or even some humans upon
waking from a deep sleep before their first shot of hot, caffeinated coffee.
During this walking hibernation a bear’s energy-conserving metabolism is adjusting upwards in order to meet the
greater energy demands of its increased physical activity, warmer body temperature, and a more rapid heart rate.
Eventually over a couple of weeks a bear’s metabolism adjusts to summer activity levels and kicks into hyper-drive.
Bears then turn into dedicated, non-stop eaters and drinkers of water searching far and wide for the next bite to eat,
regardless of what it is as both grizzly and black bears are opportunistic, generalist omnivores. Any type of meat or
vegetation suits their voracious late spring-summer-early autumn appetite.
Bears are constantly on the move during the late spring, all summer, and all the way to late autumn, oftentimes
covering great distances over diverse habitats in the non-stop and constant search for locally and seasonally available
food resources. But no single bear searches the entire area of Yellowstone National Park (or the much larger Greater
Yellowstone Ecosystem) for food. Rather, bears have home ranges, and oftentimes home ranges overlap. A bear’s home
range is the area in which the bear lives and moves while active.

 Questions
  1. The map below (Figure 5) shows the southern region of Yellowstone National Park. The geometrical shapes
     represent the outer borders of the hypothetical home range for each of three grizzly bears: Yogi, Smokey, and
     Winnie. Using the information provided, calculate the estimated home range for each bear in square miles (mi2).

                                               Figure 5. Home ranges of three hypothetical bears.

“Equal Parts Sleeping and Eating” by Scott J. Donnelly                                                                         Page 7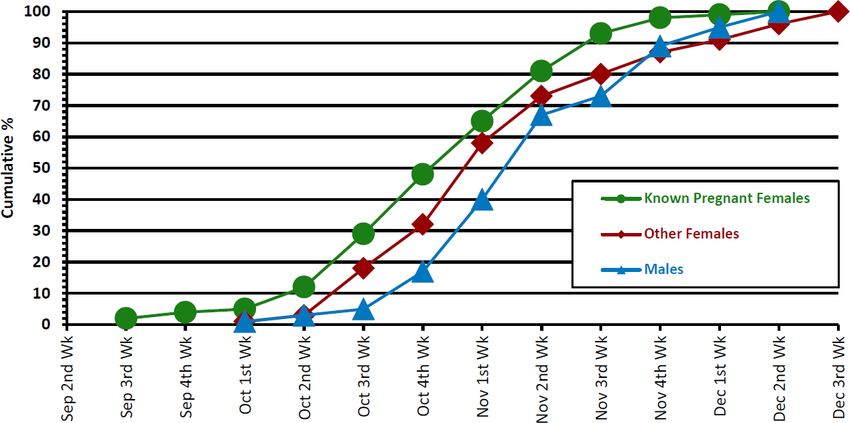
NATIONAL CENTER FOR CASE STUDY TEACHING IN SCIENCE

  2. A bear’s home range is not static and constant. Rather, it is dynamic and can increase or decrease in size on a daily,
     seasonal, or annual basis. What are some reasons why both a male and a female bear’s home range could expand
     or contract in size over time?

  3. Table 1 below shows the annual home ranges for different grizzly bear types based on sex and age in the Greater
     Yellowstone Ecosystem (Table 5.1 in White et al., 2017).
      Table 1. Grizzly bear home ranges in GYE 1980–2012.
       Sex and age group                 Number of ranges            Home-range size (mi 2)
       Subadult female                        38                             59
       Females with cubs                      64                             62
       Adult femalesa                        145                             66
       Subadult malesb                        54                            197
       Adult males                           125                            154
       a: without cubs; includes females with yearlings or older offspring and lone adult females.
       b: two to four years old

      Offer some reasons for differences in home range between (a) females with cubs vs. adult males, and (b) subadult
      males vs. adult males.

“Equal Parts Sleeping and Eating” by Scott J. Donnelly                                                                              Page 8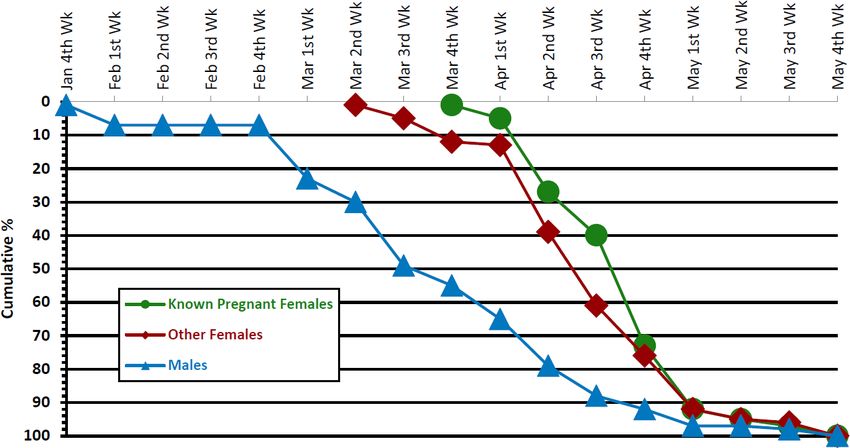
NATIONAL CENTER FOR CASE STUDY TEACHING IN SCIENCE

  4. Figure 6 below shows the northeastern region of Yellowstone National Park. The colored shapes represent three
     different but overlapping hypothetical home ranges for three different grizzly bears, identified as 75, 224, and
     475. Using the information provided for each bear, complete Table 2 below. For the column “Sex and Age Group,”
     choose from the following descriptors: adult male (AM), female with cubs (FWC), and other female (OF). For
     the “Home Range” column, choose from: B = blue, G = green, R = red).
      Table 2. Hypothetical home ranges for grizzly bears in YNP.
          Bear ID        Date of Den Entry Date of Den Emergence                      Sex and Age Group        Home Range
              75              Nov. 5                  April 12
             224              Nov. 29                March 20
             475              Nov. 10                  April 7

                                           Figure 6. Home ranges of three hypothetical bears in YNP.

“Equal Parts Sleeping and Eating” by Scott J. Donnelly                                                                        Page 9
NATIONAL CENTER FOR CASE STUDY TEACHING IN SCIENCE
Part IV – Where's the All-You-Can-Eat Buffet Line?
Bears are the champions of winter rest. And they are also the
undisputed champions of non-stop summer eating. Once a
grizzly or black bear emerges from the den, its stomach is empty
as its last meal was 100–150 or more days previous. So it comes
as no surprise that, once bears emerge from their dens and rid
themselves of their winter lethargy and “walking hibernation,”
they are ready to eat, and eat, and eat, and eat some more. Bears
spend summer and autumn endlessly roaming the landscape for
food (of any type and quality).
Bears do not have picky culinary palates and are opportunistic
omnivores, eating whatever meat, leafy vegetation, berries, or
insects they come across. Basically, if something is comprised of
protein, carbohydrates, or fat, or a combination of the three, then
a bear will eat it. Come late August or thereabouts, bears enter a
manic phase of binge eating and gorging known as hyperphagia.
During this time, bears can consume more than 20,000 kilocalo-
ries of food daily, a figure roughly four times greater than what
they require pre-hyperphagia!
What is the ideal result of hyperphagia? To become an excessively
fat, beefy, hulking heavyweight bear with inches upon inches of
fat to live off while hibernating (see Figure 7).1
Every summer brown bears stake out on the Brooks River to
gorge as much as they can for as long as they can on the migrat-
ing sockeye salmon. When the salmon run ends, they then gorge
on something else including berries, leafy vegetation, and mussels.
Why? The fatter the bear, the better the chance of surviving the
coming long and brutal, foodless winter.
A bear’s size depends on where it lives (its habitat), the caloric
(energy) value of what it eats, and how much of what is eaten can
be digested. The brown bears of Katmai National Park in Alaska
have access to a steady diet of abundant food from coastal oceanic
waters and migrating salmon. GYE grizzlies and black bears do
not have the luxury of ready access to consistently abundant
foods such as clams, mussels, and salmon. Rather, GYE grizzlies
and black bears eat whatever is available and abundant.
In an extensive review of the research literature Gunther et
al. (2014) documented that from 1891–2013 GYE grizzlies
consumed more than 266 species within 200 genera from 4
Figure 7. Before-and-after photos of two contestants
kingdoms. Species eaten included 175 plant (forbs, shrubs, berries, (bears 435 and 812) in the 2020 Fat Bear Week Com-
grasses, sedges, rushes, and whitebark pine nuts- historically, a petition at Katmai National Park and Preserve.
1
Want to vote for next year’s fattest Katmai National Park bear? Curious about the annual Fat Bear Week competition (a kind of Ursine March
Madness)? If yes to either, check out:
• Goldman, T. 2019. It’s fat bear week in Alaska’s Katmai National Park: time to fill out your bracket [webpage].
• Katmai Conservancy. 2019. Fat bear 2019 brackets [webpage].
“Equal Parts Sleeping and Eating” by Scott J. Donnelly Page 10NATIONAL CENTER FOR CASE STUDY TEACHING IN SCIENCE
dominantly ants), 34 mammal (most common being scavenging of winter-killed elk (Cervus elaphus) and bison (Bison
bison) carcasses or chasing away wolves from elk and bison killed by the wolves, and predation by bears themselves
of newborn elk calves born in May/June), 7 fungi (gilled and non-gilled mushrooms; false truffles being a favorite of
females), 7 bird, 4 fish (historically and up to the 1990s spawning cutthroat trout (Oncorhynchus clarkii), a staple food
source for bears), and 1 amphibian species.
Questions
1. Not all foods are the same in energy content, digestibility, and composition. Table 3 below gives an assortment of
information for four hypothetical food types (A–D) available to bears in Yellowstone National Park (YNP). For
each food determine its gross energy value, GEV (i.e., fill in the last row of Table 3). (Note that GEV is the total
amount of chemical energy in a food as determined by complete thermal combustion in a constant-volume bomb
calorimeter. GEV is the energy available to, but not necessarily used by, a bear if the food is 100% digestible.)
Table 3. Four hypothetical food types available to bears in YNP.
Food ID A B C D
Mass of food eaten (g) 105 40 84 128
Energy value (kcal) 308 149 570 288
Total fat (g) 24 1 54 0
Total carbohydrate (g) 0 34 9 56
Total protein (g) 23 1 12 16
% digestible 90% 94% 96% 65%
Gross energy value, kcal/g
Note: energy values: fat (lipid), 9kcal/g; carbohydrate, 4kcal/g; protein, 4kcal/g.
2. How are these numerical data analyzed? Thought about? Interpreted? Applied? There are a number of
proportional and absolute ways to look at and compare the dietary contribution of nutrients in food.
Definitions and units matter. Let’s illustrate this with something we all know about: money. Suppose you are in
salary negotiations with a new employer. Four offers are made: $100, $100/week, $100/person/day, and $100/
person/hr. Of the four monetary choices no doubt you would choose $100/person/hr. So now let’s take a closer
look at Table 3. Based on the hypothetical foods in Table 3, complete Table 4 below and then answer questions
2a and 2b further below.
Table 4. Energetic analysis of hypothetical foods A–D.
Total energy (kcal) in food* from: % metabolizable energy** in food*** from:
Food Protein Carbohydrate Fat Protein Carbohydrate Fat
A
B
C
D
* Based on mass of food eaten in Table 3. **
For simplicity in calculations, assume all nutrients in
food are metabolizable.
***
Relative to total energy in mass of food eaten.
a. Adding fat layers is good for a bear as the accumulation of inches of deep fat increases a bear’s chances to
survive a foodless winter. So consuming fat-rich foods is essential. Which hypothetical food A–D contributes
the highest proportion of energy from fat per mass of food consumed?
“Equal Parts Sleeping and Eating” by Scott J. Donnelly Page 11NATIONAL CENTER FOR CASE STUDY TEACHING IN SCIENCE
b. Bears, like any mammal, need to eat protein-based foods to gain body mass and beef up muscle density.
Which hypothetical food A–D contributes the largest value of protein mass per mass of food consumed?
3. Suppose that 4,400 kcal is the daily base caloric (energy) need for a YNP black bear to sustain mandatory
physiological functions like breathing (6–10 breaths per minute), heart rate (40–50 beats per minute at rest), and
body temperature (~100 °F). Any energy intake above 4,400 kcal goes toward growth or weight gain. Suppose
also that the only food available is food D. Calculate the minimum weight (in pounds) of food D that the bear
needs to eat each day in order to supply 4,400 kcal. (Hint: take into account the % digestible value.)
4. Erlenbach et al. (2014) studied how different nutrient compositions of proteins, lipids, carbohydrates, and
digestible energy in different, mixed diets given to captive adult brown bears influenced the extent and efficiency
to which the bears gained or lost body mass. Bears were given unlimited access to two or three highly digestible
foods with differing protein, carbohydrate, and lipid proportions in mixed diets. Figure 8 below shows the overall
predicted rate of body mass gain with varying percentage of dietary protein content.
Figure 8. Predicted rate of body mass gain compared to varying percentage of dietary protein content.
a. TRUE or FALSE? Figure 8 shows that the captive adult brown bears in the study selected foods that provided
the most efficient dietary protein content for maximizing their mass gain per unit of energy intake. The
optimum dietary protein content that led to the maximum rate of gain in body mass for the captive adult
brown bears is approximately 22% ± 2%. Any amount of protein in a diet greater than the upper limit of this
range negatively impacts the rate of gain in body mass, and any amount of protein less than the lower limit of
this range results in a bear not gaining as much body mass as is possible.
b. TRUE or FALSE? Of the four hypothetical foods in Table 3, A is the best choice to feed bears to add body
mass since food A has the greatest percentage of total protein relative to the mass of food eaten compared to
the other three and the percentage of protein mass in food A is at the optimum dietary protein content value
of Figure 8. Food B is the worst choice as the amount of protein available in food B is negligible.
“Equal Parts Sleeping and Eating” by Scott J. Donnelly Page 12NATIONAL CENTER FOR CASE STUDY TEACHING IN SCIENCE
5. In their paper Erlenbach et al. (2014) used macronutrient triangles (Figure 9 below; axes show % metabolizable
energy) to plot data for the feeding trials of captive adult brown bears. The values for each of the three nutrients
run diagonally or horizontally. The carbohydrate values slant downward overall from left to right (indicated by
red arrow) and increase in value from the triangle’s apex downward to the bottom left. Protein values slant upward
overall from left to right (indicated by blue arrow) and increase in value from left to right at the triangle’s base. The
values for lipids run horizontally (indicated by green arrow) and increase in value upward from bottom right to the
triangle’s apex.
Figure 9. Macronutrient triangle axes = % metabolizable energy).
Table 5 shows the composition of five mixed diets and the percentage of metabolizable energy of the three
macronutrients in the diets Erlenbach et al. (2014) fed to captive adult brown bears. Match the diet type in Table
5 with the choice it is represented by in Figure 9. Place your choice (shape or word description: star, circle, etc.) in
the last column.
Table 5. Diets from Erlenbach et al. (2014).
% of Metabolizable Energy
Diet Items Protein Carbohydrate Fat Choice in Figure 9
salmon, apples, beef fat 11 18 71
beef, bread, pork fat 15 9 76
Fall
salmon, salmon oil 20 0 80
salmon, apples 21 57 22
Spring salmon, apples, beef fat 18 23 59
6. Based on the data you generated for Table 4, plot the data for hypothetical foods B and C on the nutrient triangle
in Figure 9. Use the letter “B” for food B and a “C” for food C.
“Equal Parts Sleeping and Eating” by Scott J. Donnelly Page 13NATIONAL CENTER FOR CASE STUDY TEACHING IN SCIENCE
References
Erlenbach, J.A., K.D. Rode, D. Raubenheimer, and C.T. Robbins. 2014. Macronutrient optimization and
energy maximization determine diets of brown bears. Journal of Mammalogy 95(1): 160–8.
Gunther, K.A., R.R. Shoemaker, K.L. Frey, M.A. Haroldson, S.L. Cain, F.T. van Manen, and J.K. Fortin. 2014.
Dietary breadth of grizzly bears in the Greater Yellowstone Ecosystem. Ursus 25(1): 60–72.
Haroldson, M.A., M.A. Ternent, K.A. Gunther, and C.C. Schwartz. 2002. Grizzly bear denning chronology and
movements in the Greater Yellowstone Ecosystem. Ursus 13: 29–37.
Hellgren, E.C. 1998. Physiology of hibernation in bears. Ursus 10: 467–77.
White, P.J., K.A. Gunther, and F.T. van Manen, eds. 2017. Yellowstone grizzly bears: ecology and conservation of an
icon of wildness. Yellowstone Forever, Yellowstone National Park, and U.S. Geological Survey, Northern Rocky
Mountain Science Center.
“Equal Parts Sleeping and Eating” by Scott J. Donnelly Page 14You can also read