Estimating Presentation Competence using Multimodal Nonverbal Behavioral Cues
←
→
Page content transcription
If your browser does not render page correctly, please read the page content below
Estimating Presentation Competence using
                                             Multimodal Nonverbal Behavioral Cues

                                             Ömer Sümer1 , Cigdem Beyan4 , Fabian Ruth2 , Olaf Kramer2 , Ulrich
                                                              Trautwein3 , and Enkelejda Kasneci1
                                                    1
                                                      Department of Computer Science, University of Tübingen
arXiv:2105.02636v1 [cs.CV] 6 May 2021

                                                    2
                                                      Department of General Rhetoric, University of Tübingen
                                                3
                                                   Hector Research Institute of Education Sciences and Psychology
                                                           University of Tübingen, Tübingen, Germany
                                                4
                                                   Department of Information Engineering and Computer Science,
                                                            University of Trento, Povo (Trento), Italy
                                                  {name.surname}@uni-tuebingen.de,{name.surname}@unitn.it

                                              Abstract. Public speaking and presentation competence plays an es-
                                              sential role in many areas of social interaction in our educational, profes-
                                              sional, and everyday life. Since our intention during a speech can differ
                                              from what is actually understood by the audience, the ability to appro-
                                              priately convey our message requires a complex set of skills. Presentation
                                              competence is cultivated in the early school years and continuously de-
                                              veloped over time. One approach that can promote efficient development
                                              of presentation competence is the automated analysis of human behavior
                                              during a speech based on visual and audio features and machine learning.
                                              Furthermore, this analysis can be used to suggest improvements and the
                                              development of skills related to presentation competence. In this work,
                                              we investigate the contribution of different nonverbal behavioral cues,
                                              namely, facial, body pose-based, and audio-related features, to estimate
                                              presentation competence. The analyses were performed on videos of 251
                                              students while the automated assessment is based on manual ratings ac-
                                              cording to the Tübingen Instrument for Presentation Competence (TIP).
                                              Our classification results reached the best performance with early fusion
                                              in the same dataset evaluation (accuracy of 71.25%) and late fusion of
                                              speech, face, and body pose features in the cross dataset evaluation (ac-
                                              curacy of 78.11%). Similarly, regression results performed the best with
                                              fusion strategies.

                                              Keywords: Applied computing · Psychology · Interactive learning en-
                                              vironments · Computing methodologies · Machine learning · Computer
                                              vision

                                        1   Introduction

                                        Public speaking requires a high caliber of eloquence and persuasion in order
                                        to convey the speaker’s objective while also captivating their audience. Above
                                        all, public speaking is essential to many educational and professional aspects
2 Sümer and Beyan et al.
of life, e.g., a successful thesis defense, teaching a lecture, securing a job offer,
or even presenting your research at a conference. Moreover, in the context of
digital transformation and with increasing online presence (e.g., online teaching
courses), the demand for tutorials related to the development of presentation
competence is expanding rapidly. For example, the non-profit educational orga-
nization Toastmasters International1 , which teaches public speaking through a
worldwide network of clubs, currently has more than 358K members.
Besides the actual content of a speech (the verbal cues), multiple nonver-
bal cues, such as prosody, facial expressions, hand gestures, and eye contact,
play a significant role in engaging with, convincing, and influencing the audi-
ence [27,19]. Various public speaking performance rubrics [5,38,22,32] have been
used by teachers and professors to manually asses the competence of a speech.
Although the rubrics above consider a speaker’s nonverbal behavior, some do
not differentiate between types of nonverbal behavior (acoustic or visual). For
instance, Schreiber et al. [32] include nonverbal cues as a single item: ”demon-
strating nonverbal behavior that reinforces the message”. While it is certainly
possible for a human annotator to utilize high-inference questions when rat-
ing a performance, by employing machine learning we can further investigate
fine-grained nonverbal behaviors individually and provide speakers with detailed
feedback to improve their presentation skills.
With this motivation in mind, our work employs a recently proposed assess-
ment rubric, the Tübingen Instrument for Presentation competence (TIP), whose
items represent nonverbal cues in detail. Having different items for behavioral
cues, such as posture, gesture, facial expressions, eye contact, and audio traits,
allows for a better explainability of the strengths and weaknesses of a public
speech. In contrast to the sole assessment of a speech in previous works, we can,
in this way, infer the underlying behavioral factors, and enable an automated
assessment, which can become an asset in (self) training.
Besides their time-consuming nature, manual assessments are prone to sub-
jectivity. Although a proper training and simultaneous rating by multiple raters
might help overcome this limitation, relying on human raters limits the number
of assessments that can be done at a certain time. To tackle these problems,
automatic public speaking competence estimation is necessary. Some studies in
the social computing domain have therefore investigated automated assessment
with regard to audio-based nonverbal features (NFs) [26,24,20], video-based NFs
[33,8], or with a multimodal approach as in [39,40,15,8,7,25]. Related works that
performed automated public speaking competence analysis indicate that there
are different types of speeches such as scientific presentations [33,25,16,11], po-
litical speeches [31,10], and video interviews [26].
In this study, we compare three major sources of nonverbal communication:
i) speech, ii) face (including head pose and gaze), and iii) body pose, as well as
the fusion of these sources, to assess public speaking competence.The experimen-
1
https://www.toastmasters.org/Estimating Presentation Competence 3
tal analyses were conducted on informational, scientific presentations performed
using visual aids and in front of a two-person audience.2
Our main contributions are as follows:
– We conduct an in-depth analysis of nonverbal features extracted from the
face, body pose, and speech for automatic presentation competency estima-
tion in videos when features per modality are used alone or when they are
fused. The features’ effectiveness is examined when they are extracted from
the whole video (so-called global features) and extracted from shorter video
segments (so-called local features) for classification and regression tasks.
These analyses are performed for a person-independent within the same
dataset, and a person-specific cross-dataset setting.
– Previous studies in the computational domain used different and non-structured
evaluation instruments for presentation competence. This study validates a
recently proposed evaluation metric, Tübingen Instrument for Presentation
Competence (TIP). We also present Youth Presents Presentation Compe-
tence Dataset and conduct the first analysis to compare various nonverbal
features and learning models in this data using TIP measures.
– 3-minute scientific presentations are emerging as an academic genre [18,29].
Such short scientific presentations are publicly available on the internet and
can also be used in combination with automated methods to estimate pre-
sentation competence. We initially validated the usability of short scientific
presentations for this purpose.
The remainder of this paper is organized as follows. Section 2 reviews related
work on automated public speaking competence estimation and assessment rubrics.
Section 3 describes the data sets and presentation competence instrument used
in our analysis. In Section 4, we describe the proposed method in detail. Experi-
mental analyses, the results of classification, regression and correlation analyses
and cross-data experiments are provided in Section 5. Lastly, we conclude the
paper and discuss the limitations and future work in Section 6.
2 Literature Review
Investigating the relationship between acoustic/visual nonverbal features (NFs)
and public speaking performance can contribute to the development of an auto-
mated platform for speaker training and/or assessment. Below, we review social
computing literature for public speaking performance analysis. There are several
studies, but they are restricted to a single type of NFs, lack the adequate sample
sizes, or have no differentiation in terms of speech types. Additionally, different
assessment rubrics used in psychology and education domains to measure pre-
sentation quality are discussed.
2
Different terms, such as public speaking or presentation, were used to refer a person
speaking in front of a group. In our study, we prefer using presentation and presen-
tation competence, however, to retain the original terminology used in the previous
works.4 Sümer and Beyan et al.
2.1 Estimating Presentation Competence
Early on, Rosenberg and Hirschberg [28] found correlations between acoustic
and lexical features of charismatic speech. Their defined acoustic features were
the mean, standard deviation, and maximum of the fundamental frequency (f0)
and speaking rate. Lexical features were defined as the number of first-person
pronouns, etc. Later, Strangert and Gustafson [34] found that speakers with
more dynamic f0 range were perceived more positively during political debates.
Although these works [28,34] provide preliminary research into public speaking
competence, they are limited by subjective rubrics, small datasets, and few fea-
tures. In addition to acoustic features (e.g., prosody and voice quality), Scherer
et al. [31] examined body, head, and hand motion-based NFs to investigate their
influence on the perception of political speeches. From eye-tracking data, they
found that human observers mainly concentrate on speakers’ faces when viewing
audio-visual recordings, but concentrate on speakers’ bodies and gestures when
viewing visual-only recordings.
In the education domain, the Multimodal Learning Analytics (MLA) data
corpus comprises of 40 oral presentations of students from the challenge work-
shop [23], including audiovisual recordings and slides. However, the manual as-
sessment criteria/rubrics used were not published. Using this corpus, Chen et
al. [8] applied a Support Vector Machine (SVM) and gradient boosting to the
combination of audio intensity, pitch, the displacement of body parts detected
by Kinect sensors, head pose, and slide features (e.g., the number of pictures
or grammatical errors). Using the same data, Luzardo et al. [20] utilized the
slide features (e.g., the number and size of text, pictures, tables) together with
the audio features (e.g., pause fillers, pitch average, pitch variation) and applied
an instance-based classifier. However, their approach is not suitable for public
speeches without visual aids and neglects speakers’ nonverbal features. Although
these studies used manually extracted verbal features, they promoted efforts for
semi-automatic speaking performance assessment.
Moving towards automated presentation assessment, Haider et al. [15] fo-
cused on prosodic and gestural features to categorize presentation quality as poor
vs. good. In total, 6376 audio features and 42 statistical features representing
hand motions were adapted for the classification of presentation classification.
More important, they demonstrated that multimodal NFs perform better than
using NFs of each modality alone. Specifically, it was found that presentation
quality factors highly correlate with each other. In other words, it is possible to
detect visual NFs with prosody features.
Continuing in the direction of multimodal features for automated assessment,
Wörtwein et al. [39] developed a model to assess and improve speaker perfor-
mance. Nine items measuring behavioral indicators (e.g., body pose, the flow of
speech, eye contact) were defined, and audiovisual data annotated via crowd-
sourcing was proposed. A relative annotation was performed by comparing two
videos displayed at the same time. Correlations between extracted NFs and be-
havioral indicators were shown. The extracted audio-visual NFs were also used to
train and make inference with ensemble classifiers. Conversely, Pfister et al. [24]Estimating Presentation Competence 5
claimed that highly persuasive speech requires a display of emotions consistent
with verbal content. They applied affective states recognized by audio-based NFs
for public speaking skill analysis and achieved 89% and 61% classification accu-
racy on average and within leave-one-speaker-out cross validation, respectively.
To the best of our knowledge, Chen et al. [7] and Ramanaraynanan [25] are
the only studies in the literature that utilize the public speaking competence
rubric (RSCP) [cite], a well established assessment rubric. The public speaking
performance ratings are automatically estimated using Support Vector Regres-
sion (SVR), Random Forest (RF), and generalized linear models. They use the
time-aggregated statistics and histogram of co-occurrences of NFs; head pose,
gaze, facial expressions, and body locations. The main drawbacks of these stud-
ies [7,25] are the evaluation on a limited size of data and poor performance for
some items in the rubric.
Table 1: Comparison of Assessment Rubrics for Presentation Competence.
Seperate
Target Sample (Interrater)
Assessment Rubric Item number items
level (#speech) Reliability
per NFs
Classroom Public (Form B)
higher – Cronbach coefficient:
Speaking Assessment 5 items/ 7 2
education from .69 to .91
Carlson et al. [5] 5-point scale
Public Speaking
higher 20 items/
Competency Instrument 7 1 n.a.
education 5-point scale
Thomson et al. [38]
– Ebel’s coefficient:
Competent Speaker
higher 8 items/ from .90 to .94
Speech Evaluation Form 7 12
education 3-point scale – Cronbach coefficient:
Morreale et al. [22]
from .76 to .84
Public Speaking
higher 11 items/ ICC:
Competence Rubric 7 45-50
education 5-point scale .54 ≤ r ≤ .93
Schreiber et al. [32]
– Cronbach coefficient:
Tübingen Instrument
high 22 items/ 161 (T1) from .67 to .93
for Presentation Competence 3
school 4-point scale 94 (T2) – ICC > .60 for 10
Ruth et al. [30]
out of 15 items
2.2 Assessment Rubrics for Presentation Competence
The ability of an automated system to decipher and report public speaking
competence is incredibly valuable. One way to realize this characteristic is to
use a systematic rubric that can address each possible NF as separate items.
The judgments made using such a rubric can also provide better training data
and can help human observers improve their confidence and rate of decision-
making [38].6 Sümer and Beyan et al.
Carlson and Smith-Howell [5] developed three evaluation forms for informa-
tive speeches. They tested these forms on two award-winning presenters’ speeches
with one speech made intentionally less informative by changing the delivery and
content of the speech. These speeches were evaluated by 58 individuals using the
evaluation forms. Two of the three forms showed higher inter-reliability (Cron-
bach’s α = .83 and .91). However, any of these forms include separate items
representing NFs individually. Instead, visual NFs are into one item as presen-
tation and delivery of all visual nonverbal cues.
A more recent instrument, namely, the Competent Speaker Speech Evalua-
tion Form [22], can be used to evaluate speeches in a class environment. It can
instruct students about how to prepare and present public speeches, and can
generate assessment data for the accountability-related objectives of academic
institutions. In this form, the acoustic NFs are defined as vocal variety in rate,
pitch, and intensity, but are still represented in a single item. Visual NFs are not
even defined. This kind of assessment may be suitable for classroom evaluation
purposes and training automated algorithms, but it does not help to identify
what is “insufficient” and can be improved in students’ individual presentations.
One of the most comprehensive assessment tools for reporting indicators
of objectivity, reliability, and validity is [32]. This rubric has 11-items (nine
core and two optional) with a 5-point scale (4-advanced, 3-proficient, 2-basic, 1-
minimal, and 0-deficient). The audio-based and video-based NFs are individually
considered as: “Representing how effective the speaker uses vocal expression and
paralanguage3 to engage the audience,” and “demonstrating the competence of
posture, gestures, facial expressions and eye contact that supports the verbal
message,” respectively. These items are more informative, but NFs have still not
been represented individually.
Unlike the aforementioned rubrics, Thomson and Rucker [38] described indi-
vidual items regarding a speaker’s speech volume, gestures, and eye contact as
being relaxed and comfortable as well as voice and body expressiveness. However,
this rubric lacks facial expressions and posture features.
In summary, even though these rubrics provide a suitable foundation for
public speaking performance assessment, there is an absence of more fine-grained
items that represent various NFs separately. A more detailed comparison of the
rubrics is presented in Table 1. In the current study, we use a more detailed
rubric, especially for assessing NFs, which is introduced in the next section.
3 Assessment Rubric and Data Sets
3.1 Tübingen Instrument for Presentation Competence
The items of the Tübingen Instrument for Presentation Competence (TIP) de-
pend on rhetorical theory and cover six faces of presentation competence: ad-
dressing the audience, structure, language use, body language & voice, visual aids,
3
Paralanguage is the field of study that deals with the nonverbal qualities of speech
(i.e. pitch, amplitude, rate, and voice quality).Estimating Presentation Competence 7
Table 2: Description of Tübingen Instrument for Presentation Competence (TIP)
Items.
ItemDescription
Addressing the audience
1 ... addresses the audience.
2 ... has a motivating introduction.
3 ... takes the listeners’ questions and
expectations into account.
Structure
4 ... introduces the presentation convincingly.
5 ... structures transitions convincingly.
6 ... ends the presentation convincingly
with a conclusion.
Language use
7 ... uses examples to create a tangible portrayal
of the topic.
8 ... uses appropriate sentence structures for oral
communication.
9 ... uses technical terms appropriately.
Body language & voice
10... has an effective posture.
11... employs gestures convincingly.
12... makes eye contact with the audience
convincingly.
13... uses facial expressions convincingly.
14... uses their voice effectively
(melody, tempo, volume).
15... uses their voice convincingly
(articulation, fluency, pauses).
Visual aids
16... uses an appropriate amount of visual information.
17... structures visual elements appropriately.
18... constructs an effective interplay
between the speech and visual aids.
19... creates visual aids which are visual attractive.
20... formulated an appropriately clear scientific ques-
tion.
21... appears confident in handling information.
22...’s reasoning is comprehensible.
and content credibility. In total there are 22 TIP items as shown in Table 2. All
items are in a 4-point Likert-type scale (1 = not true to 4 = very true).
As we aim to investigate the nonverbal behaviors for presentation compe-
tence, in the experimental analysis provided in Section 4 we only used the data
corresponding to items 10-15 (i.e., body language and voice). How the corre-8 Sümer and Beyan et al.
sponding ratings are used for regression and classification tasks are described in
Section 4.2.
3.2 Youth Presents Presentation Competence Dataset
The Youth Presents Presentation Competence Dataset was collected during the
second (T1) and third-round (T2) of the Youth Presents contest3 , a nation-
wide German presentation contest for secondary school students aged 12 to 20.
Informed consent was obtained from all students and their parents before the
study began, and the study protocol was approved by the ethics committee of
the University. Students who submitted their video presentations were first pre-
assessed by a jury and then selected for the second round. In this round, they
were asked to give a presentation in front of a jury on a scientific topic of their
choice. Their presentations were video-recorded and constituted the first set of
the Youth Presents (T1). After assessing these presentations, the best perform-
ing students were invited some weeks later to the third round. The third round
included an exercise presentation under standardized conditions that had no
consequences for the contest. These video-recorded presentations constitute the
second set of the Youth Presents (T2).
Both sets of the Youth Presents include three-minute presentations in front
of a jury consisting of two people. The presenters were using analog visual aids
(e.g. poster, object, experiments, notation on the blackboard). In some aspects,
the presentation tasks differed between T1 and T2. Relatively speaking, students
at T1 had more time to prepare: E.g., they were allowed to make analog visual
aids at home and chose the scientific content of their presentation. Students at
T2 were assigned the content of their presentation (microplastics in the environ-
ment) and had 40 minutes of preparation time. Additionally, they were provided
a set of text materials on the topic and visualization materials (i.e., three colored
pens and six white papers for a bulletin board).
Overall, 160 students delivered a presentation in the T1 condition. 91 of
those presented a second time at T2. The overall number was 251 videos and
the mean age of the students is 15.63 years (std = 1.91). Each video was rated
by four trained raters who were first introduced to the theoretical foundations
of presentation competence, familiarized with the rating items, and performed
exemplary ratings of video-recorded presentations that were not part of T1 and
T2. During the training process, the raters discussed their ratings based on
anchor examples in order to establish a common understanding of the rating
items. The overall training procedure took 36 hours. After the training, each
rater assessed all videos independently. The order of the videos was randomized
to avoid order effects.
For each TIP item, the interrater reliability was calculated using a two-way,
mixed, absolute, average-measures intraclass correlation coefficient (ICC) [21].
The results showed that among 22 items given in Table 2, 15 items at T1 (except
items 4, 8, 9, 10, 15, 17, 22) and 14 items in T2 (except 5, 7, 8, 9, 10, 17, 20, 22)
3
https://www.jugend-praesentiert.de/ueber-jugend-praesentiertEstimating Presentation Competence 9
exhibited ICCs above 0.60. High ICC value (> 0.60) indicates high interrater
reliability and implies that the criteria rated similarly across raters.
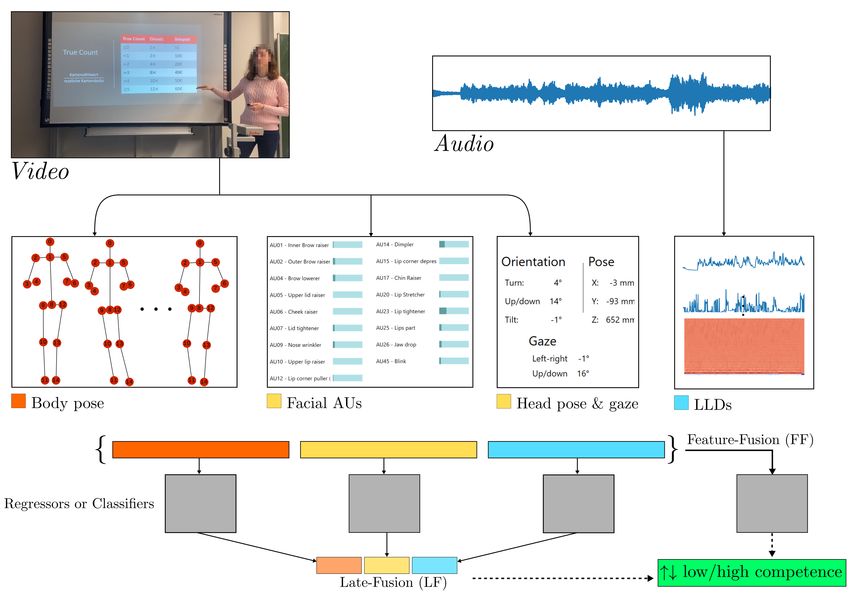
Fig. 1: Workflow of the proposed method for estimating presentation competence.
Our approach uses three main modalities, body pose and facial features from the
video and acoustic low-level descriptors (LLDs) from the audio. We investigate
different feature fusion (FF) and late fusion (LF) strategies (The used picture is
a representative of the dataset but not from the Youth Presents datasets).
4 Approach
This section describes our approach to estimating presentation competence from
audiovisual recordings of short presentations. We formulated the problem as both
classification and regression tasks. When the multimodal aspect of the problem
is considered, using different modalities is very crucial. The main features are
speech features acquired from acoustic signals and facial and body pose features
extracted from visual data.
Figure 1 summarizes the main workflow of our method for estimating pre-
sentation competence. Using audio and video, we first extract nonverbal features
that are relevant for the competence separately. Then, we investigate different
fusion strategies, feature-level fusion (FF), and late fusion (LF) using various
classifiers and regressors.10 Sümer and Beyan et al.
4.1 Nonverbal Feature Extraction
Speech Analysis-based NFs. Speech analysis is the most popular method to as-
sess presentation performance [24,8,39,10]. We used the state-of-the-art acoustic
features extraction tool, OpenSMILE [13], to obtain the extended Geneva Mini-
malistic Acoustic Parameter Set (eGeMAPS) [12], which constitutes 88 features
related to the audio signal.
Facial Analysis-based NFs. Facial feature extraction consists of the following
steps: face detection, facial keypoint estimation, head pose estimation, and FACS
action unit occurrence and intensity estimation. We used OpenFace 2.0 [1] based
on Multitask Cascaded Convolutional Networks (MTCNN) [42] for face detec-
tion, Convolutional Experts Constrained Local Model (CE-CLM) [41] for key-
point estimation and perspective n-point (PnP) matching for head pose estima-
tion. AU analysis was performed using Histogram of Oriented Gradients (HOG)
and linear kernel Support Vector Machines (SVM) on aligned face patches.
The 43 extracted facial features include the location of the head with respect
to the camera in millimetres, rotation angles in radians, eye-gaze directions in
radians, the estimated occurrence and intensity of the following action units:
Inner brow raiser (AU1), outer brow raiser (AU2), brow lowerer (AU4), upper
lid raiser (AU5), cheek raiser (AU6), lid tightener (AU7), nose wrinkler (AU9),
upper lid raiser (AU10), lip corner puller (AU12), dimpler (AU14), lip corner
depressor (AU15), chin raiser (AU17), lip stretcher (AU20), lip tightener (AU23),
lips part (AU25), jaw drop (AU26), and blink (AU45).
Body Pose NFs. We examined the use of body pose extracted using the Open-
Pose algorithm [4]. OpenPose estimates the 2-dimensional locations of body
joints (i.e., neck, shoulders, arms, wrists, elbows, hips) on video. Skeleton-based
data is being used in various problems, for instance, video action recognition,
human-computer interaction, and user interfaces, and it also helps to evaluate
a presentation. Two items among the TIP labels represent body pose; these are
item 10 (effective use of posture) and item 11 (employing gestures convincingly).
In the context of presentation competence, using body joints instead of RGB im-
age inputs further eliminates possible subjective bias (i.e., a presenter’s visual
appearance). We only used 15 joints with locations that were estimated more
reliably (depicted in Figure 1).
Global and Local Features Presentation videos are rated using the TIP
instrument globally per video, and the average video duration is 3 minutes.
However, this duration can contain behavioral cues that contribute to improved
presentation competence or vice versa. Understanding these cues in videos is
extremely valuable. There are two options to achieve better understanding: use
temporally global features or use temporally local features. Global features are
extracted from the entire video while local features summarize behaviors during
shorter intervals.Estimating Presentation Competence 11
item 10 (posture) item 10 (posture)
50 40
0 0
1 2 3 4 1 2 3 4
item 11 (gestures) item 11 (gestures)
50 40
0 0
1 2 3 4 1 2 3 4
item 12 (eye contact) item 12 (eye contact)
50 40
0 0
1 2 3 4 1 2 3 4
item 13 (facial expr.) item 13 (facial expr.)
50 40
0 0
1 2 3 4 1 2 3 4
item 14 (voice-1) item 14 (voice-1)
50 40
0 0
1 2 3 4 1 2 3 4
item 15 (voice-2) item 15 (voice-2)
50 40
0 0
1 2 3 4 1 2 3 4
overall (items 10-15) overall (items 10-15)
50 40
0 0
1 2 3 4 1 2 3 4
Fig. 2: Distribution of body language and voice items in T1 (on the left) and T2
(on the right) data sets. The red line on the overall plots show the median value
used from discretization.12 Sümer and Beyan et al.
A possible use case for presentation analysis is its deployment as a recom-
mender system in the educational domain to help students develop their pre-
sentation competence or in the field of therapy to assist people with autism
spectrum disorders [17,35,36,37]. In this context, localizing parts of a presen-
tation is necessary in order to understand which parts of a presentation are
effective in terms of body language and voice competence and which parts are in
need of improvement. As continuous annotation of competence in videos is more
time-consuming and requires raters with more advanced training, we use local
features extracted from 16-second time intervals and use video-level competence
items as labels.
Global features directly estimate video level competency. On the other hand,
in local features we retrieve the majority vote and the median of predictions in
classification and regression, respectively.
4.2 Classification & Regression
Presentation competence is a very complicated, multidimensional construct. For
instance, among the TIP items shown in 2, addressing an audience, structure,
and language require some understanding of a speech’s content; this is possible
using natural language processing and discourse analysis. In contrast, we focus on
items covering body language and voice that can be estimated through nonverbal
behavior analysis.
In this study, we formulated the problem as i) a classification or ii) a regres-
sion task. While performing regression, we estimated the average of items 10-15
(i.e., the items corresponding to nonverbal communication). In classification, we
discretized the ratings of the items 10-15 using the median of their distribution.
In that way, we obtained two classes as high or low. In Figure 2, the distribution
of items 10-15 is given for T1 and T2 sets of Youth Presents. When T1 and T2
sets were aggregated, the median of presentation competence is 2.83; thus, we
used this threshold to discretize continuous values in classification.
In total, four classifiers and regressors: Gradient Boosting (GB) [14], Decision
Tree (DT) [3], Random Forest (RF) [2], and Support Vector Machines (SVM)
[9,6] were applied. These classifiers and regressors were chosen because of their
use in the literature for automatic public speaking evaluation (see Section 2 for
more details). GB and RF were with 200 estimators. In SVM, rbf kernels and
C=10 were used. In all classifiers and regressors, the data is first normalized by
removing the mean and scaling to a unit variance of the training set.
4.3 Data Fusion
Estimating presentation competence necessitates understanding several modali-
ties at the same time. Presentation competence items also cover different aspects
of nonverbal behaviors. Thus, the fusion of various modalities is highly essen-
tial in the performance of presentation estimation. We compared feature-levelEstimating Presentation Competence 13
and late fusion. Feature level fusion combines speech, face, and body pose fea-
tures and trains a single classifier whereas late fusion combines decision scores
of classifiers trained on different feature modalities.
We used two main fusion methods: feature fusion (FF) and late fusion (LF).
In feature fusion, all input modalities are concatenated in feature-level into a
single feature descriptor, and then a single classifier or regressor is trained. In
late fusion, we used the median rule, product rule, and sum rule as follows:
(i) i
Pmed = M edian(Pm )
K
(i)
Y
i
Pprod = Pm
m=1
(1)
K
X
(i) i
Psum = Pm
m=1
where P is the probability retrieved from each classifier for class i. In regression
tasks, we applied only median rule on the continuous predicted values from all
input modalities.
5 Experimental Analysis & Results
In classification tasks, the evaluation metrics are accuracy, precision, recall, and
the average F1-score. They are given as follows:
TP + TN
Accuracy =
TP + TN + FP + FN
TP TP
P recision = ; Recall = (2)
TP + FP TP + FN
2 · P recision · Recall
F 1−score =
P recision + Recall
where TP, TN, FP and FN stand for true positive, true negative, false positive
and false negative, respectively. Positive class represents the high presentation
competence while negative class represents the low presentation competence.
For the regression task, we used Mean Squared Error (MSE; Eq. 3) and
Pearson Correlation Coefficients (p − values lower than 0.001; Eq. 4).
n
1 X
M SE = ( ) (yi − xi )2 (3)
n i=1
Pn
cov(X, Y ) (xi − x)(yi − y)
ρ= , r = pPni=1 (4)
σx σy 2
i=1 (xi − x) (yi − y)
2
where ρ; pearson coefficient value of 1 represents a perfect positive relationship,
-1 a perfect negative relationship, and 0 indicates the absence of a relationship
between variables x and y (i.e., distributions X and Y ) while r is the Pearson
Correlation estimate. In our case Y and n are the ground-truth and number of
samples, respectively.14 Sümer and Beyan et al.
Table 3: Estimating presentation competence using global and local features as
a classification task in T1 data set (N=160). Each result is the average and the
standard deviation of 10-fold cross validation. GB, DT, RF, SVM, FF, LF, S, F,
BP stand for Gradient Boosting, Decision Tree, Random Forest, Support Vector
Machines, feature fusion, late fusion, speech, face and body pose, respectively.
The best results are emphasized in bold-face.
Classification (global features)
Classification (local features, majority voting in video)
Modalities Method Accuracy Precision Recall F1-score
Modalities Method Accuracy Precision Recall F1-score
Speech GB 65.62 66.23 77.36 70.66
DT 58.13 61.75 64.49 61.61 Speech GB 65.62 66.35 74.46 69.49
DT 60.00 61.91 68.24 63.69
RF 66.25 66.98 76.49 70.40
RF 62.50 63.85 72.28 66.84
SVM 63.75 67.95 69.79 67.16 SVM 60.00 63.79 68.44 63.94
Face GB 57.50 61.03 64.44 61.51 Face GB 62.50 63.75 76.49 68.45
DT 63.75 68.17 66.06 65.46 DT 56.88 58.94 60.49 58.86
RF 60.62 62.19 71.68 65.62 RF 63.12 63.52 77.48 68.97
SVM 60.00 65.42 65.07 62.48 SVM 60.00 65.25 64.81 63.00
Body Pose GB 63.12 65.57 72.69 66.88 Body Pose GB 60.00 61.98 67.81 63.34
DT 53.12 57.27 59.76 56.19 DT 58.13 64.01 58.49 58.58
RF 61.88 62.31 75.46 67.36
RF 64.38 65.91 71.26 67.87
SVM 65.62 67.94 71.22 67.77
SVM 59.38 60.83 68.29 63.33
Fusion, GB FF 65.62 68.33 75.82 69.80
Fusion, GB FF 71.25 73.06 78.08 74.54 (S+F+BP) LF (med) 66.25 65.47 84.38 72.46
(S+F+BP) LF (med) 66.25 66.82 79.95 71.13 LF (prod) 66.25 66.78 83.67 72.45
LF (prod) 66.88 67.68 79.19 71.78 LF (sum) 65.62 65.89 83.67 72.06
LF (sum) 66.25 66.67 79.43 71.39
5.1 The-Same-Dataset Analysis
The results reported in this section include the-same-dataset analysis such that
we divided the T1 set into 10-fold so each resulting fold contains a similar number
of samples belonging to high or low classes. Meanwhile, if a video (or video
segment) belonging to one person exists in a training fold that person is not
occurring in the corresponding test fold. Thus, the aforementioned 10-fold cross
validation is person-independent.
Tables Table 3 and Table 4 report the classification and regression results
respectively for each nonverbal feature set (speech, face, and body pose), both
individually and when they are fused with feature fusion and late fusion strate-
gies.
Presentation competence labels represent the entire video. However, the abil-
ity to estimate presentation competence in shorter time intervals is highly de-
sirable because it can point to areas of low and high competence and would
allow researchers to use the proposed methods as part of a self-regulatory tool.
We chose 16-second intervals as an alternative to the global features, where all
features were aggregated during the entirety of each video. Considering that we
work on 3-4 minutes presentations, using 16-second intervals is a good balance
and allows having 10-15 sequences from a video on average.
The classification results in Table 3 show that using 16-second intervals does
not cause an explicit drop in classification performance. In contrast, it even
further improved the accuracy and F1-scores when facial features were used. InEstimating Presentation Competence 15
most of the feature and classifier combinations, the best performing classifiers
are GB and RF.
In feature and late fusion (Table 3), GB classifiers are used as a reference.
The performance of FF is 5.63% better in accuracy than the best performing
classifier when speech features were used 65.62%. The performances of different
late fusion approaches are on par. Using multi-modal NFs, i.e., the fusion of
all NF sets resulted in an increase in classification performance while the best
results were obtained with FF.
When the effect of using global or local features is examined in terms of
the best performance of each NFs group, there is no statistically significant
difference. However, there is a clear performance gain when local features were
used in some feature/classifier combinations, for instance, +6.24% in body pose
features and SVM classifier and +5% in facial features and GB classifier.
The results of regression tasks are depicted in Table 4. In regression, speech
features are the best performing one when single modality was used. In contrast
to the classification task where using local features improved the performance
in some feature and classifier combinations, using local features resulted in cor-
relation between the ground truth labels and predictions dropped significantly.
In fusion, feature fusion (FF) and late fusion (LF; by using only median rule)
were compared in GB regressors. FF performs better than LF (with Pearson r
of 0.61 and 0.56 in both global and local features, respectively), and also beyond
the best performing single modalities.
Table 4: Estimating presentation competence using global and local features as
a regression task in T1 data set (N=160). MSE is reported as the mean and the
standard deviation of 10-fold cross validation. Pearson correlation coefficients
are between the estimated and the ground truth values of all samples. All p −
values are lower than 0.001. GB, DT, RF, SVM, FF, LF, S, F, BP stand for
Gradient Boosting, Decision Tree, Random Forest, Support Vector Machines,
feature fusion, late fusion, speech, face and body pose, respectively.
Regression
Regression (local-features, averaged per video)
Modalities Method MSE Pearson r Modalities Method MSE Pearson r
Speech GB 0.09 ± 0.02 0.52 Speech GB 0.09 ± 0.04 0.50
DT 0.18 ± 0.07 0.26 DT 0.12 ± 0.05 0.35
RF 0.09 ± 0.03 0.51 RF 0.10 ± 0.04 0.43
SVM 0.08 ± 0.03 0.56 SVM 0.11 ± 0.04 0.38
Face GB 0.11 ± 0.02 0.37 Face GB 0.11 ± 0.04 0.31
DT 0.18 ± 0.06 0.30 DT 0.14 ± 0.07 0.19
RF 0.10 ± 0.02 0.44 RF 0.10 ± 0.03 0.40
SVM 0.10 ± 0.03 0.46 SVM 0.11 ± 0.04 0.32
Body Pose GB 0.11 ± 0.04 0.37 Body Pose GB 0.10 ± 0.04 0.43
DT 0.20 ± 0.03 0.19 DT 0.13 ± 0.04 0.25
RF 0.11 ± 0.03 0.36 RF 0.10 ± 0.04 0.41
SVM 0.12 ± 0.04 0.39 SVM 0.11 ± 0.05 0.32
Fusion, GB FF 0.08 ± 0.03 0.56
Fusion, GB FF 0.08 ± 0.02 0.61
(S+F+BP) LF (med) 0.09 ± 0.03 0.54
(S+F+BP) LF (med) 0.09 ± 0.03 0.5116 Sümer and Beyan et al.
5.2 The Cross-Dataset Analysis
The cross-dataset analysis refers to using a model trained on T 1 set to predict
the T 2 set (shown as T 1 → T 2 ). The T 1 → T 2 setting is important in order to
investigate the generalizability of a model trained with the employed NFs. Ad-
ditionally, we also tested the importance of rhetorical settings on the automated
analysis, and, in particular, the effect of variations in presentation topics and
the speakers’ background as related to the presented topic. We recall here that
the presentations in T 1 set each cover different topics while T 2 covers presen-
tations on the same topic. In the T1 set, the speakers picked their presentation
topic and had more time to prepare (implying that they might build a better
background regarding the topic) while in T2 the presentation topic was assigned
to the speakers with limited time to prepare.
We applied the same classifier, regressors, global, local features, FF and LF
fusions for the cross-dataset experiments as in Section 5.1. The entire T1 set was
used as a training set, and the models were evaluated on 10 folds of T2 data
set. Cross data set classification and regression results are given in Table 5 and
Table 6.
We should note that the T1 and T2 settings are different in terms of rhetorical
setting; however, the T2 data set is the subset of T1 participants. Thus, our cross-
dataset evaluation is not person-independent. In classification, global features’
performance in all modalities is considerably lower than in the same dataset
results. This is a clear sign of the effect of presentation setting on the estimation
of competence.
The gap between global and local features is more visible in cross-dataset
evaluation. The performance of speech and face deteriorated when local fea-
tures were used. On the other hand, body pose features exhibited a 10-30%
improvement in accuracy when local features composed of 16-second sequences
were used. Even the weakly supervised nature of video-wise labeling is consid-
ered and the entire T1 data set is also limited in size (N=160). Using shorter
trajectories further increased the size of the training set (N=1.8K) and yielded
even better results than person-independent performance on the same data set,
particularly in body pose features and fusion.
Looking into the cross-dataset regression results in Table 6 using GB regres-
sors, the use of local features negatively impacted performance (more than the
performance drop from global to local features in Table 4) with the exception
of speech features which performed even better than global features. This being
the case, when the problem is formulated as regression the use of local features
(shorter than the length of actual labels) negatively impacts both the same-
dataset and cross-dataset evaluation and should be avoided. In all regression
methods, gradient boosting regression with speech features is the best perform-
ing method that also retains a high correlation (varying from 0.50 to 0.61) with
ground truth labels.Estimating Presentation Competence 17
Table 5: Classification across tasks. All models were trained on the entire T1 set
and evaluated on T2 set. The average of accuracy of F1-scores in 10-folds were
reported.
Modalities/Method GB DT RF SVM
(global features) Accuracy / F1-score Accuracy / F1-score Accuracy / F1-score Accuracy / F1-score
Speech 57.89 / 56.26 56.89 / 51.99 57.00 / 48.72 66.89 / 53.83
Face 40.56 / 47.00 52.56 / 55.81 46.11 / 51.02 64.67 / 55.93
Body Pose 48.11 / 54.98 62.67 / 56.40 50.33 / 56.70 49.33 / 54.21
(S+F+BP)
FF 48.33 / 47.55 42.67 / 42.58 49.22 / 51.81 57.00 / 51.52
LF (med) 49.22 / 57.08 62.44 / 61.21 49.22 / 53.88 63.56 / 58.91
LF (prod) 52.44 / 57.48 69.22 / 45.31 49.22 / 55.80 59.33 / 54.07
LF (sum) 50.33 / 56.75 62.44 / 61.21 49.22 / 55.80 59.33 / 54.07
Modalities/Method GB DT RF SVM
(local features) Accuracy / F1-score Accuracy / F1-score Accuracy / F1-score Accuracy / F1-score
Speech 44.89 / 59.02 55.78 / 68.24 51.44 / 64.30 59.22 / 72.95
Face 60.33 / 75.09 68.00 / 79.76 68.00 / 80.67 70.22 / 82.39
Body Pose 79.22 / 88.31 52.78 / 66.59 79.22 / 88.31 78.11 / 87.56
(S+F+BP)
FF 64.89 / 78.54 57.11 / 72.29 66.89 / 77.74 74.78 / 85.49
LF (med) 71.44 / 83.24 56.00 / 70.99 72.56 / 83.99 77.00 / 86.90
LF (prod) 68.11 / 80.75 40.44 / 50.15 70.44 / 82.41 78.11 / 87.65
LF (sum) 68.11 / 80.75 56.00 / 70.99 70.44 / 82.41 78.11 / 87.65
Table 6: Gradient Boosting (GB) regression across task. All models were trained
on the entire T1 set and evaluated on T2 set. MSE is reported as the average
and standard deviation of 10-folds. Pearson correlation coefficients are between
the estimated and the ground truth values of all samples in T2 data set (N=91).
All p − values are lower than 0.05.
Modalities MSE Pearson r
Global features
Speech 0.12 ± 0.04 0.45
Face 0.14 ± 0.04 0.25
Body Pose 0.19 ± 0.04 0.21
FF 0.13 ± 0.04 0.41
LF (med) 0.13 ± 0.03 0.43
Local features
Speech 0.12 ± 0.01 0.51
Face 0.18 ± 0.04 0.01
Body Pose 0.18 ± 0.01 0.08
FF 0.16 ± 0.01 0.25
LF (med) 0.14 ± 0.01 0.4318 Sümer and Beyan et al.
5.3 Which feature is better?
When all three modalities, speech, face, and body pose features, were compared,
speech features outperformed face and body pose features in the same dataset
evaluation. With the exception of the DT classifier or regressor, speech features
consistently performed better than the other two features in both classification
and regression tasks. The fact that decision trees are weaker learning models than
GB, RF, and SVM is one possible explanation. Overall, speech features appear
to be the most dominant nonverbal cues to estimate presentation competence.
When visual nonverbal features, face and body pose, were considered, body
pose features were more efficient in most cases. The use of local features further
improved the performance (for instance, GB, RF, and SVM in cross dataset
classification, DT and SVM in same-dataset classification). These results indi-
cate that finer granularity of body postures leads to a better understanding of
competence. Beyond that, the labeling of prototypical body postures can further
improve classification and regression performance.
6 Conclusion
This study presented an analysis of computer vision and machine learning meth-
ods to estimate presentation competence. We used audiovisual recordings of a
real-world setting, the Youth Presents Presentation Competence Datasets. The
dataset contained different challenges: presentation time and free selection of
topics in the T1 data set and limited preparation time and predetermined top-
ics and preparation materials in the T2 data set. We used a recently proposed
instrument, Tübingen Instrument for Presentation Competence (TIP), and val-
idated that it could be used to train automated models to estimate presentation
competence.
We formulated presentation competence estimation as classification and re-
gression tasks and conducted nonverbal analysis of presenters’ behaviors. The
modalities used were speech (affective acoustic parameters of voice), facial fea-
tures (head pose, gaze direction, and facial action units), and body pose (the
estimated locations of body joints). Classification and regression methods were
gradient boosting (GB), decision trees (DT), random forests (RF), and support
vector machines (SVM).
In the-same-dataset, evaluation (T1), our classification approach reached
71.25% accuracy and 74.54% F1-score when early fusion was applied. In re-
gression, we could reach a mean squared error of 0.08 and Pearson correlation
of 0.61. In both settings, the feature-level fusion strategy performed better than
late fusion, combining the scores of separate models.
Training and testing in different rhetorical settings still seems difficult. Even
though the T2 set contains different speeches from the same persons, having
enough time to prepare and the ability to freely select a presentation topic
impacts classification and regression performance.
Estimating presentation competence in a finer granularity is a key priority
in the development of recommender systems that sense the nonverbal behaviorsEstimating Presentation Competence 19
and give feedback to the presenter. The use of shorter sequences (16-seconds)
and subsequent statistics of nonverbal features aggregated in these shorter time
windows does not deteriorate performance, but, rather, helps significantly in
cross-dataset evaluation.
Limitation. Automated methods to estimate presentation competence can be an
essential asset in education. Considering the importance of effective and success-
ful presentation competence in academic and professional life, such systems can
help students more effectively gain those competencies and provide additional
support for teachers. However, the use of automated methods must comply with
ethical standards and should only be deployed with the users’ consent.
From the perspective of fairness, in contrast to the raw image input in many
computer vision tasks, we used processed nonverbal behavioral features. For
instance, the datasets and algorithms that estimate attentional features (head
pose and gaze direction), emotional features (facial expressions and action units),
and body pose contain various subjects representative of different demograph-
ics. Still, dataset and algorithmic fairness are highly critical issues in the current
data-driven learning approaches. Beyond nonverbal feature extraction tasks, a
more diverse and large-scale dataset is necessary to accurately model all behav-
ioral differences (i.e., cultural variations) while delivering a presentation.
Future Work. In future work, we plan to increase the data scale to model all
behavioral variances more accurately. The personalization of presentation com-
petence models and development of recommender systems and user interfaces
are also among future research topics.
Acknowledgements. Ömer Sümer is a member of LEAD Graduate School &
Research Network, which is funded by the Ministry of Science, Research and the
Arts of the state of Baden-Württemberg within the framework of the sustain-
ability funding for the projects of the Excellence Initiative II. This work is also
supported by Leibniz-WissenschaftsCampus Tübingen “Cognitive Interfaces”.
Cigdem Beyan is supported by the EU Horizon 2020 Research and Innovation
Programme under project AI4Media (GA No. 951911).
References
1. T. Baltrusaitis, A. Zadeh, Y. C. Lim, and L. Morency. Openface 2.0: Facial be-
havior analysis toolkit. In 2018 13th IEEE International Conference on Automatic
Face Gesture Recognition (FG 2018), pages 59–66, Xi’an, China, May 2018. IEEE.
2. Leo Breiman. Random forests. Machine learning, 45(1):5–32, 2001.
3. Leo Breiman, Jerome H Friedman, Richard A Olshen, and Charles J Stone. Classifi-
cation and regression trees. belmont, ca: Wadsworth. International Group, 432:151–
166, 1984.
4. Zhe Cao, Gines Hidalgo, Tomas Simon, Shih-En Wei, and Yaser Sheikh. Openpose:
Realtime multi-person 2d pose estimation using part affinity fields, 2018.20 Sümer and Beyan et al.
5. Robert E. Carlson and Deborah Smith-Howell. Classroom public speaking assess-
ment: Reliability and validity of selected evaluation instruments. Communication
Education, 44(2):87–97, 1995.
6. Chih-Chung Chang and Chih-Jen Lin. Libsvm: A library for support vector ma-
chines. ACM transactions on intelligent systems and technology (TIST), 2(3):1–27,
2011.
7. L. Chen, C. W. Leong, G. Feng, C. M. Lee, and S. Somasundaran. Utilizing mul-
timodal cues to automatically evaluate public speaking performance. In 2015 In-
ternational Conference on Affective Computing and Intelligent Interaction (ACII),
pages 394–400, Xian, China, Sep. 2015. IEEE.
8. Lei Chen, Chee Wee Leong, Gary Feng, and Chong Min Lee. Using multimodal
cues to analyze mla’14 oral presentation quality corpus: Presentation delivery and
slides quality. In Proceedings of the 2014 ACM Workshop on Multimodal Learning
Analytics Workshop and Grand Challenge, MLA ’14, page 45–52, New York, NY,
USA, 2014. Association for Computing Machinery.
9. Corinna Cortes and Vladimir Vapnik. Support-vector networks. Machine learning,
20(3):273–297, 1995.
10. Ailbhe Cullen, Andrew Hines, and Naomi Harte. Perception and prediction of
speaker appeal – a single speaker study. Computer Speech & Language, 52:23–40,
2018.
11. Keith Curtis, Gareth J.F. Jones, and Nick Campbell. Effects of good speaking
techniques on audience engagement. In ACM ICMI, ICMI ’15, page 35–42, 2015.
12. F. Eyben, K. R. Scherer, B. W. Schuller, J. Sundberg, E. André, C. Busso, L. Y.
Devillers, J. Epps, P. Laukka, S. S. Narayanan, and K. P. Truong. The geneva
minimalistic acoustic parameter set (gemaps) for voice research and affective com-
puting. IEEE Transactions on Affective Computing, 7(2):190–202, 2016.
13. Florian Eyben, Martin Wöllmer, and Björn Schuller. Opensmile: The munich
versatile and fast open-source audio feature extractor. In Proceedings of the 18th
ACM International Conference on Multimedia, page 1459–1462, 2010.
14. Jerome H. Friedman. Greedy function approximation: A gradient boosting ma-
chine. Annals of Statistics, 29:1189–1232, 2000.
15. Fasih Haider, Loredana Cerrato, Nick Campbell, and Saturnino Luz. Presen-
tation quality assessment using acoustic information and hand movements. In
2016 IEEE International Conference on Acoustics, Speech and Signal Processing,
ICASSP 2016, Shanghai, China, March 20-25, 2016, pages 2812–2816, Shanghai,
China, 2016. IEEE.
16. Evelin Herbein, Jessika Golle, Maike Tibus, Ingo Zettler, and Ulrich Trautwein.
Putting a speech training program into practice: Its implementation and effects
on elementary school children’s public speaking skills and levels of speech anxiety.
Contemporary Educational Psychology, 55:176 – 188, 2018.
17. Mohammed (Ehsan) Hoque, Matthieu Courgeon, Jean-Claude Martin, Bilge
Mutlu, and Rosalind W. Picard. Mach: My automated conversation coach. In
Proceedings of the 2013 ACM International Joint Conference on Pervasive and
Ubiquitous Computing, UbiComp ’13, pages 697–706, New York, NY, USA, 2013.
ACM.
18. Guangwei Hu and Yanhua Liu. Three minute thesis presentations as an academic
genre: A cross-disciplinary study of genre moves. Journal of English for Academic
Purposes, 35:16 – 30, 2018.
19. Mark L Knapp, Judith A Hall, and Terrence G Horgan. Nonverbal communication
in human interaction. Cengage Learning, Wadsworth, 2013.Estimating Presentation Competence 21
20. Gonzalo Luzardo, Bruno Guamán, Katherine Chiluiza, Jaime Castells, and Xavier
Ochoa. Estimation of presentations skills based on slides and audio features. In
Proceedings of the 2014 ACM Workshop on Multimodal Learning Analytics Work-
shop and Grand Challenge, MLA ’14, pages 37–44, New York, NY, USA, 2014.
ACM.
21. K. O. McGraw and S. P. Wong. Forming inferences about some intraclass correla-
tion coefficients. Psychological Methods, 1(1):30–46, 1996.
22. S. Morreale, M. Moore, K. Taylor, D. Surges-Tatum, and L. Webster. Competent
speaker speech evaluation form, 2007.
23. Xavier Ochoa, Marcelo Worsley, Katherine Chiluiza, and Saturnino Luz. Mla’14:
Third multimodal learning analytics workshop and grand challenges. In Proceedings
of the 16th International Conference on Multimodal Interaction, ICMI ’14, pages
531–532, New York, NY, USA, 2014. ACM.
24. T. Pfister and P. Robinson. Real-time recognition of affective states from nonverbal
features of speech and its application for public speaking skill analysis. IEEE
Transactions on Affective Computing, 2(2):66–78, April 2011.
25. Vikram Ramanarayanan, Chee Wee Leong, Lei Chen, Gary Feng, and David
Suendermann-Oeft. Evaluating speech, face, emotion and body movement time-
series features for automated multimodal presentation scoring. In Proceedings of
the 2015 ACM on International Conference on Multimodal Interaction, ICMI ’15,
pages 23–30, New York, NY, USA, 2015. ACM.
26. Pooja Rao S. B, Sowmya Rasipuram, Rahul Das, and Dinesh Babu Jayagopi. Au-
tomatic assessment of communication skill in non-conventional interview settings:
A comparative study. In ACM ICMI, 2017.
27. Ronald E. Riggio and Howard S. Friedman. Impression formation: The role of
expressive behavior. Journal of Personality and Social Psychology, 50(2):421–427,
1986.
28. Andrew Rosenberg and Julia Hirschberg. Acoustic/prosodic and lexical correlates
of charismatic speech. In INTERSPEECH 2005 - Eurospeech, 9th European Con-
ference on Speech Communication and Technology, Lisbon, Portugal, September
4-8, 2005, pages 513–516, Lisbon, Portugal, 2005. ISCA.
29. Elizabeth Rowley-Jolivet and Shirley Carter-Thomas. Scholarly soundbites. Sci-
ence Communication on the Internet: Old genres meet new genres, 308:81–106,
2019.
30. Fabian Ruth, Evelin Herbein, Benjamin Fauth, and Olaf Trautwein, Ulrich Kramer.
Towards a psychometrically sound assessment of students’ presentation compe-
tence: The development of the tübingen instrument for presentation competence
(tip). in press, 2020.
31. Stefan Scherer, Georg Layher, John Kane, Heiko Neumann, and Nick Campbell.
An audiovisual political speech analysis incorporating eye-tracking and perception
data. In Proceedings of the Eighth International Conference on Language Resources
and Evaluation (LREC’12), pages 1114–1120, Istanbul, Turkey, May 2012. Euro-
pean Language Resources Association (ELRA).
32. Lisa M. Schreiber, Gregory D. Paul, and Lisa R. Shibley. The development and test
of the public speaking competence rubric. Communication Education, 61(3):205–
233, 2012.
33. R. Sharma, T. Guha, and G. Sharma. Multichannel attention network for analyzing
visual behavior in public speaking. In 2018 IEEE Winter Conference on Applica-
tions of Computer Vision (WACV), pages 476–484, Lake Tahoe, NV, March 2018.
IEEE.You can also read