ESTIMATING THE EFFECTS OF INTERNET EXCHANGE POINTS ON FIXED-BROADBAND SPEED AND LATENCY - ESCAP
←
→
Page content transcription
If your browser does not render page correctly, please read the page content below

ESTIMATING THE EFFECTS OF INTERNET
           EXCHANGE POINTS ON FIXED-BROADBAND
                    SPEED AND LATENCY

                                       Siope Vakataki ‘Ofa*

      The present paper provides estimates of the relationship between the
      number of Internet exchange points (IXPs) and fixed-broadband speed
      and latency in 74 countries from 2016 to 2019, using a balanced panel
      data set developed by the Economist Intelligence Unit for its “Inclusive
      Internet Index”. While in several studies, a positive role of IXPs on
      Internet speed and latency is established, a majority of the earlier ones
      are technical studies examining the traffic routes in specific networks.
      This paper contributes to this literature by triangulating earlier findings
      using an econometric model. The recent availability of the panel data
      set on IXPs, speed and latency by the Economist Intelligence Unit has
      made this exercise possible.

      The preliminary findings highlighted a statistically significant and positive
      relationship between the number of IXPs and fixed-broadband speed. For
      every 1 per cent increase in the number of IXPs per 10 million inhabitants,
      the fixed-broadband download speed (Kbps) is expected to increase
      by approximately 0.8 per cent. Despite the benefits of IXPs, challenges
      remain in establishing them, and collaboration and trust among several
      stakeholders (national and international) is required. These challenges
      pose important policy implications for policymakers in ensuring the
      sustainability of IXPs.

JEL classification: L96

Keywords: Internet exchange point, Internet speed and latency, panel data set, Asia
and the Pacific

* Siope Vakataki ‘Ofa, ICT and Development Section, ICT and Disaster Risk Reduction Division, United
  Nations Economic and Social Commission for Asia and the Pacific, Bangkok. An earlier version of
  the paper benefited from useful comments from the participants of the Pacific Working Group on
  “Strengthening efficient Internet traffic management through a subregional Internet exchange point
  (IXP) in Pacific Island countries”, held in Suva, from 3 to 5 December 2019. In addition, external ICT
  experts and two anonymous reviewers provided useful inputs. The views expressed in this paper
  are those of the author and should not necessarily be considered as reflecting the views or carrying
  the endorsement of the United Nations. All errors and omissions are the author’s sole responsibility.

                                                                                                     39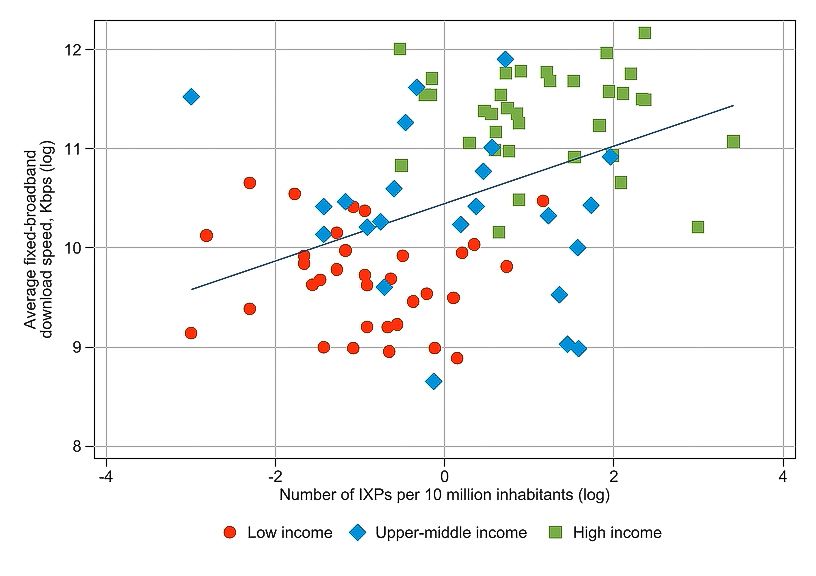
Asia-Pacific Sustainable Development Journal                             Vol. 28, No. 2, December 2021

                                        I. INTRODUCTION

   Access to the Internet contributes to socioeconomic development (Grace and
others, 2004; Qiang, Pitt and Ayers, 2004; ITU, 2012; Minges, 2015; Lubis and
Febrianty, 2018, among others). However, access to affordable and reliable broadband
connectivity is not universal and particularly challenging in countries with special
needs (least developed countries, landlocked developing countries and small island
developing States).

    According to the information and communications technology (ICT) statistics from
the Inclusive Internet Index 20201 of the Economist Intelligence Unit on fixed-broadband
access, speed (Kbps), latency2 (ms), and the affordability,3 the average access to fixed
and mobile broadband subscriptions are the highest in high-income countries (33
per cent and 121 per cent, respectively), compared to low-income countries (2 per
cent and 88 per cent, respectively). ESCAP (2016; 2017) highlighted the widening
digital divide, not only by income but also by geographic region. The average monthly
fixed-broadband upload (36,127 Kbps) and download (64,112 Kbps) speeds are the
highest in high-income countries, compared to lower Internet speeds in low-income
countries (13,005 Kbps and 14,521 Kbps, respectively).

    Latency on fixed-broadband (31 ms) and mobile-broadband (51 ms) are, on average,
lower in high-income countries compared to low-income countries (45 ms and 82
ms, respectively). On average, fixed-broadband (1 per cent)4 and mobile-broadband
services (0.7 per cent) are affordable in high-income countries, compared to low-
income countries (13 per cent and 2 per cent, respectively). ESCAP and National
Information Society Agency (2016, p. 33) measured the Internet speed and traffic in
CLMV (Cambodia, the Lao People’s Democratic Republic, Myanmar, and Viet Nam)
countries and highlighted that most of the international traffic of these countries have
been exchanged outside the region (in North America or Europe).

1
     Economist Intelligence Unit, Internet Inclusive Index webpage (https://theinclusiveinternet.eiu.com/).
2
     Delay it takes to send information from one point to another in milliseconds (ms).
3
     Monthly expenditure on broadband services as a percentage of gross national income per capita.
4
     According to the United Nations Broadband Commission, a target of broadband services should
     be made affordable in developing countries at less than 2 per cent of monthly gross national income
     per capita by 2025. For further details, refer to www.broadbandcommission.org/broadband-targets/.

40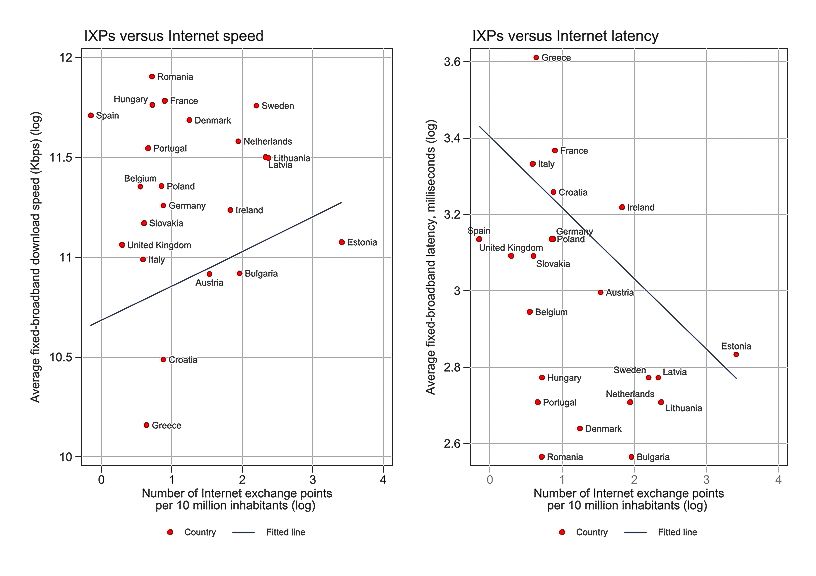
Estimating the effects of Internet exchange points on fixed-broadband speed and latency

    A national Internet exchange point (IXP) facilitates access of users to online services
and improves the affordability and quality of Internet services. It is a physical location
where different Internet provider networks connect to exchange traffic with each other
using a copper or fibre-optic cable through one or more Ethernet switches or servers
(Internet Society, 2014, p. 6). The key role of a national IXP is to improve the national
Internet traffic network performance (Internet speed in Kbps and latency – delay it
takes to send digital information5 from one point to another in milliseconds (ms), by
keeping local Internet traffic local and to reduce the costs (transit price (US$/Mbps))
associated with traffic exchange between networks.

    A national IXP significantly improves the efficiency of Internet traffic, resulting
in cost savings. This is made possible by eliminating the routing of Internet traffic
through expensive long-distance traffic routes outside the country before returning
back to the country. Consolidating national traffic from different networks significantly
improves national Internet traffic network management and eliminates the need for
multiple physical links between local network operators and international operators.
In addition, download speed for websites improves significantly, thereby encouraging
the development of new local content and services and providing opportunities
for productive use of Internet for other purposes (for example, e-commerce or
e-government services).6

    Past research literature (mostly from the technology side) has pointed to the
positive effects of IXPs on improving Internet speed and latency. After testing the
latency of Internet traffic going through IXPs, Ahmad and Guha (2012, p. 10) found
that the traffic encountered lesser delays than normal links, even though the presence
of IXPs did not decrease the length of an Internet network path. Galperin (2013, p. 21)
analysed IXPs in Latin America and the Caribbean and concluded that they reduced
access costs, increased Internet quality, encouraged infrastructure investments in
isolated communities and promoted knowledge transfer. Indeed, policymakers in Latin
America and the Caribbean, as well as in Africa, recognize the important role of IXPs
as a national asset with clear benefits to a country’s Internet network architecture
(ITU, 2013a, p. 18; 2013b, p. 37).

5
    For example, if one person sends an email (digital information) from Bangkok to another person in
    Chiang Mai (within Thailand), the delay (measured in milliseconds) that takes for the digital information
    (email) to be received by the person in Chiang Mai is affected by the presence of a national Internet
    exchange point.
6
    For a discussion on the benefits of IXPs, refer to Internet Society (2014).

                                                                                                          41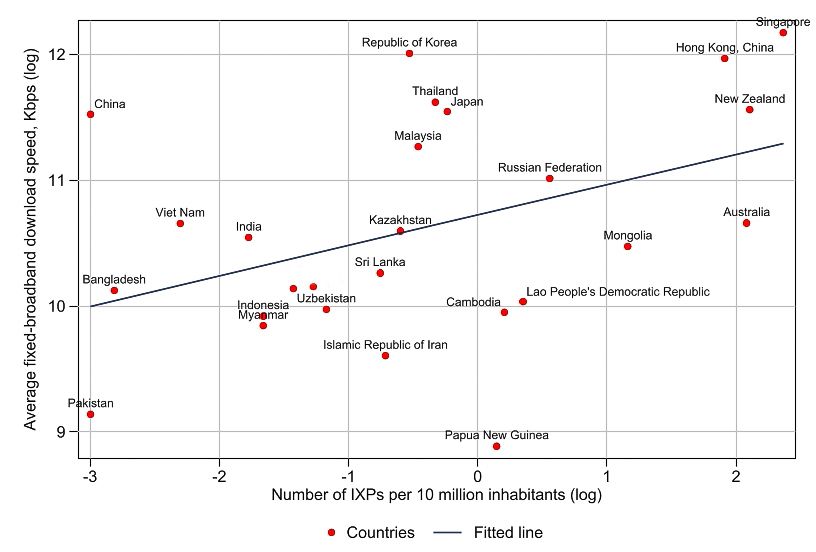
Asia-Pacific Sustainable Development Journal                  Vol. 28, No. 2, December 2021

       Internet Society (2015, p. 2) noted the benefits of IXPs:

       (a) Lowers Internet-access costs for end users by decreasing Internet service
           provider (ISP) operating costs and making Internet access more affordable
           for a greater number of local Internet users in a country or region;

       (b) Ensures that Internet traffic between local senders and local recipients
           use cheap local connections, rather than expensive international links. In
           some countries, up to 20 per cent of local Internet traffic can make up a
           significant portion of the overall Internet traffic of an ISP;

       (c) Creates efficient interconnection points that encourage network
           operators to connect in the same location in search of beneficial peering
           arrangements, cheaper and better traffic exchange, and other information
           and communication services;

       (d) Attracts out-of-country service operators. A single connection to an IXP
           provides out-of-country service operators with lower collective access
           costs to multiple potential local customers;

       (e) Contributes to the development of the local Internet ecosystem and
           local service hosting/local content development. An IXP creates a local
           environment that attracts a variety of other services, including domain
           name servers and content and web caches;

       (f) Improves local users’ quality of access by providing more-direct network
           connections for local content producers and consumers;

       (g) Enhances the level of stability and continuity of access, namely the IXP
           switching, capability by providing additional flexibility in redirecting Internet
           traffic when there are connectivity problems on the network. For example,
           if there is a breakdown in international connectivity, an IXP can keep local
           traffic flowing within the country;

       (h) Internet exchange points are not expensive to establish. The cost of the
           equipment required to establish an IXP is usually minimal, making the
           establishment of an IXP an affordable local project. Under a sustainable
           funding and management model, ISPs and other network operators, which
           benefit from using IXPs, can often cover the initial start-up and monthly
           operating costs.

   ESCAP and National Information Society Agency (2016, p. 54) highlighted that
IXPs should be designed to identify the best way to connect traffic routes to each
destination. In particular, IXPs should be neutral and open to any operator. In addition,

42
Estimating the effects of Internet exchange points on fixed-broadband speed and latency

they stressed that all stakeholders should be involved in the establishment of IXPs
to agree on a common principle on the traffic management. The principle may
include the following: the requirement for exchanging of routing information with all
Internet service providers connected to the IXPs; and the need to establish a neutral
organization capable of operating and managing IXPs.

     While recognizing the technical benefits of IXPs, establishing one, especially when
it involves operators from several countries to connect, is not clear cut. Many IXPs
are set up for public service (non-commercial reasons), requiring the collaboration
of all ISPs in a country. However, its subsequent success relies on the willingness
of ISPs to cooperate and connect their respective traffic through a common IXP. In
many cases, these ISPs are often competitors with each other. Accordingly, a great
deal of time and resources are required to consolidate and build trust among several
actors who may be competitors in a market. This challenge is further complicated
when ISPs from several countries need to agree on interconnection through a common
IXP.

   Other challenges on establishing an IXP are the difficulty in establishing (a) a
neutral physical location and operation of an IXP which is agreed upon by all IXP
parties and is not in a government office or private sector facility and (b) a neutral
operation/governance by a non-governmental organization not linked to government
or a private sector (Internet service provider).

                II. INTERNET EXCHANGE POINT (IXP) TRENDS

    National IXPs have been deployed in many countries around the world. North
America (driven by the United States of America) and Europe are the two major
regions with the highest number of IXPs per 10 million inhabitants.7 This is followed
by Latin America and the Caribbean, Asia and the Pacific, and Africa (see figure 1).
The development of IXPs is also prevalent in high-income countries, as compared
to low-income countries (see figure 2). As a result, the development of IXPs (per 10
million inhabitants)8 are severely lacking in the low-income countries of Africa, and
Asia and the Pacific.

7
    Further discussion on this variable reported by the Inclusive Internet Index database (https://
    theinclusiveinternet.eiu.com/) of the Economist Intelligence Unit, for better reflection of the level of
    IXPs within countries/regions, is in the next section.
8
    The conversion of the raw number of IXPs into a rate (per 10 million inhabitants) for each country
    allows for comparison across countries. In general, the greater the population (or population rate
    in 10 million inhabitants) of a country, the more market (or potential) to be served, the more ISPs
    are present to benefit from such a large market, and the more need for IXPs to be established to
    ensure Internet efficiency.

                                                                                                         43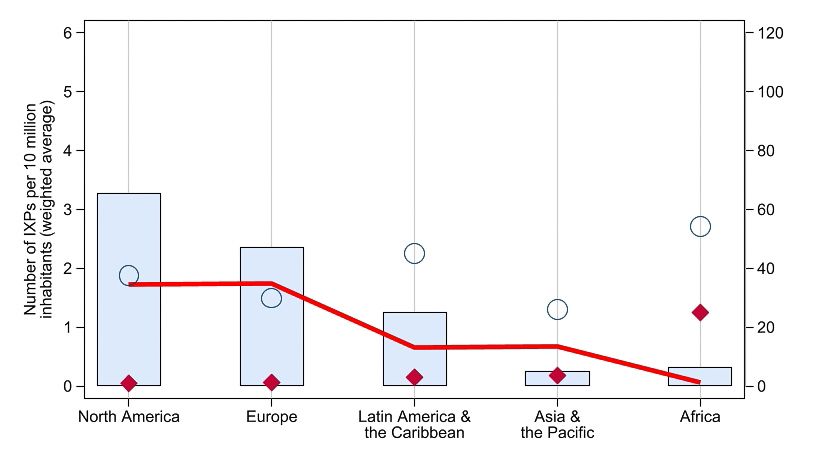
Asia-Pacific Sustainable Development Journal                                         Vol. 28, No. 2, December 2021

                  Figure 1. Internet exchange points by major regions

                Left-hand side: Number of IXPs per 10 million     Right-hand side: Access - Fixed-broadband subscriptions
                inhabitants (weighted average)                    per 100 inhabitants (weighted average)
                Right-hand side: Latency – Average                Right-hand side: Affordability – Expenditure on fixed-broadband
                fixed-broadband latency / ms (weighted average)   as percentage of GNI/capita (weighted average)

Source:   Economist Intelligence Unit, Inclusive Internet Index 2020 database. Available at
          https://theinclusiveinternet.eiu.com/ (accessed on 27 February 2020).

    For a better understanding on the role of IXPs and the efficiency of fixed-broadband
speed and latency in countries across the world, IXP developments can be assessed
against broadband efficiency indicators, namely access to fixed-broadband and its
latency and affordability. When the trend on access to fixed-broadband subscriptions
per 100 inhabitants is compared against the IXP trend for major regions, a similar
pattern follows. This is, access to fixed-broadband subscription is higher in North
America and Europe, as compared to Asia and the Pacific, and Africa. This pattern is
also found across different countries’ income-levels (figure 2). High-income countries
with the highest number of IXPs (per 10 million inhabitants) have experienced the
highest access to fixed-broadband subscription. On the other hand, low-income
countries with the lowest access to fixed-broadband subscription experienced the
lowest number of IXPs.

44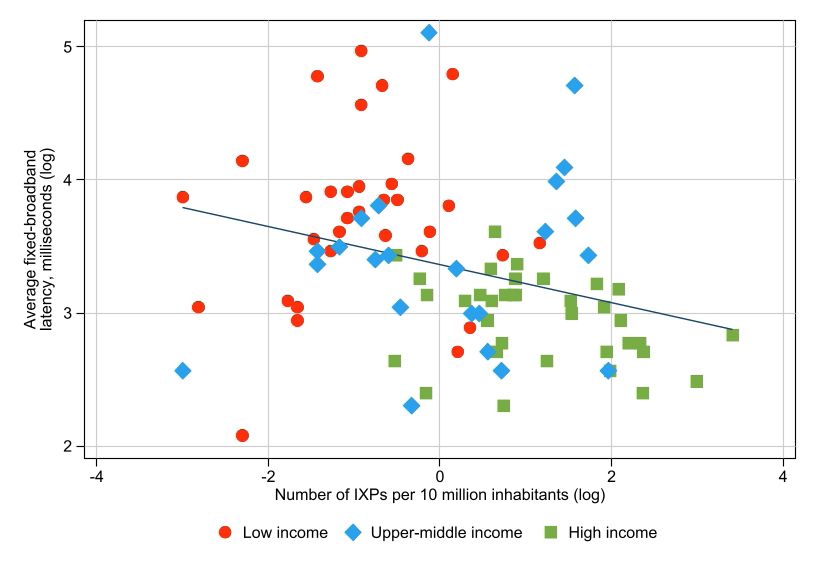
Estimating the effects of Internet exchange points on fixed-broadband speed and latency

                                                        Figure 2. Internet exchange points by income group
    Number of IXPs per 10 million inhabitants
              (weighted average)

                                                          Left-hand side: Number of IXPs per 10 million        Right-hand side: Access – Fixed-broadband subscriptions
                                                          inhabitants (weighted average)                       per 100 inhabitants (weighted average)
                                                          Right-hand side: Latency – Average fixed-broadband   Right-hand side: Affordability – Expenditure on fixed-broadband
                                                          latency / ms (weighted average)                      as percentage of GNI/capita (weighted average)

Source:                                         Economist Intelligence Unit, Inclusive Internet Index database. Available at
                                                https://theinclusiveinternet.eiu.com/ (accessed on 27 February 2020).

    Affordability (monthly expenditure on fixed broadband as a percentage of gross
national income per capita) 9 of fixed-broadband subscription is the lowest (very
affordable) in high-income countries, as compared to low-income countries (figure 2).
A majority of these low-income countries are in Africa, and Asia and the Pacific, while
affordable fixed-broadband subscriptions are available in North America and Europe.

    At the country level, the number of IXPs per 10 million inhabitants varies significantly
among countries (see annex figure A.1). The top 10 countries with the highest number
of IXPs per 10 million inhabitants are Estonia, Bahrain, Lithuania, Singapore, Latvia,
Sweden, New Zealand, Australia, Trinidad and Tobago, and Bulgaria. The majority
(four countries) of them are in Europe, followed by the Asia-Pacific region (three
countries). The 10 countries with the lowest IXPs per 10 million inhabitants are Algeria,

9
    The United Nations Broadband Commission considers a target of less than 2 per cent as affordable.

                                                                                                                                                                       45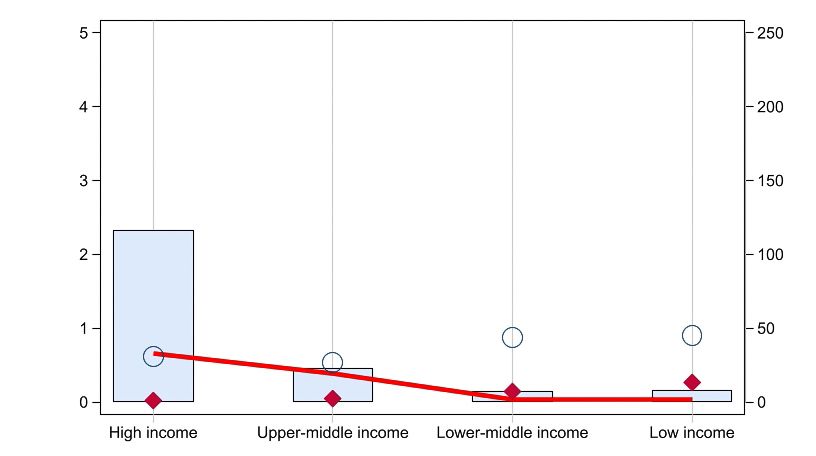
Asia-Pacific Sustainable Development Journal                                 Vol. 28, No. 2, December 2021

Azerbaijan, El Salvador, Ethiopia, Guatemala, Nicaragua, Oman, Venezuela, Qatar and
China. The majority of these countries (four) are in South America, followed by Africa
(two) and Asia (two). The IXP variable is, therefore, a useful indicator for producing
a holistic picture of the development of IXPs in each country.

    In terms of fixed-broadband speed (upload and download, Kbps), speed is faster
in high-income countries, as compared to low-income countries (see figures 2 and 3).
High-income countries have invested more on modern ICT infrastructure connectivity,
resulting in faster fixed-broadband speed.

                           Figure 3. Fixed-broadband speed (Kbps)

Source:   Economist Intelligence Unit, Inclusive Internet Index 2020 database. Available at
          https://theinclusiveinternet.eiu.com/ (accessed on 27 February 2020).

   On the other hand, low-income countries have less advanced ICT infrastructure
connectivity and as a result, fixed-broadband speed is low. This trend is consistent on
both connectivity technologies (mobile-broadband and fixed-broadband) commonly
used for communications.

46
Estimating the effects of Internet exchange points on fixed-broadband speed and latency
The latency (ms) trend shows a reverse relationship with the IXP trend. This is,
high-income countries have the lowest Internet latency, as compared to the low-
income countries, which tend to have the highest Internet latency (figures 2 and 4).
Similarly, at the region level, Africa has a lower number of IXPs and a higher Internet
latency compared to North America and Europe.
There are similar trends related to fixed-broadband latency (ms); shorter delays
were experienced in networks of high-income countries compared to low-income
countries in 2020 (figure 4). Fixed-broadband latency (ms) is a complex challenge
with multidimensional causes. Zaki and others (2014, p. 244) highlighted that slow
Internet in developing countries was due to geographic locations (further distances
create higher latency); infrastructure challenges (low bandwidth links and high network
contents); and routing problems (inefficient protocols and architectural issues, such
as content distribution networks server placement).
Figure 4. Fixed-broadband latency (ms)
Source: Economist Intelligence Unit, Inclusive Internet Index 2020 database. Available at
https://theinclusiveinternet.eiu.com/ (accessed on 27 February 2020).
47Asia-Pacific Sustainable Development Journal Vol. 28, No. 2, December 2021
According to the Inclusive Internet Index 2020 statistics, the average latency
(ms) on fixed-broadband subscriptions is the highest in Africa (56 ms), followed by
Latin America and the Caribbean (38 ms), North America (25 ms), Europe (22 ms)
and Asia and the Pacific (21 ms). As for broadband subscriptions, latency is the
shortest in Europe (39 ms), North America (49 ms), Asia and the Pacific (48 ms), Latin
America and the Caribbean (51 ms), and Africa (52 ms). Africa is the major group
with highest delays on broadband subscriptions. In addition, latency (ms) is lowest
in fixed-broadband technology compared to mobile-broadband technology.
In summary, the development of IXPs is prominent in higher-income countries
and vice versa. In addition, countries with a higher number of IXPs per 10 million
inhabitants also tend to have greater access to broadband subscriptions, less
broadband latency, and more affordable broadband. These trends raise important
policy questions about the role of IXPs on fixed-broadband efficiency (in terms of
latency and speed), particularly, in countries where IXPs are predominantly missing,
namely low-income countries with less access to broadband Internet, higher latency,
and unaffordable broadband access).
III. ANALYTICAL FRAMEWORK
The literatures from technology and communications discussed in an earlier section
point to a positive relationship between the presence of an IXP and efficiency of
Internet traffic in countries. Most of these studies are technical and focus on assessing
the relationship between the two variables using national surveys or online tools to
measure traffic routes. Limited attention, however, has been given to statistically
evaluating this relationship. In this present paper, attempts were made to fill that
gap by empirically testing the relationship between the number of national IXPs and
fixed-broadband speed and latency.
Accordingly, in the present paper, the efficiency (speed and latency) of fixed-
broadband traffic flow exchanged between different ISPs within a country improve,
namely speed increases result in a decrease in latency as the number of IXPs increases
is hypothesized. The hypothesized relationships between the main independent and
dependent variables are summarized in table 1.
48Estimating the effects of Internet exchange points on fixed-broadband speed and latency
Table 1. Main independent and dependent variables
Independent variable Dependent variables
Presence of Internet exchange points Efficient fixed-broadband traffic flow
Quantitative measures: Quantitative measures:
• Number of IXPs per 10 million • Fixed-broadband download speed (Kbps) (+)
inhabitants (+)
• Latency (fixed-broadband latency) (average, ms) (-)
Source: Author’s consolidation.
Notes: (+) positive correlation (increasing); (-) negative correlation (decreasing).
The relationships between the efficiency (speed and latency) of fixed-broadband
and the number of IXPs assume the following model specification:
(1) i,t + β6G
FixBroEffi,t = αi + β1Ixpi,t + β2FixBroi,t + β3CabStai,t + β4 NetCovi,t + β5NeuPol
+ β3CabSta i,t + β4 NetCovi,t + β5NeuPoli,t + β6Gdpi,t + β7Popi,t + εi,t
i = 1, 2,…, N; t = 1, 2,…, T,
where FixBroEffi,t = isαthe
i + βnatural
1Ixpi,t + βlogarithm
2FixBroi,t + β of3CabSta i,t + β4 NetCov
the efficiency + β5NeuPoli,t + β6Gdp
ofi,tfixed-broadband speed
i,t
+ β7Popi,t + εi
(Dep. Var 1) and latency (Dep. Var 2) in country i at time t. The FixBroEff coefficient
i,t
= αi +is β Ixpi,t + β2Fix
1the
CabStai,t +unknown
β4 NetCovi,tintercept
+ β5NeuPolfor i,t + β6 Gdp
country i,t
+ i,
β 7 Pop
whilei,t
+ εi,t is the error term representing the effect
of the variables that were omitted by the model in country i at year t. The number
of countries included are N = 74 countries with number of time-series T = 4 years.
t
= αi + β1Ixpi,t +isβ2the
FixBro i,t + β3CabStavariable
independent i,t + β4 NetCov i,t + β5NeuPol
(natural i,t + β6of
logarithm Gdp + β7Pop
number
i,t
+ εi,t per 10 million
ofi,t IXPs
inhabitants) in country i in year t. It is, therefore, expected that an increase in the
number of IXPs is also associated with an improvement in efficient fixed-broadband
traffic flow (positive correlation with speed, and negative correlation with latency).
As discussed in the previous section, the presence of the independent variable
(number of IXPs per 10 million inhabitants) is common in higher-income countries.
In addition, countries with higher IXPs also tend to have higher fixed-broadband
access, lower latency and more affordable broadband access.
49Asia-Pacific Sustainable Development Journal Vol. 28, No. 2, December 2021
Other control variables are the log-transformed 10 of the following: access to
fixed-broadband subscriptions per 100 inhabitants (FixBroEff ); cross-border
i,t
= αi + β1Ixpi,tconnectivity
+ β2FixBroi,t + β3CabSta
− number of cable landing FixBroEff stations i,tper = α10 i + βmillion
1Ixpi,t + β 2FixBroi,t + β3(CabStai,t
inhabitants ); +last-mile
β4 NetCovi,tICT
+ β5NeuPoli,
infrastructure connectivity − percentage of population covered by 3G network;
bSta
= αii,t++ββ1Ixp
4(NetCov
i,t
+ βi,t
2FixBro
); + β5NeuPol
economic i,t + β3i,tdevelopment
CabSta
+ β6Gdpi,t + β+ NetCov
β−
i,t 4 7
Pop
GDP ++ε(US$
i,ti,t
β5NeuPol
i,t i,t + β6(Gdpi,t
billions) ); + β7Pop
and market
i,t
+ εi,tsize − population
uPoli,t + β6(millions)
Gdpi,t + β7(Pop). i,t
+
In ε
addition,
i,t a technology-neutrality policy for spectrum use − qualitative rating
β3CabStai,t(0-1,
+ β4 NetCov i,t + β5(NeuPol),
1 = best) i,t +
wasβ6Gdp used
i,t
+ β
to
7 Pop control
i,t
+ εi,t for the sector’s policy environment.
Relationships between dependent, independent and control variables were
tested using the fixed effects method. Baltagi (2005, p. 1) best captured the benefits
of fixed effects by highlighting that the fixed-effects method is effective when the
question of interest controls for individual heterogeneity (variable that changes over
time but not across entities). Baltagi (2005, p. 4) further stated that panel data give
more information, more variability, less collinearity among variables, more degrees
of freedom, and more efficiency in estimation. In addition, panel data are more
effective in identifying and measuring the effects that are not detectable in non-panel
structured data sets. However, Baltagi (2005, p. 13) also highlighted the limitations
of the fixed-effects method linked to the collection of data for the panel data set
(problems with designing and data collection, missing observation and high costs
of data collection).
With respect to the appropriateness of the use of fixed-effect method, the
Sargan-Hansen statistics 11 had rejected the null hypothesis that the errors are
correlated with the exogenous variables in the model, and therefore, the fixed-effect
method is the preferred method. The modified Wald test12 indicated the presence of
heteroskedasticity, and accordingly, the Huber/White estimator was used to obtain
heteroskedasticity-robust standard errors.
An objective of this paper is to assess the relationship between IXPs and fixed-
broadband speed and latency in 74 countries between 2016 and 2019. The fixed-effect
method is, therefore, ideal in analysing the impact of a particular variable that varies
over time. In addition, the fixed-effect method controls for any potential correlation
within the country and between the independent/dependent variables that may render
the estimation bias, by removing the effect of those time-invariant biases.13
10
Variables’ distributions were not symmetric, hence the need for log-transformation.
11
Sargan-Hansen statistic = 18.523, Chi-sq(7), P-value = 0.009.
12
Modified Wald test chi2(85) = 9.5, Prob>chi2 = 0.0000.
13
For further details, refer to Baltagi (2005).
50Estimating the effects of Internet exchange points on fixed-broadband speed and latency
IV. DATA
For this paper, a balanced short panel of 74 countries from 2016 to 2019 is used.
The panel data set was developed and maintained by the Economist Intelligence Unit
(EIU), for computing the Inclusive Internet Index.14
The Inclusive Internet Index is comprised of 53 indicators categorized under four key
areas: availability, affordability, relevance, and readiness. “Availability” consolidates
the scores from indicators that measures the quality and depth of infrastructure for
access, including Internet use, the quality of the Internet connection, and the type and
quality of infrastructure available for Internet and electricity access. “Affordability”
consolidates scores on indicators for cost of access relative to income level and
competition in the ICT market. “Relevance” looks at the existence and extent of local
language content. This key area measures the perceptions on the value of being
connected to the Internet by users in terms of useful local contents and services.
“Readiness” measures the capacity of users to take advantage of access to the
Internet for productive use.
Each of the four key areas receives a score calculated from a weighted average
of the underlying indicator scores and then scaled from 0 to 100 (100 indicates the
highest/strongest). The overall country score (adjusted) is a weighted average of
the four key areas’ scores. Further details on the methodology for calculating the
Index can be accessed from the Methodology Report.15 Variables categorized under
each key area are listed in table 2. A list of all variables is shown in annex table A.1.
14
The Economist Intelligence Unit (EIU), The Inclusive Inter net Index 2019. Available at
https://theinclusiveinternet.eiu.com (accessed on 28 October 2020).
15
Ibid.
51Asia-Pacific Sustainable Development Journal Vol. 28, No. 2, December 2021
Table 2. The Inclusive Internet Index 2019 – key areas of focus
1. Availability 2. Affordability 3. Relevance 4. Readiness Background
(20) (7) (10) (21) variables (25)
1.1. Usage (5) 2.1. Price (4) 3.1. Local content 4.1. Literacy (4) Social,
(3) economic
& political
1.2. Quality (7) 2.2. Competitive 3.2. Relevant 4.2. Trust & variables (25)
environment (3) content (7) safety (6)
1.3. Infrastructure (6) 4.3. Policy (11)
1.4. Electricity (2)
Source: Author’s consolidation based on the Economist Intelligence Unit (EIU), The Inclusive Internet Index 2019.
Available at https://theinclusiveinternet.eiu.com (accessed on 28 October 2019).
Note: Numbers in brackets show the number of variables under each category and subcategory.
The data set is extremely useful for this study, as it is the first of its kind to
collect statistics for most countries (100 countries in the 2020 version) on the number
of IXPs per 10 million inhabitants on a yearly basis, allowing for a format that can
be used for econometric testing. While the International Telecommunications Union
(ITU) collects most of the ICT statistics through its annual World Telecommunication/
ICT Indicators database,16 it does not include statistics on IXPs.
Other credible data sets with ICT indicators, such as World Development Indicators
from the World Bank17 and the Networked Readiness Index from the World Economic
Forum,18 do not collect statistics on the number of IXPs per population. While many
online platforms, such as the TeleGeography Internet Exchange Map, 19 and the
Internet Society IXP platform,20 provide statistics on the number of IXPs in each
16
ITU, World Telecommunication/ICT Indicators database. Available at www.itu.int/en/publications/
ITU-D/pages/publications.aspx?parent=D-IND-WTID.OL-2019&media=electronic (accessed on 28
October 2019).
17
World Bank, World Development Indicators. Available at https://data.worldbank.org/ (accessed on
28 October 2019).
18
World Economic Forum, Networked Readiness Index. Available at http://reports.weforum.org/
global-information-technology-report-2016/networked-readiness-index/?doing_wp_cron=15729
41503.7552540302276611328125 (accessed on 28 October 2019).
19
TeleGeography, Internet Exchange Map. Available at www.internetexchangemap.com/ (accessed
on 28 October 2019).
20
Internet Society, IXP platform. Available at www.internetsociety.org/issues/ixps/ (accessed on 28
October 2019).
52Estimating the effects of Internet exchange points on fixed-broadband speed and latency
country. These online sources do not provide panel data with changes on a yearly
basis, namely on how many IXPs are established in each country every year.
In addition, the Inclusive Internet Index data set collects statistics on other policy
variables that allows for testing of fixed-broadband speed and latency and other
interesting policy variables for future research, such as Internet affordability, local
content, trust and safety, policies on female e-inclusion, female STEM education,
spectrum policy and national digital identification policy.
Limitations of the Inclusive Internet Index data set however are the following.
First, as the data set is relatively new (2016−2019), it provides limited observations
for a stable estimation result. Consequently, the results of this paper may need to
be revisited in three to five years to allow for additional years with observations in
the estimation. Nunnally and Bernstein (1967) suggested that in multiple regression
modelling, for each independent variable (X), there should be at least 10 observations
(namely for Y = B0 = B1X1 + B2X2, then there should be 10 observations for X1, and
10 observations for X2, and 10 observations for Y, or total of 30 observations). In
the case of the estimation in this paper, there are seven variables (excluding the
constant) with observations of around 189 (double the acceptable level).
Second, the 2020 version of the data set only included 100 countries with several
least developed countries, landlocked developing countries and small island developing
States noticeably missing.21 However, the countries that are included represent well
the global trend thought the inclusion of the ten largest economies in the world: the
United States, China, Japan, Germany, the United Kingdom, India, France, Brazil,
Italy and Canada. By population, more than 75 per cent of the world’s population are
controlled for with the inclusion of major populous countries, such as China, India,
the United States, Indonesia, Brazil, Pakistan, Nigeria, Bangladesh, the Russian
Federation and Mexico. As a result, the overall results of the estimations generated
from the paper are indeed representative of the global trend.
21
Controlling for smaller countries in the data set is also a challenge considering that the variable
required for computing a new control variable (such as one million per inhabitants) for smaller
countries is not available at the Economic Intelligence Unit data set. This missing variable is the
number of IXPs established in each of the years.
53Asia-Pacific Sustainable Development Journal Vol. 28, No. 2, December 2021
V. RESULTS
The relationship between the number of IXPs per 10 million inhabitants and
fixed-broadband speed and latency, was first checked using a simple scatter plot.
When assessed by geographic regions, a positive correlation between IXPs and
fixed-broadband speed was found, while there appears to be a negative correlation
between IXPs and fixed-broadband latency for Asia and the Pacific (figure 5).
Singapore and Australia, are among the leading countries with high fixed-broadband
speed and number of IXPs per 10 inhabitants (figure 5). Similarly, Singapore and
Australia are the leading countries with the lowest fixed-broadband latency.
In the case of Europe, a similar IXP correlation pattern is found with respect to
fixed-broadband speed and latency (annex figure A.2). Estonia and Lithuania are the
leading countries in Europe for high fixed-broadband speed and number of IXPs per
10 inhabitants. Similarly, Estonia and Lithuania are the leading countries with the
lowest fixed-broadband latency.
Moving on to Latin America and the Caribbean, a similar pattern is found with a
positive correlation between the number of IXPs and fixed-broadband speed, while
negatively correlated with fixed-broadband latency. Argentina, and Trinidad and
Tobago are the two leading countries with respect to positive correlation between
the number of IXPs and fixed-broadband speed, while negatively correlated with
fixed-broadband latency (annex figure A.3). A similar pattern is also found for Africa
(annex figure A.4).
54Estimating the effects of Internet exchange points on fixed-broadband speed and latency
Figure 5. Internet exchange points versus fixed-broadband speed and latency
(Asia-Pacific region)
Philippine
Turkey
Source: Economist Intelligence Unit, Inclusive Internet Index 2020 database. Available at https://theinclusiveinternet.
eiu.com/ (accessed on 27 February 2020).
Note: IXPs: Internet exchange points.
55Asia-Pacific Sustainable Development Journal Vol. 28, No. 2, December 2021
The relationship between the number of IXPs and fixed-broadband speed and
latency was further assessed through an econometric model that controls for the
effects of other variables. The results of the fixed-effects method are presented in
table 4.
The results of the fixed-effects estimation indicate that the number of IXPs per
10 million inhabitants is positively correlated and statistically significant with fixed-
broadband download speed (Kbps) (Dep. Var 1). In other words, for every 1 per cent
increase in the number of IXPs per 10 inhabitants, the speed of fixed-broadband
download speed (Kbps) is associated with an increase by approximately 0.8 per
cent.22
In addition, the results indicate that the number of IXPs per 10 million inhabitants
is statistically significant and negatively correlated with fixed-broadband latency (ms)
(Dep. Var 2). For every 1 per cent increase in the number of IXPs per 10 inhabitants,
fixed-broadband latency (ms) is associated with a decrease of approximately 0.4
per cent. Overall, the preliminary results from the fixed-effects estimation provide
empirical evidence to support the important role of IXPs in improving fixed-broadband
speed and latency in countries.
The remaining control variables behaved as expected. The fitness of the estimate
for fixed-broadband speed (Dep. Var 1) and fixed-broadband latency (Dep. Var 2) are
fairly robust, as indicated by the statistical significance of many control variables. With
regard to the access of subscribers to fixed-broadband services (FixBro), a positive
relationship is found between an increase in access to fixed-broadband services and
an increase in fixed-broadband speed. On the other hand, an increase in access to
fixed-broadband services is associated with a decrease in fixed-broadband latency
(ms). This finding is aligned with the literature on digital divide in such countries as
Australia, Japan, the Republic of Korea and Singapore, which showed a very high
rate of access to fixed-broadband Internet and higher fixed-broadband speed and
lower latency (ms), compared to low-income countries.
When controlling for the level of cross-border connectivity23 in each country, the
number of cable landing stations per 10 million inhabitants (CabSta) shows a positive
and statistically significant relationship with fixed-broadband speed (Kbps), and
negative correlation with fixed-broadband latency. The more cable landing stations
per population, the better and more stable the fixed-broadband connection will be;
22
Or for every 10 per cent increase in the number of IXPs per 10 inhabitants, it is associated with a
fixed download speed (Kbps) increase of about (1.10 0.8 -1)*100 = 8 per cent.
23
Considering that more than 70 per cent of global Internet traffic are routed through fibre-optic
cables.
56Estimating the effects of Internet exchange points on fixed-broadband speed and latency
this provides a strong foundation for increased fixed-broadband speed. In addition,
the increasing number of cable stations also demonstrates a country’s resilience
to natural disasters. In particular, if one cable is broken due to a natural disaster,
the second cable could provide the broadband lifeline to the country. Access to
multiple cable stations (multiple cross-border fibre cables) implies higher chances
of being able to connect to more efficient shorter traffic routes, which can improve
fixed-broadband latency.
Table 4. Fixed-effects estimation results
Independent variables Dep. Var 1 Dep. Var 2
Fixed-broadband Fixed-broadband
download latency
speed - Kbps (avg, ms)
(log) (log)
Number of Internet exchange points per 0.773*** -0.319***
10 million inhabitants (log) (0.125) (0.0722)
Fixed-broadband subscribers per 100 inhabitants (log) 0.557*** -0.408***
(0.162) (0.129)
Number of fibre-optic cable landing stations per 10 0.499*** -0.266***
million inhabitants (log) (0.136) (0.0820)
Percentage of population covered by 3G network (Log) 0.435 0.236
(0.370) (0.182)
Technology-neutrality policy for spectrum use; 0.242 -0.135
qualitative rating 0-1, (1 = best) (0.152) (0.0877)
GDP, US$ billions (log) 2.028*** -0.858***
(0.345) (0.145)
Population, millions (log) 7.052*** -1.250**
(1.000) (0.562)
Constant -29.49*** 12.73***
(4.515) (2.621)
Observations 189 189
R-squared (within) 0.697 0.501
Number of countries 74 74
Note: Robust standard errors in parentheses; *** pAsia-Pacific Sustainable Development Journal Vol. 28, No. 2, December 2021
Last-mile broadband infrastructure connectivity as a percentage of population
covered by 3G mobile network (NetCov), is positively correlated with fixed-broadband
speed and negatively correlated with fixed-broadband latency (ms). Both coefficients
are statistically significant. This result is in line with existing literature on private
investment in broadband infrastructure. When investment and deployment of 3G
network infrastructure increases to cover most of the population, a business case
is, therefore, warranted for network operators to provide efficient Internet traffic to
current and new customers for generating higher revenue.
ICT conducive policy, proxied by the quality 24 of technology-neutrality policy
for spectrum use) (NeuPol), was used to control for the sector’s policy environment
although no statistically significant results came out from the model. GDP (US$
billions) (Gdp) is a proxy for income levels in countries. A positive and statistically
significant relationship is found between the income level of countries and Internet
speed. Higher-income countries also experience higher Internet speed. This finding is
aligned with earlier studies by ESCAP (2016, p. 13; 2017, p. 72) in which population
(millions) (Pop) was used as a proxy of country/market size. A positive relationship25
was found with fixed-broadband speed, while a negative relationship was found with
fixed-broadband latency. This finding suggests the presence of economies of scale. In
particular, as market size increases, demand for Internet services which incentivizes
network operators to invest in improving Internet speed and latency increases.
VI. CONCLUSION AND POLICY IMPLICATIONS
The preliminary findings of this paper provide econometric evidence towards
the important role of IXPs in improving fixed-broadband speed and latency. In
particular, the number of IXPs per 10 million inhabitants is positively correlated and
statistically significant with fixed-broadband download speed (Kbps). For every 1
per cent increase in the number of IXPs per 10 million inhabitants, the speed of
fixed-broadband download (Kbps) is associated with an increase of 0.8 per cent. In
addition, the presence of IXPs is common in high-income countries and vice versa.
Countries with a higher number of IXPs also tend to have greater access to broadband
Internet,26 and the costs are more affordable.
Despite the benefits of IXPs, challenges remain on establishing IXPs. In particular,
the need for collaboration and building trust between several stakeholders (national
and international), a neutral location and management of IXPs as a platform for all
24
Qualitative rating (0-1, 1 = best).
25
Statistically significant in both cases.
26
Mobile service providers will play an increasingly important role going forward, with the transitioning
from 4G to 5G.
58Estimating the effects of Internet exchange points on fixed-broadband speed and latency
operators to connect and a conducive regulatory environment that supports an open
market for telecommunication services.27
As a result, these challenges pose three important policy implications for
policymakers in ensuring the sustainability of IXPs. First, strong political support is
needed. Governments that champion the process need to ensure that existing and new
regulatory policies facilitate an enabling regulatory environment for interconnectivity
between operators (local and international). Second, governments and regulators
need to offer incentives to encourage investment in establishing IXP (such as tax
incentives on equipment for IXPs or operator network equipment). Third, in the light
of the key findings of this paper on the important role of IXPs in improving fixed-
broadband speed and latency, all stakeholders in the process need to cooperate
and share information and best practices. National and international organizations,
such as Internet Society and the Asia Pacific Network Information Centre, provide
expert advice and capacity training in this area.
In Asia and the Pacific, governments recognize the important role of regional
cooperation in promoting broadband connectivity through the Asia-Pacific Information
Superhighway initiative. 28 The Asia-Pacific Information Superhighway initiative is
an intergovernmental platform that facilitates a policy dialogue for stakeholders
(governments, private sectors, donors, international organizations, non-governmental
organizations, civil society and academia, among others) to discuss challenges related
to cross-border connectivity. In particular, to identify tangible solutions for regional
cooperation. The Asia-Pacific Information Superhighway initiative focuses on four
pillars: infrastructure connectivity (promoting investment in infrastructure connectivity);
efficient Internet traffic and network management (including the establishment of IXPs,
among others); e-resilience (resilient ICT infrastructure from natural disasters); and
affordable broadband access for all. As a result, promoting national and subregional
IXPs under the Asia-Pacific Information Superhighway initiative framework would
improve Internet speed and latency in countries with special needs (least developed
countries, landlocked developing countries and small island developing States).
27
In particular, in markets with a dominant ISP (for example, 60 per cent of market share), smaller
ISPs may be required to pay for local connectivity. As a result, setting up a local IXP in that context
could be challenging. A potential solution would be for smaller ISPs in a country to connect to a
neutral IXP, which would increase market share and leverage for negotiating traffic flow with other
dominant ISPs.
28
For further details, visit www.unescap.org/our-work/ict-disaster-risk-reduction/asia-pacific-information-
superhighway.
59Asia-Pacific Sustainable Development Journal Vol. 28, No. 2, December 2021
REFERENCES
Ahmad, Mohammad, and Ratan Guha (2012). Studying the effects of Internet exchange points
on Internet topology. Journal of Information Technology & Software Engineering,
vol. 2, No. 5, pp. 1-12.
Baltagi, Badi (2005). Econometric Analysis of Panel Data, 3rd ed. West Sussex, United Kingdom:
John Wiley and Sons.
Economist Intelligence Unit (2020). The Inclusive Internet Index 2019. Available at https://
theinclusiveinternet.eiu.com/.
(2021). The Inclusive Internet Index 2019, Methodology Report. Available at https://
theinclusiveinternet.eiu.com/assets/external/downloads/3i-methodology.pdf.
Galperin, Hernán (2013). Connectivity in Latin America and the Caribbean: the role of Internet
exchange points. Documento de Trabajo 2013, Number 14. Universidad de San Andres.
Available at http://repositorio.udesa.edu.ar/jspui/bitstream/10908/15563/1/%5BP%5D
%5BW%5D%20DT14-Galperin%20%28eng%29.pdf.
Grace, Jeremy, and others (2004). Information and communication technologies and broad-based
development − a partial review of the evidence. World Bank Working Paper, No. 12.
Washington, D.C.: The International Bank for Reconstruction and Development and
World Bank.
Internet Society (2014). The Internet Exchange Point Toolkit & Best Practices Guide. Available
at www.ixptoolkit.org/wp-content/uploads/2016/08/Global-IXPToolkit_Collaborative-
Draft_Feb-24.pdf.
(2015). Internet exchange points, an internet society public policy briefing. Available at
www.internetsociety.org/wp-content/uploads/2015/10/ISOC-PolicyBrief-IXPs-20151030_
nb.pdf.
International Telecommunication Union (ITU) (2012). Impact of Broadband on the Economy.
Broadband Series. Available at www.itu.int/ITU-D/treg/broadband/ITU-BB-Reports_Impact-
of-Broadband-on-the-Economy.pdf.
(2013a). Study on international internet connectivity: focus on Internet connectivity in
Latin America and the Caribbean. Available at www.itu.int/en/ITU-D/Regulatory-Market/
Documents/International%20Internet%20Connectivity%20in%20Latin%20America%20
and%20the%20Caribbean.pdf.
(2013b). Study on international Internet connectivity in sub-Saharan Africa. Available at
www.itu.int/en/ITU-D/Regulatory-Market/Documents/IIC_Africa_Final-en.pdf.
Lubis, Nurchaliza, and Helda Febrianty (2018). Internet influencing economic growth: what and how
much? A case study of Indonesia using time series data (2001−2016). 3rd International
Conference of Integrated Intellectual Community (ICONIC). Available at https://papers.
ssrn.com/sol3/papers.cfm?abstract_id=3216419.
Minges, Michael (2015). Exploring the relationship between broadband and economic growth.
Background paper prepared for the World Development Report 2016: Digital Divide.
Washington, D.C.: World Bank.
Nunnally, Jum, and Ira Bernstein (1967). Psychometric Theory. New York: McGraw-Hill.
60Estimating the effects of Internet exchange points on fixed-broadband speed and latency
Qiang, Christine Zhen-Wei, Alexander Pitt, and Seth Ayers (2004). Contribution of Information and
Communication Technologies to Growth. World Bank Working Paper, No. 24. Washington,
D. C.: International Bank for Reconstruction and Development/World Bank.
TeleGeography (2020). Internet Exchange Map. Available at www.internetexchangemap.com/.
United Nations, Economic and Social Commission for Asia and the Pacific (ESCAP) (2016). State
of ICT in Asia and the Pacific 2016: uncovering the widening broadband divide. Working
paper by the Information Communications and Technology Disaster Risk Division.
Available at www.unescap.org/resources/state-ict-asia-and-pacific-2016-uncovering-
widening-broadband-divide.
(2017). Artificial Intelligence and Broadband Divide: State of ICT Connectivity in Asia
and the Pacific 2017. Available at www.unescap.org/resources/artificial-intelligence-
and-broadband-divide-state-ict-connectivity-asia-and-pacific-2017.
United Nations, Economic and Social Commission for Asia and the Pacific (ESCAP), and National
Information Society Agency (2016). A pre-feasibility study on the Asia-Pacific Information
Superhighway in the ASEAN Sub-region: international traffic and quality analysis, network
topography design and implementation model. Technical Report (draft). Available at www.
unescap.org/resources/pre-feasibility-study-asia-pacific-information-superhighway-
asean-sub-region.
Zaki, Yasir, and others (2014). Dissecting web latency in Ghana. Conference Paper, IMC 2014.
Vancouver, Canada, 5−7 November. Available at https://conferences2.sigcomm.org/
imc/2014/papers/p241.pdf.
61Asia-Pacific Sustainable Development Journal Vol. 28, No. 2, December 2021
ANNEX
Figure A.1. Internet exchange points by economy, 2019
30.3 0.9
20.0 0.9
10.7 0.8
10.6 0.8
10.3 0.7
9.0 0.7
8.2 0.6
8.0 0.6
7.3 0.6
7.1 0.6
7.0 0.6
0.6
6.8
0.5
6.2
0.5
5.6
0.5
4.9
0.5
4.8
0.5
4.6
0.4
4.6
0.4
4.3
0.4
3.9
0.4
3.5
0.4
3.4
0.3
3.3
0.3
3.2
0.3
2.5
0.3
2.4
0.3
2.4
0.3
2.3
0.2
2.1
0.2
2.1
0.2
2.1
0.2
2.1
0.2
2.0
0.2
1.9
0.2
1.9
0.2
1.8
0.1
1.8
0.1
1.8
0.1
1.7 0.1
1.6 0.1
1.6 0.0
1.5 0.0
1.4 0.0
1.3 0.0
1.2 0.0
1.2 0.0
1.2 0.0
1.1 0.0
0.9 0.0
Source: Economist Intelligence Unit, Inclusive Internet Index 2020 database. Available at
https://theinclusiveinternet.eiu.com/ (accessed on 27 February 2020).
Note: IXPs: Internet exchange points.
62Estimating the effects of Internet exchange points on fixed-broadband speed and latency
Table A.1. Internet Inclusive Index 2020 – variables
1. AVAILABILITY
1.1. USAGE
1.1.1. Internet users; % of households
1.1.2. Fixed-line broadband subscribers; Per 100 inhabitants
1.1.3. Mobile subscribers; Per 100 inhabitants
1.1.4. Gender gap in internet access; % difference
1.1.5. Gender gap in mobile phone access; % difference
1.2. QUALITY
1.2.1. Average fixed broadband upload speed; Kbps
1.2.2. Average fixed broadband download speed; Kbps
1.2.3. Average fixed broadband latency; ms
1.2.4. Average mobile upload speed; Kbps
1.2.5. Average mobile download speed; Kbps
1.2.6. Average mobile latency; ms
1.2.7. Bandwidth capacity; Bit/s per Internet user
1.3. INFRASTRUCTURE
1.3.1. Network coverage (min. 2G); % of population
1.3.2. Network coverage (min. 3G); % of population
1.3.3. Network coverage (min. 4G); % of population
1.3.4. Government initiatives to make Wi-Fi available; Qualitative rating 0-2, 2 = best
1.3.5. Private sector initiatives to make Wi-Fi available; Qualitative rating 0-2, 2 = best
1.3.6. Internet exchange points; Number of IXPs per 10 million inhabitants
1.4. ELECTRICITY
1.4.1. Urban electricity access; % of population
1.4.2. Rural electricity access; % of population
2. AFFORDABILITY
2.1. PRICE
2.1.1. Smartphone cost (handset); Score of 0-100, 100 = most affordable
2.1.2. Mobile phone cost (prepaid tariff); % of monthly GNI per capita
2.1.3. Mobile phone cost (postpaid tariff); % of monthly GNI per capita
2.1.4. Fixed-line monthly broadband cost; % of monthly GNI per capita
2.2. COMPETITIVE ENVIRONMENT
2.2.1. Average revenue per user (ARPU, annualized); US$
2.2.2. Wireless operators’ market share; HHI score (0-10,000)
2.2.3. Broadband operators’ market share; HHI score (0-10,000)
63Asia-Pacific Sustainable Development Journal Vol. 28, No. 2, December 2021
Table A.1. (continued)
3. RELEVANCE
3.1. LOCAL CONTENT
3.1.1. Availability of basic information in the local language; Qualitative rating 0-2, 2 = best
3.1.2. Concentration of websites using country-level domains; Qualitative rating 0-3, 3 = best
3.1.3. Availability of e-Government services in the local language; Qualitative rating 0-2, 2 = best
3.2. RELEVANT CONTENT
3.2.1. e-Finance content; Qualitative rating 0-2, 2 = best
3.2.2. Value of e-finance; %
3.2.3. e-Health content; Qualitative rating 0-3, 3 = best
3.2.4. Value of e-health; %
3.2.5. e-Entertainment usage; %
3.2.6. e-Commerce content; Score of 0-100, 100 = best
3.2.7. Value of e-Commerce; %
4. READINESS
4.1. LITERACY
4.1.1. Level of literacy; % of population
4.1.2. Educational attainment; Years of schooling
4.1.3. Support for digital literacy; Qualitative rating 0-3, 3 = best
4.1.4. Level of web accessibility; Qualitative rating 0-4, 4 = best
4.2. TRUST & SAFETY
4.2.1. Privacy regulations; Qualitative rating 0-2, 2 = best
4.2.2. Trust in online privacy; %
4.2.3. Trust in government websites and apps; %
4.2.4. Trust in non-government websites and apps; %
4.2.5. Trust in information from social media; %
4.2.6. e-Commerce safety; %
4.3. POLICY
4.3.1. National female e-inclusion policies; Qualitative rating 0-4, 4 = best
4.3.1.1. Comprehensive female e-inclusion plan; Qualitative rating 0-2, 2 = best
4.3.1.2. Female digital skills training plan; Qualitative rating 0-1, 1 = best
4.3.1.3. Female STEM education plan; Qualitative rating 0-1, 1 = best
4.3.2. Government e-inclusion strategy; Qualitative rating 0-2, 2 = best
4.3.3. Broadband strategy; Qualitative rating 0-2, 2 = best
64Estimating the effects of Internet exchange points on fixed-broadband speed and latency
Table A.1. (continued)
4.3.4. Funding for broadband buildout; Qualitative rating 0-1, 1 = best
4.3.5. Spectrum policy approach; Qualitative rating 0-2, 2 = best
4.3.5.1. Technology-neutrality policy for spectrum use; Qualitative rating 0-1, 1 = best
4.3.5.2. Unlicensed spectrum policy; Qualitative rating 0-1, 1 = best
4.3.6. National digital identification system; Qualitative rating 0-2, 2 = best
BACKGROUND VARIABLES
BG1. Nominal GDP; US$ billions
BG2. Population; Millions
BG3. Urbanization rate; % of population
BG4. GNI per capita; US$ per person
BG5. GINI coefficient; Score, 0-100; 0 is perfect equality; 100 is perfect inequality
BG6. Population under the poverty line; % of population
BG7. Total electricity access; % of population
BG8. Cable landing stations; Number of cable landing stations per 10 million inhabitants
BG9. Percentage of schools with Internet access; % of schools
BG10. Global Peace Index; Score, 1-5; 1 = best
BG11. Democracy Index; Score, 0-10; 10 = best
BG12. Corruption Perceptions Index; Score, 0-100; 100 = best
BG13. EIU Business Environment Rankings; Score, 1-10, 10 = high
BG14. UN E-Government Development Index; Score, 0-1; 1 = best
BG15. Internet users (population); Millions
BG16. Offline population; Millions
BG17. Plan addressing female-driven innovation and women-owned businesses; Qualitative
rating 0-1, 1 = best
BG18. Internet access gender gap; Difference in percentage points
BG19. Mobile phone access gender gap; Difference in percentage points
BG20. Internet users (percent of population); % of population
BG21. Male Internet users; % of male population
BG22. Female Internet users; % of female population
BG23. Male mobile phone subscribers; % of male population
BG24. Female mobile phone subscribers; % of female population
BG25. Total fixed line broadband subscribers; Number of subscriptions
Source: Economist Intelligence Unit, Inclusive Internet Index 2020 database. Available at https://theinclusiveinternet.
eiu.com/ (accessed on 27 February 2020).
65You can also read