Do Energy Consumption and Environmental Quality Enhance Subjective Wellbeing in G20 Countries?
←
→
Page content transcription
If your browser does not render page correctly, please read the page content below

Do Energy Consumption and Environmental Quality Enhance Subjective Wellbeing in G20 Countries? Neha Kumari ( nk24@iitbbs.ac.in ) Indian Institute of Technology Bhubaneswar https://orcid.org/0000-0001-5327-5321 Pushp Kumar Indian Institute of Technology Bhubaneswar Naresh Chandra Sahu Indian Institute of Technology Bhubaneswar Research Article Keywords: G20 Countries, Subjective Wellbeing, PCSE, Newey West Method, Renewable Energy Consumption, Non-renewable Energy Consumption, CO2 Emissions Posted Date: May 5th, 2021 DOI: https://doi.org/10.21203/rs.3.rs-480646/v1 License: This work is licensed under a Creative Commons Attribution 4.0 International License. Read Full License
1 Do Energy Consumption and Environmental Quality Enhance Subjective Wellbeing in G20
 2 Countries?

 3 Neha Kumari (Corresponding Author)
 4 PhD Scholar
 5 School of Humanities, Social Sciences, and Management
 6 Indian Institute of Technology Bhubaneswar, Odisha 752050, India
 7 Email Id: nk24@iitbbs.ac.in
 8 ORCID ID: 0000-0001-5327-5321
 9
10 Pushp Kumar
11 PhD Scholar
12 School of Humanities, Social Sciences, and Management
13 Indian Institute of Technology Bhubaneswar, Odisha 752050, India
14 Email Id: pk27@iitbbs.ac.in
15 ORCID ID: 0000-0002-2355-1871
16
17 Dr. Naresh Chandra Sahu
18 Assistant Professor
19 School of Humanities, Social Sciences, and Management
20 Indian Institute of Technology Bhubaneswar, Odisha 752050, India
21 Email Id: naresh@iitbbs.ac.in
22 ORCID ID: 0000-0002-4013-1801
23
24 Abstract

25 G20 countries are responsible for more than 80% of global energy consumption and the largest emitter of CO2 in
26 the world. Literature related to the energy consumption-environmental quality-subjective wellbeing nexus is
27 limited and lacks consensus. This paper analyses the impact of energy consumption and environmental quality on
28 subjective wellbeing in G20 countries from 2006 to 2019 using a panel corrected standard error (PCSE) panel
29 model. Cantril life ladder data is used as a proxy of subjective wellbeing. For robustness, the Newey-West standard
30 error model is used. The findings reveal that renewable energy consumption and improved environmental quality,
31 i.e. lesser carbon emissions enhance subjective wellbeing in G20 countries. In contrast, non-renewable energy
32 consumption degrades subjective wellbeing. Moreover, the study also finds a bidirectional causality between
33 renewable energy consumption, non-renewable energy consumption, and economic growth. The policymakers of
34 these countries should encourage renewable energy production and its consumption to reduce carbon emissions
35 for conserving the environment and enhancing their people's subjective wellbeing.

36 Keywords: G20 Countries; Subjective Wellbeing; PCSE, Newey West Method; Renewable Energy Consumption;
37 Non-renewable Energy Consumption; CO2 Emissions

38

39

 1
40 Do Energy Consumption and Environmental Quality Enhance Subjective Wellbeing in
41 G20 Countries?

42 Abstract

43 G20 countries are responsible for more than 80% of global energy consumption and the largest emitter of CO2 in
44 the world. Literature related to the energy consumption-environmental quality-subjective wellbeing nexus is
45 limited and lacks consensus. This paper analyses the impact of energy consumption and environmental quality on
46 subjective wellbeing in G20 countries from 2006 to 2019 using a panel corrected standard error (PCSE) panel
47 model. Cantril life ladder data is used as a proxy of subjective wellbeing. For robustness, the Newey-West standard
48 error model is used. The findings reveal that renewable energy consumption and improved environmental quality,
49 i.e. lesser carbon emissions enhance subjective wellbeing in G20 countries. In contrast, non-renewable energy
50 consumption degrades subjective wellbeing. Moreover, the study also finds a bidirectional causality between
51 renewable energy consumption, non-renewable energy consumption, and economic growth. The policymakers of
52 these countries should encourage renewable energy production and its consumption to reduce carbon emissions
53 for conserving the environment and enhancing their people's subjective wellbeing.

54 Keywords: G20 Countries; Subjective Wellbeing; PCSE, Newey West Method; Renewable Energy Consumption;
55 Non-renewable Energy Consumption; CO2 Emissions

56 1. Introduction

57 According to the United Nations Environment Programme (2020), despite the cut in carbon emissions due to the
58 COVID-19, the world is heading towards a temperature rise above 3°C. The non-CO2 components of greenhouse
59 gases (GHGs) such as methane (CH4) and nitrous oxide (N2O) continued to increase in 2020. Executive Director
60 Inger Andersen of United Nations Environment Programme (UNEP) recently urged for the immediate need of
61 reducing emissions; otherwise, the goal to reach 1.5°C by 2030 will only be a dream (UNEP, 2020). This rise of
62 3°C in global temperatures could result in catastrophic weather-related events, ozone depletion, and ecosystem
63 degradation, which is a severe threat to humankind.

64 It is widely evident from the literature that massive energy consumption activities are responsible for the
65 increasing GHG emissions (Hao et al., 2015; Khan et al., 2014; Sarkodie & Strezov, 2019) and climate change
66 (MacKay, 2008). The use of cleaner and sustainable energy in both production and consumption is required to
67 meet long-run energy and climate goals (IEA, 2020). Therefore 37 countries have committed to shift from non-
68 renewable to renewable energy consumption in the Doha Amendment, 2nd commitment period (2013-2020).

69 G20 countries account for two-thirds of the world population and have more than 80% of energy demand (Rogelj
70 et al., 2016). It is a global body comprising the 20 largest economies, and consumes 95% of the world’s coal,
71 more than 70% of its oil and gas, and is responsible for 85% of global investment in renewables (Goldthau, 2017).
72 The G20 comprises Argentina, Australia, Brazil, Canada, China, EU, France, Germany, India, Indonesia, Italy,
73 Japan, Mexico, Russia, Saudi Arabia, South Africa, South Korea, Turkey, UK, and the USA. These countries have
74 experienced energy-led growth and are under continuous pressure for CO2 mitigations. For overcoming the Paris
75 emissions commitments, these countries have a bulk investment in inventing sustainable energy sources and

 2

76 energy-saving technologies (Qiao et al. 2019). Many G20 countries like Germany, Italy, France, the UK, the
 77 United States, Canada and Japan, and the EU have experienced high growth rates in renewable energy production
 78 and reduction in fossil fuel consumption.

 79 The purpose of energy consumption in a economy is to improve the wellbeing of humankind. One of the goals of
 80 the Sustainable Development Goal (SDGs) is to ensure universal access to affordable, reliable, and modern energy
 81 by 2030. These goals reflect the significance of energy services for meeting basic needs and improving wellbeing
 82 (Kalt et al., 2019). Indeed, higher energy consumption has reduced drudgery, increased productivity, and provided
 83 a comfortable life. Alam et al. (1991) have found a positive association of electricity consumption and physical
 84 quality of life (PQLI) with the per capita electrical energy consumption in 112 countries. Residential energy
 85 consumption positively contributes to household living standards through lighting, cooking, heating, and cooling
 86 and promotes wellbeing (Welsch and Biermann, 2019). In the Nagasaki city of Japan, Liu et al. (2016) have
 87 investigated the link between energy consumption and quality of life (QOL). Energy consumption in the form of
 88 demand for car trips and public transport trips raises the quality of life. Shobande (2020) has found a positive
 89 impact of energy use on infant mortality rate in the panel of 23 African countries. Liu and Matsushina (2019) have
 90 used HDI as a proxy of QOL and found that HDI improves with the changes in energy quality in the OECD and
 91 non-OECD countries. Better access to energy promotes economic growth and human development together and
 92 increases the pace of achieving the target of SDGs (Ouedraogo, 2013). Niu et al. (2013) have found that countries
 93 with a higher level of income and higher per capita energy consumption have attained a higher level of human
 94 development. Wang (2020) have found a positive link between renewable energy consumption and human
 95 development in BRICS countries during 1990-2016. Renewable energy production helps the countries to achieve
 96 higher HDI via enhanced economic development (Kazar and Kazar, 2014).

 97 But the higher level of pollution, GHG emissions, and climate change brought by rampant energy consumption
 98 have threatened the Subjective Wellbeing (SWB) of people worldwide. SWB is used to measure the wellbeing of
 99 people based on subjective evaluations of a person’s own lives (Diener, 2000). It includes both positive
100 (happiness), negative emotions (sadness, anxiety, and stress), and life satisfaction. In economics, only the revealed
101 preferences in the form of choices have been given importance rather than the psychological aspect, i.e., self-
102 reported preference (Case and Deaton, 2015). After the emergence of Bhutan's Gross national happiness index
103 (GNH) and the Easterlin Paradox debate, economists have started considering SWB. Stiglitz et al. (2009) have
104 recommended countries to adopt the subjective determinants of wellbeing because it can better understand
105 people’s lives beyond income and material consumption. The happiness ranking of G20 countries is presented in
106 Figure 1.

107 Insert [Figure 1]

108 Deterioration of environmental quality has adversely affected the mental health and subjective wellbeing of the
109 people. Rehdanz and Maddison (2005) established that weather changes caused by global warming has an adverse
110 effect on people’s happiness1. Welsch (2006) shows that air pollution has a strong negative impact on subjective
111 wellbeing. Ferrer-i-Carbonell and Gowdy (2007) obtained a negative coefficient for concern about ozone pollution
112 and an individual’s wellbeing. In a similar study, Cuñado and Gracia (2013) explored the relationship between air

 1
 In this paper, Happiness and life satisfaction (LS) are used interchangeably as a proxy of SWB.

 3
113 pollution, climate change, and Spanish people’s subjective wellbeing. They found that an increase in carbon
114 dioxide, nitrous oxide, and airborne particulate matter (PM) is negatively related to happiness. Similarly, Spanish
115 people are unhappy during high temperatures and high precipitation. Tiwari (2014) indicated that CO2 emissions
116 have an undesirable impact on happiness. A higher air pollution index significantly reduces hedonic happiness
117 and raises depressive symptoms in Chinese citizens (Zhang et al., 2017; Gu et al., 2020). Song et al. (2020) pointed
118 out the importance of subjective evaluation of pollution; the result of the study reveals that the adverse impact of
119 bad air quality on happiness is more on unhealthy, middle, and old age people. Thus, these people are more willing
120 to pay for protecting the environment. Giovanis and Ozdamar (2018) explored the impact of air quality on mental
121 health. For improving mental health, pensioners in the European countries have a marginal willingness to pay are
122 €221 and €88 per year for one unit decrease in sulphur dioxide and ozone level respectively.

123 There is a limited literature on the nexus between environmental degradation and SWB. Out of this, few studies
124 have been carried out regarding the relationship between energy consumption and subjective wellbeing. Afia
125 (2019) has found the positive direct and indirect impact of energy consumption on happiness in the sample of 47
126 countries. Okulicz-Kozaryn and Altman (2020) have concluded that energy consumption is unrelated to happiness
127 in developed economies, while in developing economies, people are happier with less energy consumption. Mazur
128 and Rosa (1974) have found that the industrial nations, which are already sufficient in the energy and electricity
129 consumption, further increase in their per capita energy or electricity consumption, have no impact on happiness.
130 Smil (2003) has found that higher energy has not improved the objective and subjective self-assessment.
131 Longhurst and Hargreaves (2019) have found that emotions like worry, fear, and care determine energy use
132 consumption and its management. Churchill et al. (2020) have examined the effect of fuel poverty on subjective
133 wellbeing (SWB) in Australia and found that an increase in fuel poverty is associated with lower levels of SWB.
134 Fanning and O’Neill (2019) have investigated the relationship between carbon-intensive consumption and
135 wellbeing for 120 countries from 2005-2015. It is found that there is a negative relation between carbon footprint
136 and happiness in non-growing carbon footprint countries while an insignificant relation in growing carbon
137 footprint countries.

138 Renewable energy and sustainability are interconnected with the SWB. Many Scholars explored the different
139 aspects of sustainability, renewable energy, and SWB. Zhang et al. (2017) have found that renewable natural
140 capital has a positive relationship with subjective wellbeing because of the fear of the extinction of non-renewable
141 natural capital. For the low-income economies, economic factors related to livelihood which are mainly based on
142 non-renewable energy consumption determine the level of SWB. Consequently, people may not perceive
143 renewable energy as an essential determinant of wellbeing. Sarpong et al. (2020) have found a positive relationship
144 between renewable energy consumption and quality of life in eight South African countries from 1995-2017. The
145 wellbeing of the people can be enhanced by reducing global consumption and over-exploitation of natural
146 resources (Sheth et al., 2011). In these studies, the separate impact of both non-renewable energy consumption
147 and renewable energy consumption on SWB is not considered. Up to our best knowledge, G20 countries, which
148 is the 80% energy consumer and the largest emitter of CO2, are not studied. The existing literature is primarily
149 based on OECD countries, European countries, and BRICS countries.

150 This paper contributes to the literature in several ways. Firstly, it quantifies the impact of renewable and non-
151 renewable energy consumption and environmental quality on the SWB. Secondly, this is the first attempt to

 4
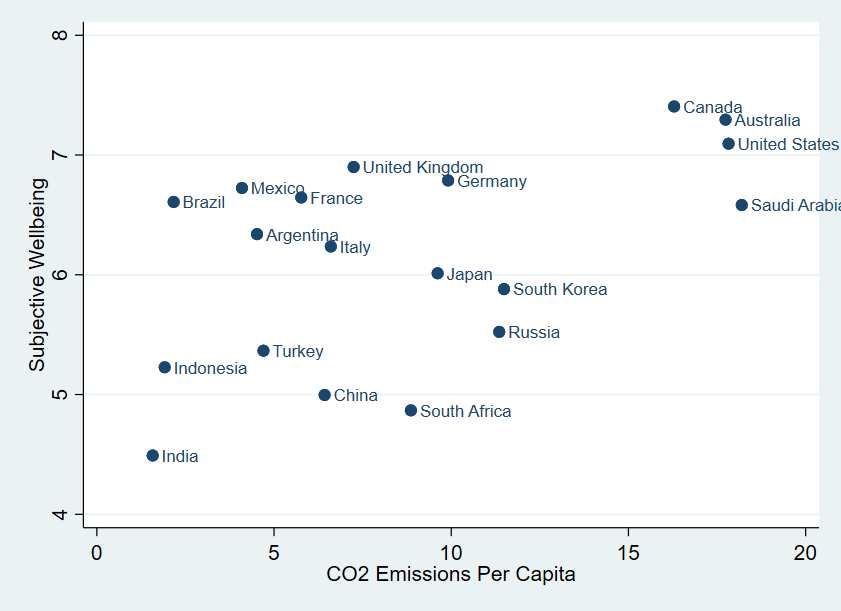
152 investigate the effect of renewable and non-renewable energy consumption on SWB in G20 countries. Moreover,
153 this study attempts to acknowledge the role of renewable energy on human wellbeing through the channel of SWB
154 in the panel data of 19 countries by using the latest time period, i.e., 2006-2019. Exploring the connection between
155 renewable energy consumption and subjective wellbeing can put forward a new argument for conserving non-
156 renewable energy and boosting renewable energy consumption through diverse energy innovations. The rest of
157 the paper is designed in the following way. Section 2 presents the relationship between subjective wellbeing and
158 energy consumption in G20 countries. Section 3 describes the data sources and methods. Section 4 explains the
159 results and discussion. Lastly, Section 5 deals with the conclusion, policy implications, and limitations of the
160 study.

161 2. Relationship Between Subjective Wellbeing and Energy Consumption in G20
162 Countries
163 This section shows the relationship among SWB, renewable energy consumption (REC), non-renewable energy
164 consumption (NREC), CO2 emissions, and economic growth in each G20 country by using scatter plot diagrams.
165 To plot these scatter plots, data are averaged from 2006-2019.

166 The relationship between REC and SWB is presented in Figure 2. The scatter plot depicts the positive relationship
167 between SWB and REC. Canada has the highest level of REC as well as SWB among the sample G20 countries.
168 However, Australia, UK, Mexico, Germany, France, and Saudi Arabia have a high level of happiness (near 7)
169 despite less REC. It might be possible due to the use of energy-efficient technologies.

170 Insert [Figure 2]

171 The relationship between NREC and SWB is shown in Figure 3. It shows that among the selected G20 countries,
172 high NREC does not bring a higher level of happiness. This result supports the energy-subjective wellbeing
173 paradox (Okulicz-Kozaryn and Altman, 2020). Moreover, China has more NREC than the United States but
174 unable to convert into a higher happiness level. While European countries like Australia and Canada have
175 performed well in preserving their people's happiness despite low NREC. Even though moving to high NREC,
176 India's SWB is the lowest in the sample G20 countries.

177 Insert [Figure 3]

178 In Figure 4, the relationship between SWB and CO2 emissions is presented. In this figure, different scenarios can
179 be observed. Countries like Australia, Canada, and the US have a higher level of SWB with more CO2 emissions.
180 In contrast to this, India has the lowest level of SWB with the lowest carbon emissions. Countries like South
181 Korea, Japan, South Africa, China, and Russia have high carbon emissions but near to the average level of SWB.
182 While Brazil, France, Mexico, Argentina, and Italy have lesser carbon emissions but their SWB level is above the
183 average.

184 Insert [Figure 4]

185 Lastly, Figure 5 shows the relationship between economic growth and SWB. A linear positive relationship is
186 found for most of the countries. India, China, and South Africa have lower SWB with lower GDP per capita.
187 While contrast to this, Canada, Australia, and United States. However, Mexico and Brazil have attained nearly

 5
188 the same level of SWB without higher per capita GDP as compared to Germany and France. Although, Japan has
189 a high GDP per capita, but it has just above the average SWB level.

190 Insert [Figure 5]

191 3. Data Sources and Methods

192 3.1 Data Sources

193 The paper uses the panel data of 19 G20 countries for the period 2006-2019. This time period and sample G20
194 countries are chosen on the basis of data availability. The selected countries are Argentina, Australia, Brazil,
195 Canada, China, France, Germany, India, Indonesia, Italy, Japan, Mexico, Russia, Saudi Arabia, South Africa,
196 South Korea, Turkey, United Kingdom, and United States. The dependent variable is subjective wellbeing (SWB)
197 which is measured by self-reported life satisfaction data from World Happiness Report (Yuan et al., 2018). SWB
198 is assessed by asking respondents to show how satisfied they are with their life, a scale from 1 (not at all satisfied)
199 to 10 (very satisfied). Independent variables are economic growth, CO2 emissions, renewable energy consumption
200 (REC), and non-renewable energy consumption (NREC). The variables were converted into the natural logarithm
201 form to explain the estimated coefficients in the elasticities form. A detailed description of the variables is
202 presented in Table 1. The trend of each variable from 2006-2019 is shown in Appendix 1.

203 3.2. Methodology

204 3.2.1. Unit Root Tests

205 Fisher augmented Dickey-Fuller (ADF) unit root test and cross-sectionally augmented ADF (CADF) unit root
206 tests are used to check the stationarity of the variables. The first-generation panel unit root tests neglect cross-
207 sectional dependence (Mahalik et al., 2020). Fisher ADF and CADF unit root tests consider the cross-sectional
208 dependence issues while testing the stationarity of the variables.

209 3.2.2. Panel Corrected Standard Error (PCSE) Model

210 Panel corrected standard error (PCSE) approach is applied to investigate the impact of energy consumption and
211 environmental quality on subjective wellbeing. Cross-sectional dependence (CSD), autocorrelation, and
212 groupwise heteroskedasticity issues are generally found in panel data. PCSE model controls the problems of CSD,
213 autocorrelation and heteroskedasticity (Reed & Webb, 2010). Moreover, this model is suitable when the dataset
214 has larger cross-sectional units (N) than time period (T). In our study, cross sectional units (19 countries) are
215 greater than time period (14 years). Therefore, the PCSE model is applied in this study. The PCSE method has
216 been commonly used by various researchers recently in the literature (Kumar et al., 2021; Kongkuah et al., 2021;
217 Dash et al., 2021; Nathaniel et al., 2020; Ikpesu et al., 2019). For robustness purpose, we applied the Newey-West
218 standard model.

219

220

 6
221 3.2.3. Dumitrescu-Hurlin Panel Causality Test

222 To understand the causation among the variables, this study employs a Granger causality test recently developed
223 by Dumitrescu and Hurlin (2012) to demonstrate the causality relationship. This test is flexible in nature as it can
224 be applied in heterogeneous panels and in the cases where time period is less than or higher than cross sectional
225 units. This test considers cross-sectional dependence in estimating causality among the variables (Mahalik et al.,
226 2020). The test can be represented in the following equation:

 ( ) ( )
227 = + ∑ =1 , − + ∑ =1 , − + (1)

228 3.3. Model Specification

229 Energy consumption includes both renewable and non-renewable energy consumption. The conventional energy
230 sources are non-renewable energy like oil, coal, natural gas, and nuclear energy. However renewable energy
231 sources are solar energy, tidal energy, hydropower, geothermal energy, and bioenergy (Owusu & Sarkodie, 2016).
232 Non-renewable energy consumption (NREC) is the most significant contributor to higher economic growth.
233 However, Kraft and Kraft (1978) have found energy consumption has no causal relationship with economic
234 growth, but vice versa is correct from 1950-1970 in the USA. Similarly, Yu and Choi (1985) have found a
235 unidirectional relationship between natural gas and liquid fuel consumption to GNP for the UK and South Korea.
236 Moreover, NREC is the most significant contributor to CO2 emissions faced by these countries (Paramati et al.,
237 2017; Dong et al., 2019; Ahmed et al., 2019).

238 However, the REC promotes green growth (Shahbaz et al., 2020; Pao & Fu, 2013) and reduces CO2 emissions for
239 developed countries in both the short run and long run (Qiao et al., 2019; Paramati et al., 2017). While REC has
240 no impact on CO2 emissions in developing countries. There is bidirectional causality between REC and economic
241 growth among the panel of 30 developed and developing countries (Ahmed et al., 2019).

242 Subjective wellbeing is connected with energy consumption from two channels: environmental degradation (CO2
243 emissions) and economic growth. On the one hand, an eco-friendly environment i.e., lesser carbon emissions
244 enhance SWB while, on the other hand, economic growth meets the basic needs and brings material prosperity.
245 Therefore, the empirical model examines the impact of renewable, non-renewable energy consumption, and CO2
246 emissions on subjective wellbeing. The functional form of the variables is represented in the following equation:

247 = ( , , 2 , ) (2)

248 The model's general specification is represented in Equation (3) by taking the natural logarithm of Equation (2),
249 is given as:

250 = 0 + 1 + 2 + 3 2 + 4 + (3)

251 Where, is the subjective wellbeing of a country at a time t; is the renewable energy consumption
252 per capita of the country; is the non-renewable energy consumption per capita of the country; 2 is the
253 environmental quality of the country; is the GDP per capita. denotes the error term of the equation. The
254 detailed methodology is presented in Figure 6.

 7
255 Insert [Figure 6]

256 4. Results and Discussion

257 Table 2 shows that the mean value is highest for GDP (9.75), followed by REC (7.35), NREC (2.33), CO2 (1.94),
258 and SWB (1.80), respectively. Variance of REC (1.92%) is highest, followed by GDP (1.01%), NREC (0.92%),
259 CO2 (0.74%), and SWB (0.15%). Table 3 displays the correlation matrix among the variables, i.e., SWB, REC,
260 NREC, GDP, and CO2. It is found that all the variables are positively related to subjective wellbeing except for
261 NREC.

262 Insert [Table 2]

263 Insert [Table 3]

264 The empirical findings of the cross-sectional dependence (CSD) test are reported in Table 4. Since the p-value is
265 less than 0.05, this suggest us to reject the null hypothesis of cross-sectional dependence. It reveals the existence
266 of cross-sectional dependence in all the variables. As a result, the evidence shows the presence of CSD for REC,
267 NREC, CO2, and GDP.

268 Insert [Table 4]

269 Table 5 reports the first-generation Fisher ADF unit root result. The findings show that subjective wellbeing is
270 stationary at level, but renewable energy consumption, non-renewable energy consumption, economic growth,
271 and CO2 emissions are found stationary at first difference. Overall, the considered variables are stationary either
272 at level or at first difference. Table 6 reports the second-generation unit root test, i.e., CADF. The results reveal
273 that the variables, i.e., SWB, REC, NREC, GDP, and CO2 emissions, contain unit roots at their level. However,
274 at their first order, they became stationary. We can conclude that all variables are integrated with first-order.

275 Insert [Table 5]

276 Insert [Table 6]

277 In order to assess the long run relationship among the variables, the variables of interest should be cointegrated.
278 This study uses three-panel cointegration tests such as the first-generation Kao, Pedroni cointegration, and second-
279 generation Westerlund (2007) variance tests to establish the long-run relationship between variables. The paper
280 initially explores the feasible cointegration among the variables using Kao (1999) panel cointegration test. The
281 empirical finding shows that three out of five statistics reject the null hypothesis of no long-run relationship
282 amongst the variables (Table 7). This implies that there is a presence of a long-run relationship as per the Kao
283 test. The paper also uses Pedroni (1999) cointegration test. In this test, three out of three statistics reject the
284 hypothesis of absence of panel cointegration amongst the variables (Table 7). So, Pedroni test of cointegration
285 test also suggests the presence of a long-run relationship among the variables. However, Kao and Pedroni
286 cointegration tests have one disadvantage. Both cointegration tests do not consider the presence of CSD among
287 the variable. To overcome this, we use a second-generation cointegration test, i.e., the Westerlund test. The results
288 of this test are presented in Table 7. This test suggests the presence of panel cointegration amongst the variables.

289 Insert [Table 7]

 8
290 To investigate the impact of REC, NREC, CO2, and GDP firstly, the pooled OLS, fixed effect, and random effect
291 model are applied for preliminary analysis. The results of these three models are presented in Table 8. It is found
292 from these three models that non-renewable energy consumption has a negative relationship with subjective
293 wellbeing. A correlation matrix also supports this finding. The literature suggests that fixed effect and random
294 effect models have cross-section dependence, serial correlation, and group-wise heteroscedasticity problems. This
295 is also supported by diagnostic tests, which are presented in Table 9. These diagnostic tests conclude that the fixed
296 effect model suffers from cross-sectional dependence, serial correlation, and panel group-wise heteroscedasticity
297 (Table 4 and Table 9).

298 Insert [Table 8]

299 Insert [Table 9]

300 To overcome the above discussed issues, the panel corrected standard error (PCSE) regression model is used. The
301 results of this model are presented in Table 10. The results of the model reveal that renewable energy consumption
302 has a positive impact on SWB at a 5% significance level. With a one percent increase in renewable energy
303 consumption, there is a 0.01% increase in SWB. This result is consistent with the studies (Qiao et al., 2019;
304 Sarpong et al., (2020); Paramati et al., 2017, Shahbaz et al., 2020; Pao & Fu, 2013). The result might be possible
305 due to (a) better utilization of REC gives happiness to the people as they feel less threatened of their actions on
306 the environment (b) REC reduces the carbon emissions and thus cleaner environment or better air quality lessens
307 the adverse effects on health (c) G20 countries are able to manage their GDP and therefore they did not suffer
308 from the scarcity of goods when shifting from NREC to REC. This argument can be supported by Paramati et al.
309 (2018) who found that the impact of renewable energy is higher on economic growth than non-renewable energy
310 in G20 countries.

311 However, the coefficient of non-renewable energy consumption is negative and significant at a 1% significance
312 level. It is found that with a one percent increase in non-renewable energy consumption, SWB gets reduced by
313 0.01%. The result is consistent with the studies (Okulicz-Kozaryn and Altman, 2020; Mazur and Rosa, 1974).
314 One of the primary reasons for having a negative coefficient of NREC is CO2 emissions which is the biggest
315 contributor to greenhouse gases and climate change, thus affecting people's lives directly. Secondly, increased use
316 of non-renewable energy does not assure a high level of SWB, as evident in the study of Okulicz-Kozaryn and
317 Altman (2020).

318 Also, the coefficient of CO2 emissions is negative and significant at 5% significance level. It implies that one
319 percent increase in CO2 emissions leads to a decrease in SWB by 0.12%. This finding is consistent with studies
320 (Tiwari, 2014; Zhang et al., 2017; Welsch 2006; Cuñado and Gracia, 2013; Paramati et al., 2017; Dong et al.,
321 2019; Ahmed et al., 2019).

322 Lastly, the result of the study shows that per capita GDP has a negative impact on subjective wellbeing at a 1%
323 level of significance. One percent increase in per capita GDP leads to 0.12% increase in SWB. The result implies
324 that G20 countries have been able to utilize the fruits of economic growth to enhance subjective wellbeing. This
325 result is consistent with the studies (Frijters et al., 2004; Hagerty & Veenhoven, 2003) and in contradiction with
326 (Di Tella & MacCulloch, 2008). It can be said that material prosperity have its importance in SWB in G20

 9
327 countries. It fulfils the basic needs and provide luxurious life; helps to attain the development goals in different
328 G20 countries. Summary of the findings are presented in Figure 7.

329 Insert [Table 10]

330 Insert [Figure 7]

331 4.1. Robustness Check

332 To ensure the robustness of the estimated coefficient in the PCSE model, the Newey-West standard model is
333 adopted in this paper. The outcomes of this model are presented in Table 11, shows similar estimates to the PCSE
334 model. Thus, it confirms that the estimated coefficients in the PCSE model are robust. Table 11 shows that a 1%
335 increase in renewable energy consumption increases SWB by 0.004%. Moreover, a 1% increase in GDP per capita
336 raises SWB by 0.12. A one percent rise in CO2 emissions reduces the SWB by 0.02% at a 5% significance level.

337 Insert [Table 11]

338 4.2. Dumitrescu-Hurlin Panel Granger Causality Test Findings

339 The paper also examines the panel granger causality test among the variables using the Dumitrescu-Hurlin (2012)
340 test. The result of this test is presented in Table 12. There is a bidirectional causality between CO2 and economic
341 growth, between REC and GDP, NREC and CO2, between REC and CO2, and REC and NREC. Pao et al. (2011)
342 also found bidirectional causality between economic growth and CO2. Moreover, finding of bidirectional causality
343 between renewable energy is consistent with Al-mulali et al. (2013), Sebri and Ben-Salha (2014), Saidi and
344 Mbarek (2016), and Ummalla and Samal (2019). We established a one-way causal relationship running from SWB
345 to CO2, from SWB to non-renewable energy consumption, and from non-renewable energy consumption to
346 economic growth.

347 Insert [Table 12]

348 5. Conclusion and Policy Implications

349 The world is dealing with the crisis of food, energy, and climate change. It is urgently needed to reduce fossil fuel
350 consumption, increase renewable energy production, and use the innovative path of improving energy efficiency
351 for creating a low carbon global society. It is only possible when the G20 countries will reduce their emissions
352 and come forward to help underdeveloped nations whose major population have not yet accessed electricity and
353 clean fuels. The study empirically investigated the impact of renewable energy consumption, non-renewable
354 energy consumption, economic growth, and CO2 emissions on subjective wellbeing in G20 countries during 2006-
355 2019. Our empirical results confirm that both economic growth and renewable energy consumption positively
356 influence subjective wellbeing in the selected G20 countries. Over the period, they realized the importance of
357 renewable energy production-consumption and chosen renewable-led economic growth path. These countries
358 have also invested in renewable sources of production techniques and awareness programs, which have enriched
359 their subjective wellbeing.

 10
360 Moreover, the findings of this study reveal that non-renewable energy consumption and CO2 emissions deteriorate
361 the subjective wellbeing in G20 countries. Based on these findings, we can propose several suggestions to reduce
362 CO2 emissions and non-renewable energy consumption. These countries can reduce their non-renewable energy
363 consumption by increasing investment in more renewables energy production, cleaner technologies, and
364 strengthening environmental protection policies. G20 summit on climate change should be taken earnestly not
365 only for adopting a green development path and sustainable energy consumption but also for enhancing citizens'
366 happiness, which is the ultimate goal of any nation. Further, to discourage non-renewable energy consumption,
367 these countries can reduce the fossil fuel subsidies. The study confirms a positive relationship between economic
368 growth and subjective wellbeing. Thus, it can be advocated to promote economic growth in these countries
369 because it can help in two ways. Firstly, shifting from non-renewable energy consumption to renewable energy
370 consumption in each sector of the economy will result in higher production cost, which can be fulfilled by high
371 growth. Secondly, research and development (R&D) for innovation in energy-saving technology demands bulk
372 investment for a longer duration which can be compensated by sustained growth.

373 The future scope of the paper is to explore the impact of renewable and non-renewable energy consumption in
374 different income group countries which can provide more insights. Moreover, the effect of different forms of
375 renewable and non-renewable energy consumption can be used to have a better understanding of the energy-
376 subjective wellbeing relationship. Studies based on primary data can also be used to understand this relationship
377 at the household level.

378 Declaration:

379 Ethics approval and consent to participate: Not applicable

380 Consent for publication: Not applicable

381 Availability of data and materials: Data will be made available upon request

382 Competing interests: We do not have any conflict of interest

383 Funding: There is no funding to report

384 Authors' contributions: Neha Kumari has done literature review part while Neha Kumari and Pushp Kumar have
385 made the analysis. While Naresh Chandra Sahu and Neha Kumari have compiled the introduction and literature
386 review. Pushp Kumar has done the overall formatting of the paper. All authors have read and approved the
387 manuscript.

388 Acknowledgements: Not Applicable

389 References

390 Afia, N. Ben. (2019). The relationship between energy consumption, economic growth and happiness. Journal of
391 Economic Development, 44(3), 41–57.

392 Ahmed, M. M., & Shimada, K. (2019). The effect of renewable energy consumption on sustainable economic
393 development: evidence from emerging and developing economies. Energies, 12(15), 2954.

 11
394 Pedroni, M. M., & Shimada, K. (2019). The effect of renewable energy consumption on sustainable economic
395 development: evidence from emerging and developing economies. Energies, 12(15), 2954.

396 Alam, M. S., Bala, B. K., Huq, A. M. Z., & Matin, M. A. (1991). A model for the quality of life as a function of
397 electrical energy consumption. Energy, 16(4), 739-745. https://doi.org/10.1016/0360-5442(91)90023-F.

398 Al-mulali Usama, Fereidouni, H. G., Lee, J. Y., & Sab, C. N. B. C. (2013). Examining the bi-directional long
399 run relationship between renewable energy consumption and GDP growth. Renewable and Sustainable
400 Energy Reviews, 22, 209–222. doi:10.1016/j.rser.2013.02.005

401 Case, A., & Deaton, A. (2015). Suicide, age, and wellbeing: An empirical investigation. In Insights in the
402 Economics of Aging (pp. 307-334). University of Chicago Press.

403 Churchill, A., Smyth, R., Farrell, L. (2020). Fuel poverty and subjective wellbeing. Energy Economics,
404 86(104650). https://doi.org/https://doi.org/10.1016/j.eneco.2019.104650

405 Cuñado, J., & de Gracia, F. P. (2013). Environment and Happiness: New Evidence for Spain. Social Indicators
406 Research, 112(3), 549–567. https://doi.org/10.1007/s11205-012-0038-4

407 Dash, D. P., Sethi, N., & Dash, A. K. (2021). Education, human error, and road crash risk: An empirical
408 investigation in the Indian states. . Journal of Public Affairs, 21(1). https://doi.org/10.1002/pa.2163

409 Diener, E. (2000). Subjective well-being: The science of happiness and a proposal for a national index. American
410 psychologist, 55(1), 34.

411 Di Tella, R., & MacCulloch, R. (2008). Happiness Adaptation to Income Beyond “Basic Needs” (No. w14539).
412 National Bureau of Economic Research.

413 Dong, K., Jiang, H., Sun, R., Dong, X. (2019). Driving forces andmitigation potential of global CO2 emissions
414 from 1980 through 2030: evidence from countries with different income levels. Science of the Total
415 Environment, 649, 335–343. https://doi.org/https://doi.org/10.1016/j.scitotenv.2018.08.326.

416 Dumitrescu, E. I., & Hurlin, C. (2012). Testing for Granger non-causality in heterogeneous panels. Economic
417 modelling, 29(4), 1450-1460. https://doi.org/10.1016/j.econmod.2012.02.014

418 Fanning, A. L., & O’Neill, D. W. (2019). The Wellbeing–Consumption paradox: Happiness, health, income, and
419 carbon emissions in growing versus non-growing economies. Journal of Cleaner Production, 212, 810–
420 821.

421 Ferrer-i-Carbonell, A., & Gowdy, J. M. (2007). Environmental degradation and happiness. Ecological
422 Economics, 60(3), 509–516. https://doi.org/https://doi.org/10.1016/j.jclepro.2018.11.223

423 Frijters, P., Haisken-DeNew, J. P., & Shields, M. A. (2004). Money does matter! Evidence from increasing real
424 income and life satisfaction in East Germany following reunification. American Economic Review, 94(3),
425 730–740. https://doi.org/doi/pdfplus/10.1257/0002828041464551

426 Giovanis, E., & Ozdamar, O. (2018). Health status, mental health and air quality: evidence from pensioners in
427 Europe. Environmental Science and Pollution Research, 25(14), 14206-14225.
428 https://doi.org/10.1007/s11356-018-1534-0

429 Goldthau, A. (2017). The G20 must govern the shift to low-carbon energy. Nature News. 546 (7657), 203.

 12
430 Gu, H., Yan, W., Elahi, E., & Cao, Y. (2020). Air pollution risks human mental health: an implication of two-
431 stages least squares estimation of interaction effects. Environmental Science and Pollution Research, 27(2),
432 2036-2043. https://doi.org/10.1007/s11356-019-06612-x

433 Hagerty, M. R., & Veenhoven, R. (2003). Wealth and Happiness Revisited – Growing National Income Does Go
434 with Greater Happiness. Social Indicators Research, 64(1), 1–27.
435 https://doi.org/https://doi.org/10.1023/A:1024790530822

436 Hao, H., Geng, Y., Li, W., & Guo, B. (2015). Energy consumption and GHG emissions from China's freight
437 transport sector: scenarios through 2050. Energy Policy, 85, 94-101.
438 https://doi.org/https://doi.org/10.1016/j.enpol.2015.05.016

439 IEA. (2020). World Energy Outlook 2020. Retrieved from https://www.iea.org/reports/world-energy-outlook-
440 2020

441 Ikpesu, F., Vincent, O., & Dakare, O. (2019). Growth effect of trade and investment in Sub-Saharan Africa
442 countries: Empirical insight from panel corrected standard error (PCSE) technique. Cogent Economics &
443 Finance, 7(1), 1607127. https://doi.org/10.1080/23322039.2019.1607127

444 Im, K. S., Pesaran, M. H., & Shin, Y. (2003). Testing for unit roots in heterogeneous panels. Journal of
445 econometrics, 115(1), 53-74. https://doi.org/10.1016/S0304-4076(03)00092-7

446 Kalt, G., Wiedenhofer, D., Görg, C., & Haberl, H. (2019). Conceptualizing energy services: A review of energy
447 and wellbeing along the Energy Service Cascade. Energy Research & Social Science, 53, 47–58.
448 https://doi.org/https://doi.org/10.1016/j.erss.2019.02.026

449 Kao, C. (1999). Spurious regression and residual-based tests for cointegration in panel data. Journal of
450 econometrics, 90(1), 1-44. https://doi.org/10.1016/S0304-4076(98)00023-2

451 Kazar, G., & Kazar, A. (2014). The renewable energy production-economic development nexus. International
452 Journal of Energy Economics and Policy, 4(2), 312.

453 Khan et al. (2014). Global estimates of energy consumption and greenhouse gas emissions. Renewable and
454 Sustainable Energy Reviews, (29), 336-344. https://doi.org/https://doi.org/10.1016/j.rser.2013.08.091

455 Kongkuah, M., Yao, H., Fongjong, B. B., & Agyemang, A. O. (2021). The role of CO 2 emissions and economic
456 growth in energy consumption: empirical evidence from Belt and Road and OECD
457 countries. Environmental Science and Pollution Research, 1-22. https://doi.org/10.1007/s11356-020-
458 11982-8

459 Kraft, J., & Kraft, A. (1978). On the Relationship Between Energy and GNP. The Journal of Energy and
460 Development, 3(2), 401–403. Retrieved from http://www.jstor.org/stable/24806805

461 Kumar, P., Sahu, N. C., & Ansari, M. A. (2021). Export Potential of Climate Smart Goods in India: Evidence
462 from the Poisson Pseudo Maximum Likelihood Estimator. The International Trade Journal, 1-21.

463 Levin, A., Lin, C. F., & Chu, C. S. J. (2002). Unit root tests in panel data: asymptotic and finite-sample
464 properties. Journal of econometrics, 108(1), 1-24. https://doi.org/10.1016/S0304-4076(01)00098-7

 13
465 Liu, B., & Matsushima, J. (2019). Annual changes in energy quality and quality of life: A cross-national study
466 of 29 OECD and 37 non-OECD countries. Energy Reports, 5, 1354-1364.
467 https://doi.org/10.1016/j.egyr.2019.09.040

468 Liu, J, Xin Sun, Bin Lu, Yunkun Zhang, and Rui Sun (2016). The life cycle rebound effect of air-conditioner
469 consumption in China. Applied Energy 184,1026-1032. https://doi.org/10.1016/j.apenergy.2015.11.100

470 Longhurst, N., & Hargreaves, T. (2019). Emotions and fuel poverty: The lived experience of social housing
471 tenants in the United Kingdom. Energy Research & Social Science, 56(101207).
472 https://doi.org/https://doi.org/10.1016/j.erss.2019.05.017

473 MacKay, D. (2008). Sustainable Energy - without the hot air. UIT cambridge.
474 https://doi.org/http://www.dspace.cam.ac.uk/handle/1810/217849

475 Mahalik, M. K., Mallick, H., & Padhan, H. (2021). Do educational levels influence the environmental quality?
476 The role of renewable and non-renewable energy demand in selected BRICS countries with a new policy
477 perspective. Renewable Energy, 164, 419-432. https://doi.org/10.1016/j.renene.2020.09.090

478 Mazur, A., & Rosa, E. (1974). Energy and life-style. Science, 186(4164), 607–610. Retrieved from
479 http://www.jstor.org/stable/1739169

480 Narayan, P. K., & Smyth, R. (2009). Multivariate Granger causality between electricity consumption, exports
481 and GDP: evidence from a panel of Middle Eastern countries. Energy Policy, 37(1), 229-236.
482 https://doi.org/10.1016/j.enpol.2008.08.020

483 Nathaniel, S., Barua, S., Hussain, H., & Adeleye, N. (2021). The determinants and interrelationship of carbon
484 emissions and economic growth in African economies: fresh insights from static and dynamic
485 models. Journal of Public Affairs, 21(1), e2141. https://doi.org/10.1002/pa.2141

486 Niu, S., Jia, Y., Wang, W., He, R., Hu, L., & Liu, Y. (2013). Electricity consumption and human development
487 level: A comparative analysis based on panel data for 50 countries. International Journal of Electrical
488 Power & Energy Systems, 53, 338-347. https://doi.org/10.1016/j.ijepes.2013.05.024

489 Okulicz-Kozaryn, A., Altman, M. (2020). The Happiness-Energy Paradox: Energy Use is Unrelated to
490 Subjective Well-Being. Applied Research Quality Life, 15, 1055–1067.
491 https://doi.org/https://doi.org/10.1007/s11482-019-09719-y

492 Ouedraogo, N. S. (2013). Energy consumption and human development: Evidence from a panel cointegration and
493 error correction model. Energy, 63, 28-41. https://doi.org/10.1016/j.energy.2013.09.067.

494 Owusu, P. A., & Asumadu-Sarkodie, S. (2016). A review of renewable energy sources, sustainability issues and
495 climate change mitigation. Cogent Engineering, 3(1).
496 https://doi.org/https://doi.org/10.1080/23311916.2016.1167990

497 Pedroni, P. (1999). Critical values for cointegration tests in heterogeneous panels with multiple
498 regressors. Oxford Bulletin of Economics and statistics, 61(S1), 653-670.

499 Pao, H.T., & Fu, H.C. (2013). Renewable energy, non-renewable energy and economic growth in Brazil.

 14
500 Renewable and Sustainable Energy Reviews. 25, 381–392. https://doi.org/10.1016/j.rser.2013.05.004

501 Paramati, S. R., Mo, D., & G. (2017). The effects of stock market growth and renewable energy use on CO2
502 emissions: Evidence from G20 countrie Frijters s, Energy Economics. Energy Economics, 66, 360–371.
503 https://doi.org/https://doi.org/10.1016/j.eneco.2017.06.025

504 Paramati, S. R., Apergis, N., & Ummalla, M. (2018). Dynamics of renewable energy consumption and economic
505 activities across the agriculture, industry, and service sectors: evidence in the perspective of sustainable
506 development. Environmental Science and Pollution Research, 25(2), 1375-1387.
507 https://doi.org/10.1007/s11356-017-0552-7

508 Qiao, H., Zheng, F., Jiang, H., & Dong, K. (2019). The greenhouse effect of the agriculture-economic growth-
509 renewable energy nexus: evidence from G20 countries. Science of the Total Environment, 671, 722–731.
510 https://doi.org/https://doi.org/10.1016/j.scitotenv.2019.03.336

511 Reed, W., & Rachel, W. (2010). The PCSE Estimator is Good--Just Not As Good As You Think. Journal of
512 Time Series Econometrics, 2(1), 1-26.

513 Rehdanz, K., & Maddison, D. (2005). Climate and happiness. Ecological Economics, 52(1), 111–125.
514 https://doi.org/https://doi.org/10.1016/j.ecolecon.2004.06.015

515 Rogelj, J., Den Elzen, M., Höhne, N., Fransen, T., Fekete, H., Winkler, H., & Meinshausen. (2016). Paris
516 Agreement climate proposals need a boost to keep warming well below 2 C. Nature, 534(7609), 631–639.
517 https://doi.org/https://doi.org/10.1038/nature18307

518 Saidi, K., & Ben Mbarek, M. (2016). Nuclear energy, renewable energy, CO 2 emissions, and economic growth
519 for nine developed countries: Evidence from panel Granger causality tests. Progress in Nuclear Energy,
520 88, 364–374. doi:10.1016/j.pnucene.2016.01.018

521 Sarkodie, S. A., & Strezov, V. (2019). Effect of foreign direct investments, economic development and energy
522 consumption on greenhouse gas emissions in developing countries. Science of the Total Environment, 646,
523 862–871. https://doi.org/https://doi.org/10.1016/j.scitotenv.2018.07.365

524 Sarpong, S. Y., Bein, M. A., Gyamfi, B. A., & Sarkodie, S. A. (2020). The impact of tourism arrivals, tourism
525 receipts and renewable energy consumption on quality of life: A panel study of Southern African region.
526 Heliyon, 6(11), e05351. https://doi.org/https://doi.org/10.1016/j.heliyon.2020.e05351

527 Sebri, M., & Ben-Salha, O. (2014). On the causal dynamics between economic growth, renewable energy
528 consumption, CO 2 emissions and trade openness: Fresh evidence from BRICS countries. Renewable and
529 Sustainable Energy Reviews, 39, 14–23. doi:10.1016/j.rser.2014.07.033

530 Shahbaz.M, Raghutla. C, Chittedi. KR, Jiao. Z, V. X. (2020). The effect of renewable energy consumption on
531 economic growth: Evidence from the renewable energy country attractive index. Energy.
532 https://doi.org/https://doi.org/10.1016/j.energy.2020.118162

533 Sheth, J. N., Sethia, N. K., & Srinivas, S. (2011). Mindful consumption: a customer-centric approach to
534 sustainability. Journal of the Academy of Marketing Science, 39(1), 21–39.

535 Shobande, O. A. (2020). The effects of energy use on infant mortality rates in Africa. Environmental and

 15
536 Sustainability Indicators, 5, 100015. https://doi.org/10.1016/j.indic.2019.100015

537 Smil, V. (2003). Global ecology: environmental change and social flexibility. Routledge.

538 Song, Y., Zhou, A., & Zhang, M. (2020). Exploring the effect of subjective air pollution on happiness in China.
539 Environmental Science and Pollution Research, 27(34), 43299-43311. https://doi.org/10.1007/s11356-
540 020-10255-8

541 Stiglitz, J. E., Sen, A., & Fitoussi, J. P. (2009). Report by the commission on the measurement of economic
542 performance and social progress.

543 Tiwari, A. (2014) Happiness and environmental degradation: What determines happiness. Economics Bulletin,
544 31(4), 3192-3210.

545 Ummalla, M., & Samal, A. (2019). The impact of natural gas and renewable energy consumption on CO 2
546 emissions and economic growth in two major emerging market economies. Environmental Science and
547 Pollution Research, 26(20), 20893-20907. https://doi.org/10.1007/s11356-019-05388-4

548 UNEP. (2020). Green pandemic recovery essential to close climate action gap – UN report. Press Release.

549 United Nations Environment Programme. (2020). Emissions Gap Report 2020. Retrieved from UNEP, UNEP
550 DTU Partnership

551 Veenhoven, R., & Ehrhardt, J. (1995). The cross-national pattern of happiness: Test of predictions implied in three
552 theories of happiness. Social Indicators Research, 34(1), 33–68.
553 https://doi.org/https://doi.org/10.1007/BF01078967

554 Wang, Z., Bui, Q., & Zhang, B. (2020). The relationship between biomass energy consumption and human
555 development: Empirical evidence from BRICS countries. Energy, 194, 116906.
556 https://doi.org/10.1016/j.energy.2020.116906

557 Welsch, H. (2006). Environment and happiness: Valuation of air pollution using life satisfaction data.
558 Ecological Economics, 58(4), 801–813. https://doi.org/10.1016/j.ecolecon.2005.09.006

559 Welsch, H., & Biermann, P. (2019). Poverty is a public bad: Panel evidence from subjective well‐being data.
560 Review of Income and Wealth, 65(1), 187-200.

561 Westerlund, J. (2007). New simple tests for panel cointegration. Econometric Reviews, 24(3), 297-316.
562 https://doi.org/10.1080/07474930500243019

563 Yu, E., & Choi, J. (1985). The Causal relationship between energy and GNP: An intenational comparison. The
564 Journal of Energy and Development, 10(2), 249–272. https://doi.org/http://www.jstor.org/stable/24807818

565 Yuan, L., Shin, K., & Managi, S. (2018). Subjective wellbeing and environmental quality: the impact of air
566 pollution and green coverage in China. Ecological economics, 153, 124-138.
567 https://doi.org/10.1016/j.ecolecon.2018.04.033

568 Zhang, S., Shi, Q., & Cheng, M. (2017). Renewable natural capital, the biocapacity, and subjective wellbeing.
569 Journal of Cleaner Production, 150, 277–286.
570 https://doi.org/https://doi.org/10.1016/j.jclepro.2017.03.021.

 16
571 Zhang, X., Zhang, X., & Chen, X. (2017). Happiness in the air: How does a dirty sky affect mental health and
572 subjective wellbeing? Journal of Environmental Economics and Management, 85, 81–94.
573 https://doi.org/10.1016/j.jeem.2017.04.001

 17
Table 1. Description of the Variables

 Symbol Description Source
 lnSWB Life ladder in natural logarithm World Happiness Report
 Renewable energy consumption per capita (kWh) in natural
 lnREC Energy Statistics
 logarithm
 Nonrenewable energy consumption per capita (kWh) in
 lnNREC Energy Statistics
 natural consumption
 World Development
 lnCO2 CO2 emissions per capita in natural logarithm
 Indicators
 World Development
 lnGDP GDP per capita in natural logarithm
 Indicators

Table 2. Summary Statistics of the Variables

 Variable Observations Mean Standard Deviation Minimum Maximum
 lnSWB 266 1.806 0.154 1.178 2.044
 lnREC 264 7.349 1.923 -2.813 10.344
 lnNREC 266 2.334 0.923 0.890 4.793
 lnCO2 266 1.936 0.740 0.099 3.015
 lnGDP 266 9.746 1.014 7.009 10.954

Table 3. Correlation Matrix

 lnSWB lnREC lnNREC lnCO2 lnGDP
 lnSWB 1
 lnREC 0.369 1
 lnNREC -0.203 0.056 1
 lnCO2 0.464 0.051 0.210 1
 lnGDP 0.768 0.393 -0.089 0.739 1

Table 4. Cross-Sectional Dependency Test

 CD-test P-value
 lnSWB 0.55 0.584
 lnREC 28.2*** 0.000
 lnGDP 29.04*** 0.000
 lnNREC 4.77 0.000
 lnCO2 0.12 0.904
Note. *** p
Table 5. Fisher ADF Unit Root Test

 At level At first difference
 Variables Statistics P-value Statistics P-value
 Inverse Chi2 P 71.068 0.001 153.814 0.000
 Inverse normal Z -2.497 0.006 -8.323 0.000
 lnSWB
 Inverse logit L -2.515 0.007 -9.437 0.000
 Modified inverse Chi2 Pm 3.793 0.000 13.285 0.000
 Inverse Chi2 P 36.985 0.516 144.746 0.000
 Inverse normal Z 2.281 0.989 -7.654 0.000
 lnREC
 Inverse logit L 2.182 0.984 -8.809 0.000
 Modified inverse Chi2 Pm -0.116 0.546 12.245 0.000
 Inverse Chi2 P 27.569 0.894 191.221 0.000
 Inverse normal Z 2.919 0.998 -8.861 0.000
 lnGDP
 Inverse logit L 2.822 0.997 -11.674 0.000
 Modified inverse Chi2 Pm -1.197 0.884 17.576 0.000
 Inverse Chi2 P 71.003 0.001 109.224 0.000
 Inverse normal Z -1.291 0.098 -5.212 0.000
 lnNREC
 Inverse logit L -2.009 0.024 -6.080 0.000
 Modified inverse Chi2 Pm 3.786 0.000 8.170 0.000
 Inverse Chi2 P 31.048 0.781 133.492 0.000
 Inverse normal Z 1.014 0.845 -7.274 0.000
 lnCO2
 Inverse logit L 1.073 0.857 -8.117 0.000
 Modified inverse Chi2 Pm -0.797 0.787 10.954 0.000

Table 6. CADF Unit Root Test

 At level At first difference
 Variables t-bar P-value t-bar P-value
 lnSWB -2.428 0.242 -3.771 0.000
 lnREC -1.658 0.049 -7.841 0.000
 lnGDP -2.424 0.247 -3.176 0.000
 lnNREC -1.649 0.991 -3.273 0.000
 lnCO2 -1.836 0.948 -3.264 0.000

 19
Table 7. Cointegration Tests

 Kao Test for Cointegration
 Statistic P-value
 Modified Dickey-Fuller t -0.736 0.231
 Dickey-Fuller t -1.709** 0.044
 Augmented Dickey-Fuller t -0.409 0.341
 Unadjusted modified Dickey -5.391*** 0.000
 Unadjusted Dickey-Fuller t -4.232*** 0.000
 Pedroni Test for Cointegration
 Modified Phillips-Perron t 3.482*** 0.000
 Phillips-Perron t -5.511*** 0.000
 Augmented Dickey-Fuller t -6.086*** 0.000
 Westerlund Test for Cointegration
 Variance ratio (all panel are cointegrated) 1.352* 0.088
 Variance ratio (some panel are cointegrated) -1.344* 0.090
Note. *** p
Table 9. Diagnostic Tests

 Chi-square P-value
 Heteroscedasticity 13245.76*** 0.000
 Serial-Correlation 7.372** 0.014
Note: *** p
Table 12. Dumitrescu-Hurlin Panel Granger Causality Tests

 Null Hypothesis: W-Stat. Zbar-Stat. Prob. Conclusion
 lnGDP does not homogeneously cause lnSWB 1.900 1.309 0.191
 lnSWB does not homogeneously cause lnGDP 1.975 1.459 0.145

 lnCO2 does not homogeneously cause lnSWB 1.630 0.764 0.445
 lnSWB does not homogeneously cause lnCO2 2.982 3.487*** 0.001 lnSWB → 2

 lnNREC does not homogeneously cause lnSWB 2.028 1.566 0.118
 lnSWB does not homogeneously cause lnNREC 2.828 3.178*** 0.002 lnSWB → lnNREC

 lnREC does not homogeneously cause lnSWB 1.412 0.314 0.754
 lnSWB does not homogeneously cause lnREC 1.654 0.798 0.425

 lnCO2 does not homogeneously cause lnGDP 2.680 2.879*** 0.004 lnCO2 ↔ lnGDP
 lnGDP does not homogeneously cause lnCO2 3.002 3.528*** 0.000

 lnNREC does not homogeneously cause lnGDP 2.117 1.745* 0.081 lnNREC → lnGDP
 lnGDP does not homogeneously cause lnNREC 1.358 0.218 0.828

 lnREC does not homogeneously cause lnGDP 2.374 2.235** 0.025 lnREC ↔ lnGDP
 lnGDP does not homogeneously cause lnREC 2.899 3.284*** 0.001

 lnNREC does not homogeneously cause lnCO2 2.654 2.828*** 0.005 lnNREC ↔ lnCO2
 lnCO2 does not homogeneously cause lnNREC 2.881 3.283*** 0.001

 lnREC does not homogeneously cause lnCO2 3.497 4.478*** 0.000 lnREC ↔ lnCO2
 lnCO2 does not homogeneously cause lnREC 3.155 3.794*** 0.000

 22
You can also read