Estimation of sky view factor in complex environment as a tool for ap- plied climatological studies
←
→
Page content transcription
If your browser does not render page correctly, please read the page content below
534

Estimation of sky view factor in complex environment as a tool for ap-
                     plied climatological studies
                          Olaf Matuschek, Andreas Matzarakis

                Meteorological Institute, Albert-Ludwigs-University Freiburg,
                            Werthmannstr. 10, 79085 Freiburg
                                         Abstract
Graphic processors can be implemented in computation models, e.g. in three-
dimensional flow visualization. Another possibility going a step further, and propose
modern graphics hardware to be used as general-purpose vector computers. These ideas
and approaches use a cheap mass technology to solve specific problems. This technol-
ogy and way can be applied for climate conditions or climate relevant parameters in
urban scale or complex environments. Following benefits are provided from the new
model: (a) short computing time and (b) low costs though the use of open source
frameworks. We chose the implementation of sky view factor (SVF) for each point in a
complex area, given by a digital elevation model (DEM) and urban obstacles (OBS) in
order to quantify relevant climatic conditions in urban and complex areas.

1.     Introduction
We show how 3D hardware can be used to improve modeling of sky view factor (SVF)
in complex urban environments. Modelling of climate processes in urban areas is still
challenging, some authors find it to be one of the most difficult areas in climatology
(MATZARAKIS, 2001; KUTTLER, 2004a, b). The visible horizon is modified by surround-
ing urban structures and obstacles, radiation fluxed are altered. This results in alteration
of a location’s bioclimate, as radiation fluxes are one of the main factors of thermal
comfort equations. The modification of urban structures can be estimated by measure-
ment or calculation of sky view factor (MATZARAKIS et al., 2007). SVF is one of the
most relevant input parameters for estimating radiation fluxes in complex environments.
Powerful yet cheap graphic processors have recently been employed to implement com-
putation intensive models, e.g. in three-dimensional flow visualization (CUNTZ et al.
2007). Other researchers use modern graphics hardware as a general-purpose vector
computer (THOMPSON et al., 2002). The idea is the same: a cheap mass technology is
utilized to solve specific and specialized problems. This approach can be applied in cli-
mate or urban climate modelling as well.
We start with an overview of traditional methods of calculating SVF. A short chapter on
different methods of utilizing graphics hardware follows. We then present the new effi-
cient SVF model SkyHelios to calculate continuous SVF. In two examples, one vector,
and one raster based, the chances and drawbacks of both approaches are shown. Finally
the possibilities and limits of the new model are examined and discussed.

2.     Methods to estimate SVF
Measurement and calculation of SVF has some history in urban climate research
(STEYN 1980; JONHSON & WATSON 1984; WATSON & JOHNSON; 1987, 1988; HOLMER,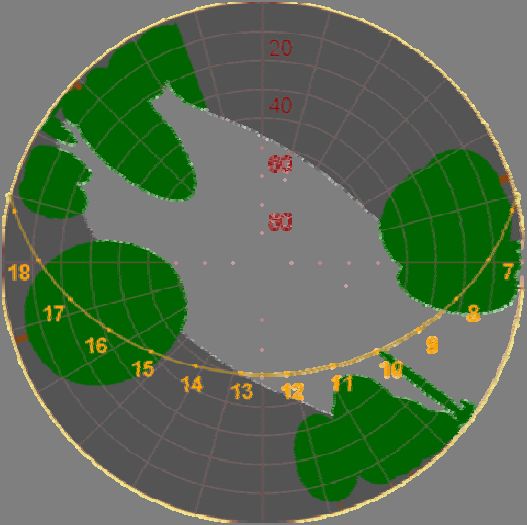
535
1992), though is still subject to intensive research (LITTLEFAIR, 2001; GRIMMOND et al.,
2001; RATTI et al. 2004; MATZARAKIS et al., 2007; GÁL et al., 2008).
Fig. 1: Example of a modelled sky view factor image and its relation to the surround-
ing urban structure. a) view from top. b) birds eye view on the scene. c) sky
view image. Sunpath shown for 48°N mid of April
The most traditional way to measure SVF ist to take a 180° fisheye photograph (CHEN
& BLACK, 1991, LITTLEFAIR, 2001). Usually the camera sits on a tripod at 1 m height,
with a fisheye lens looking into the sky. Different ways have been examined to asses
sky view information from the photo, including scaled paper paper (JOHNSON & WAT-
SON 1984; FRAZER et al., 2001), computer programs helping to manual track the sour-
roundings (HOLMER, 1992; CHAPMAN et al., 2001; HOLMER et al., 2001; TELLER and
AZAR, 2001; MATZARAKIS et al., 2007), and fully automatic tracking of the sourround-
ings by software (CHAPMAN et al., 2001; BRUSE and FLEER, 1998). Augmented with
digital cameras, this last approach can lead to a very quick assessment of SVF at a parti-
clar spot.
Instead of taking photographs, sky view factor can be calculated from digital models of
the environment. (BRUSE and FLEER, 1998; TELLER and AZAR, 2001; MATZARAKIS et
al., 2007). Calculation of SVF is based on knowledge of each angle element of the
hemispheric environment and associated elevation (in connection with produced
shadow) angle β and azimuth angle α. Accordingly, the sky view factor Ψs can be as-
sumed to be the sum of all this angle information over the whole hemispheric environ-
ment.
a
s 1 i sin 2 i i
360
Caclulating SVF has the benefit that is it no longer required to actually go out and take a
picture, a process in which a lot of errors can occur. Instead the models, e.g. RayMan
(MATZARAKIS et al., 2007), allow for quickly assessing SVF at different locations.
Some models even allow for calculation of continuous sky view factor, i.e. the spacial
distribution of sky view factors in an area or whole city (GÁL et al., 2008). Most models
are based on representations of buildings (SOUZA et al. 2003) or digital elevation mod-
els (DEM) (GÁL et al., 2008), allowing only for simple shaped building and flat roofs.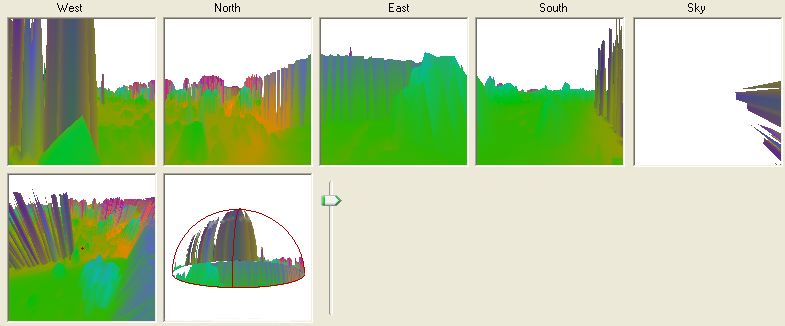
536
A few models are based on the idea of obstacles, allowing for modelling non-flat roofs
and trees as well (MATZARAKIS et al., 2007). Including non-flat roofs and trees into
modelling seems to be cruical at least for modelling central european cities.
Fig. 1 shows the connection between surrounding structures and a SVF image. The sky
view factor can be easily caclulated from it by dividing the area of the image that is not
covered by obstacles by the total image area. Sky view factor in the example in Fig. 1 is
0.31, i.e. only 31 % of the sky is visible. The sunpath is shown for a latitude of 48° mid
of April. Even though the sun is above the horizon from ca. 6:00 am to 7:00 pm, the
selected location gets direct sunshine only from ca. 8:15 am to 1 pm.
3. Utilizing graphics hardware for modelling
While graphics hardware has primarily been developed to perform graphics display on a
personal computer, modern 3D-graphics hardware has reached a level at which it can be
seen as a general purpose vector computer (THOMPSON et al. 2002). A vector computer
is one that performs the same operation on multiple data sets very efficiently. Therefore
modern 3D-hardware has a lot of potential appplications in modelling, e.g. three dimen-
sional climate flow data visualization (CUNTZ et al. 2007). More possibilities arise,
when one does not only visualize modelling results, but reads results back from the
graphics hardware. When applicable for vector processing, time intensive modelling
algorithms can be transferred on the graphics hardware, with the result of a substancial
reduction in processing time in the order of several magnitudes. We transferred the SVF
calculation algorithm on the graphics hardware, making use both of the graphics render-
ing capabilities of the hardware as well of its function as a general purpose vector com-
puter.
1
2
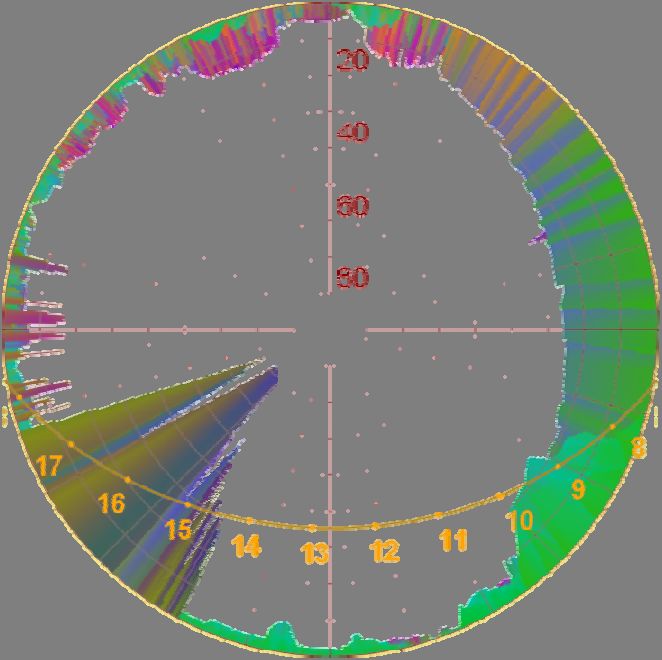
Fig. 2: Screenshot of SkyHelios and view of the sky view factor image (based on to-
pographical data) with sun locations for Freiburg end of July. Arrow indicates
selected location for the Sky View Factor537
4. Raster and vector calculations with SkyHelios model
Fig. 2 shows am image of the user interface of SkyHelios. A digital elevation model
(DEM) has been loaded and is shown for orientation in the left part of the sceen. A cir-
cle indicates current position for the calculation of the sky view factor image and SVF.
The sky view factor image is shown on the right, overlaid with the sun positions at a
latitude of 48° N for a date end of July. When “production mode” is checked, the SVF
for the correspodung location is immediately calculated. Since making use of 3D graph-
ics hardware, calculation of SVF with SkyHelios is fast. There is no delay between se-
lecting the location and display of resulting SVF.
Fig. 3: A location in Freiburg, Germany, based on laser data. Top view, sky view factor
image for a tripod height of 10 m and corresponding bird’s eye view as well as
view into all for directions and the sky
Fig. 3 shows sky view factor calculation of a location in Freiburg, Germany. The calcu-
lation is made with a DEM based on laser data with a resolution of 1 m. The top view
image shows a building to the east, and a row of probably trees to the west. There are
more building and trees to the north and south. The corresponding SVF image was cal-
culated for a tripod height of 10 m, giving a SVF of 0.69. Using a laser DEM for calcu-
lation of sky view factor allows for a rapid estimation of sky view factor for a whole
city (GÁL et al., 2008). The sky view factor image and more so the side views and the538 bird’s eye view though clearly show drawbacks of using raster DEM. While the build- ing to the east seems to be quite well modelled, what are probably trees appears to be hight but narrow “needles” looking into the sky. Their shape e.g. trunk and crown can not be modelled with a DEM based approach. The vector based approach, shown on Fig. 1, allows for modelling of trees and non-flat roof buildings as well. It has the draw- back that vector models of cities are not as readily available as are DEM. 5. Discussion and conclusion We show how computer graphics hardware can improve climate 3D modelling in ap- plied climatology for complex environments. Several visualization techniques can help understanding of possibilities and limits when modelling SVF. SkyHelios allowes to export results for dispay in the climate mapping tools (MATUSCHEK and MATZARAKIS, 2010). Frequently-used data formats (i.e., laser or satellite data) are supported. Direct implementation of RayMan obs files (MATZARAKIS et al., 2007) is an advantage, and furthermore the combination of raster and vector approaches is possible. The visualization of morphological factors (especially in urban areas) helps to under- stand micrometeorological processes. The sky view factor expresses the morphological factors for a specific site in one single value, and therefore allows for an estimation of relevant climatological information. We plan to implement the spatial extension of ra- diation fluxes and the mean radiant temperature with very high resolution. In order to get radiation fluxes, many additional features (such as shadow generation and sunshine duration) are required from the morphological option. SkyHelios is freely available and can be requested from the authors. References Chapman, L., J. E. Thornes, A.V. Bradley, 2001: Rapid determination of canyon geometry pa- rameters for use in surface radiation budgets. Theoretical and Applied Climatology 69, 81– 89. Chen, J. M., T. A. Black, 1991: Measuring leaf area index of plant canopies with branch archi- tecture. Agric. Forest Meteorol. 57, 1–12. Cuntz, N., A. Kolb, M., Leidl, C., Rezk-Salama, M. Böttinger, 2007: GPU-based Dynamic Flow Visualization for Climate Research Applications. In: Schulze, T.; Preim, B.; Schumann, H. (Hg.): Simulation und Visualisierung 2007 (SimVis 2007), 8-9 März 2007, Magdeburg: SCS Publishing House e.V., 371–384. Gál, T., F. Lindberg, J. Unger, 2008: Computing continuous sky view factors using 3D urban raster and vector databases: comparison and application to urban climate. Theoretical and Applied Climatology 95, 111-123. Grimmond, C. S. B, S. K. Potter, H. N. Zutter, C. Souch, 2001: Rapid methods to estimate sky- viw factors applied to urban areas. Int. J. Climatology 21, 903-912. Holmer, B., 1992: A simple operative method for determination of sky view factors in complex urban canyon from fisheye photographs. Meteorol. Z., NF 1, 236–239. Holmer, B., Postgärd, U., Eriksson, M., 2001: Sky view factors in forest canopies calculated with IDRISI. Theor. Appl. Climatol. 68, 33–40. Johnson, G. D, I. D. Watson, 1984: The determination of view-factors in urban canyons. J. Clim. Appl. Meteorol. 23, 329–335. Kuttler, W., 2004a: Stadtklima, Teil 1: Grundzüge und Ursachen. UWSF – Zeitschrift für Um- weltchemie und Ökotoxikologie 16, 187-199. Kuttler, W., 2004b: Stadtklima, Teil 2: Phänomene und Wirkungen. UWSF – Zeitschrift für Umweltchemie und Ökotoxikologie 16, 263-274.
539

Littlefair, P., 2001: Daylight, sunlight and solar gain in the urban environment. Solar Energy 70,
   177–185
Matzarakis, A., 2001: Die thermische Komponente des Stadtklimas. Ber. Meteorol. Inst. Univ.
   Freiburg Nr. 6
Matzarakis, A., F. Rutz, H. Mayer, 2007: Modelling Radiation fluxes in simple and complex
   environments – Application of the RayMan model. Int. J. Biometeorol. 51, 323-334.
Matuschek, O., A. Matzarakis, 2010: Climate Mapping Tool – Creating maps for climatological
   and biometeorological applications. Meteorological Applications (submitted).
MOGRE, 2009: MOGRE. URL: http://www.ogre3d.org/wiki/index.php/MOGRE [Stand: 16.
   Januar 2009].
Ratti, C., P. Richens, 2004: Raster analysis of urban form. Environment and Planning B: Plan-
   ning and Design 31, 297–309.
Souza, L. C. L., D. S. Rodrigues, J. F. Mendes, J. F., 2003: The 3dskyview extension: an urban
   geometry access tool in a geographical information system. Proceedings of the Fifth Interna-
   tional Conference on Urban Climate (ICUC-5), Lodz.
Steyn, D. M., 1980: The calculation of view factors from fisheye lens photographs. Atmos-
   phere-Ocean 18, 254-258.
Teller, J., S. Azar, 2001: TOWNSCOPE II - A computer system to support solar access deci-
   sion-making. Solar Energy 70, 187-200.
Thompson, C. J., S. Hahn, M. Oskin, 2002: Using modern graphics architectures for general-
   purpose computing: a framework and analysis. MICRO 35. Proceedings of the 35th annual
   ACM/IEEE international symposium on Microarchitecture. Los Alamitos, CA, USA: IEEE
   Computer Society Press, 306–317.
Watson, I. D., G. T. Johnson, 1987: Graphical estimation of sky viewfactors in urban environ-
   ments. J. Climatology 7, 193–197.
Watson, I. D. Johnson, G. T., 1988: Estimating person view factors from fish-eye lens photo-
   graphs. Int. J. Biometeorol. 32, 123–128.

Authors’ address:
Olaf Matuschek (olaf.matuschek@uni-freiburg.de)
Prof. Dr. Andreas Matzarakis (andreas.matzarakis@meteo.uni-freiburg.de)
Meteorological Institute, Albert-Ludwigs-University of Freiburg
Werthmannstr. 10, D-79085 Freiburg, Germany
You can also read