Global Warming by Anthropogenic Heat Release - Arnold, Heinrich: URN: urn:nbn:de:gbv:ilm1-2009200065
←
→
Page content transcription
If your browser does not render page correctly, please read the page content below
Arnold, Heinrich:

Global Warming by Anthropogenic Heat Release

© 2009

Technische Universität Ilmenau/Universitätsbibliothek

Postfach 10 05 65
98684 Ilmenau
www.tu-ilmenau.de/ilmedia

URN: urn:nbn:de:gbv:ilm1-2009200065
Heinrich ARNOLD1

              Global Warming by Anthropogenic Heat Release

In the 2007 report by the Intergovernmental Panel on Climate Change (IPCC) [1], “Anthro-
pogenic Heat Release” is the heading of a section (2.5.7 from Working Group I), where it is
stated that “human energy production is a small influence at the global scale” on temperature.
Therefore it has been neglected in all calculations, even in those reaching up to the year 3000
(within section 10.7.2 from Working Group I). These calculations will be discussed after the
contrary results by R. Döpel in his earlier publication “On the geophysical limit of industrial
energy production” [2]. His simple calculations have been compared to the IPCC results by
the author in an updated form under the title “Robert Döpel and his model of global tempera-
ture increase: An early warning – and its updating” [3]2. The most important results are given
in Fig. 1, corresponding to “Bild 1” in [2]. Their calculations shall be given concisely.

Calculations according to Döpel

The global radiation balance is σTe4 = ls = 239 W/m2, where σ is the STEFAN-BOLTZ-
MANN constant, Te (255 K) is the effective radiation temperature of the atmosphere, and ls is
the net solar radiation flux density into the atmosphere. Approximating the differential quo-
tient dls / dTe by the difference quotient results in

                Te                                        K m2
        ΔTe =       Δls = λe Δls = λe Fw , with λe = 0.27      .
                4ls                                        W

In a contemporary terminology, λe is the climate sensitivity constant with respect to the
atmosphere and the additional flux density of energy Δls is the climate forcing Fw due to the
anthropogenic heat release (W/m2). (Alternatively, with Δls = Fs from variations of solar
radiation, their influence can be discussed in a first approximation with the solar climate sen-
sitivity constant λs = λe [3].)

1
 Tech. University Ilmenau, Inst. for Physics, PO Box 10 05 65, D 98684 Ilmenau, Germany
2
  In this context biographical data and earlier works by Robert Döpel (1895-1982), especially in experimental
nuclear physics for energy production in cooperation with his wife and with the theoretician Werner Heisenberg
have been described. They were the first physicists to achieve a net neutron production within a uranium pile
(1942): http://www.deutsches-museum.de/archiv/archiv-online/(Geheimdokumente)

                                                                                                             1
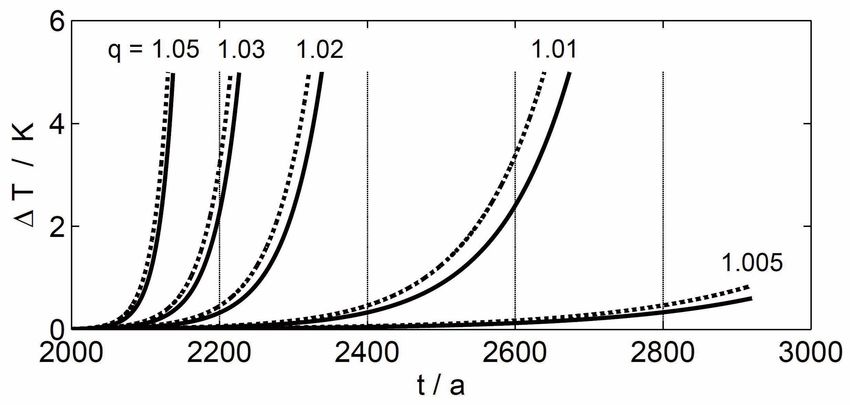
Fig. 1. Time-dependent increase of the global temperature as a function of the rate of annual
increase in anthropogenic heat release by the factor q.
Solid lines: ΔT = ΔTe, the change of the effective temperature of the atmosphere (Te = 255 K)
due to anthropogenic heat release (corresponding to the curves for Te by Döpel [2]).
Dashed lines: ΔT = ΔTob, which is a “very probable” lower limit for the change of the mean
global surface temperature ΔTs (288 K) due to anthropogenic heat release.

For Fw Döpel assumed an exponential increase with an annual enhancement coefficient q
(corresponding to a growth of (q−1)% p.a.) :
        Fw = Fw,o exp([q − 1] ⋅ Δt / a) ≈ Fw,o ⋅ q Δt / a .

Starting with the year 2000, we take3 Fw,o = 0.023 W/m2, which yields the solid curves in
Fig. 1. Since Döpel’s starting year 1970, the annual increase has been approximately 2% in
average [4]. Consequently, his curve for q = 1.02 is approximately consistent with the data in
Fig. 1. The differences for the other q values are also marginal, since the influence of changes
in the pre-exponential factor is small compared to the influence of q.

This factor has to be enlarged due to feedbacks (owing to additional clouds, melting ice sheets
etc.), which have not been taken into account quantitatively by Döpel. He merely declares
ΔTe as the lower limit of the increase ΔTs,w of the global mean surface temperature ΔTs (288 K
3
  „Hauptgutachten 2003 des Wissenschaftlichen Beirats ‚Globale Umweltveränderungen’ der BRD“: http://
www.wbgu.de/wbgu_jg2003.html . Here, 13% have been subtracted from the total value in Tab. 4.4-1 due to
regenerative energies.

                                                                                                      2
or 15°C) due to the anthropogenic heat release. As the upward transport of this additional heat
is driven by the difference between Ts and Te, Te cannot become smaller than Ts.
To estimate the difference between ΔTs,w and ΔTe, this quantity has been compared with the
corresponding difference for the anthropogenic greenhouse effect due to CO2 [3]. Already
early estimations have started with ΔTe,c = λeFc without feedbacks. For a doubling of the CO2
concentration since pre-industrial time, the actual forcing formula [1; 5] gives
Fc,do = 3.7 W/m2, resulting in ΔTe,do = 1.0 K. This can be compared with the climate sensi-
tivity S and especially with its “equilibrium” value (after very long times) Sgl = ΔTs,dogl. Exten-
sive model calculations with statistical evaluations [1] showed that Sgl amounts “very likely”
(which means with a probability of 90%) to more than 1.5 K. Therefore, a factor of 1.5 has
been applied to obtain a “very probable” lower limit ΔTob = 1.5ΔTe of the increase ΔTs,w of the
global mean surface temperature, resulting in the dashed curves in Fig. 1.
The IPPC report [1] further remarks that Sgl “probably” (which means a probability of 66%)
lies between 2 and 4.5 K. The “best estimate” is 3 K and corresponds to ΔTs,w = 3ΔTe. How-
ever, one has to account for several uncertainties with respect to the feedbacks, e.g. that Sgl is
specific for CO2 exchanging with the ocean, while only an exchange of heat has to be con-
sidered here. Additionally, ΔTs,w is an actual and not an equilibrium quantity. In spite of such
uncertainties, ΔTs,w supposedly is less than an order of magnitude larger than ΔTe .
Comparison with IPCC results – and the limits of growth
Fig. 1 has to be compared with part (b) of Fig. 2, which shows the global mean surface
warming ΔTs,c from IPCC calculations due to the fictitious [CO2] scenario given in part (a).
The fictitious result from both effects is ΔTs = ΔTs,c+ΔTs,w, which significantly lies above the
ΔTs,c curves from CO2 alone in later centuries, if release of heat continues to grow exponen-
tially.
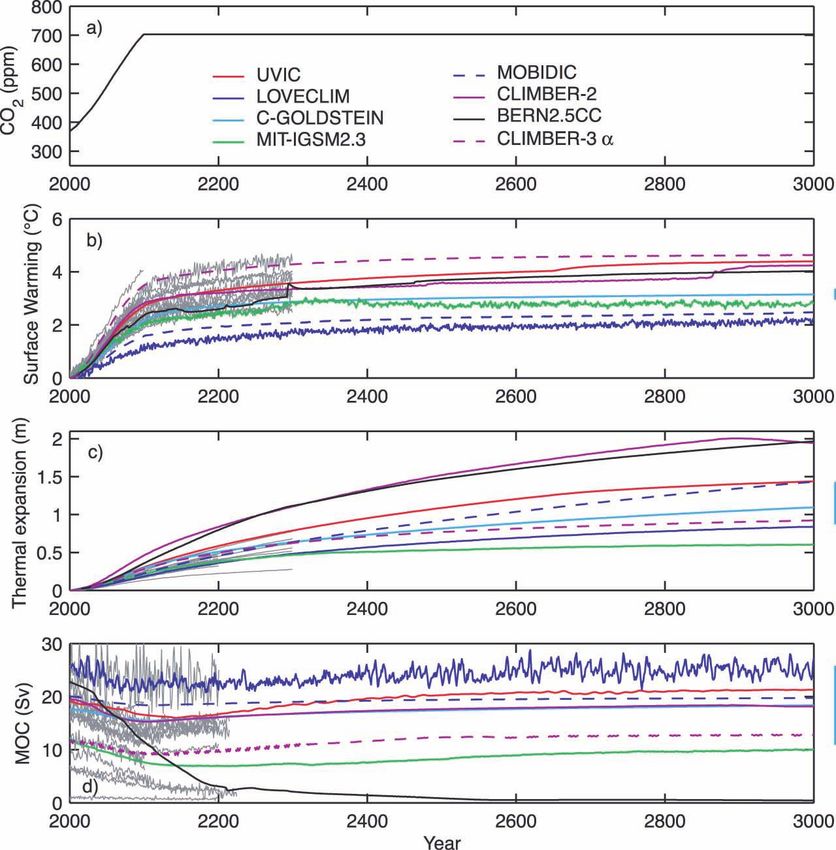
3Fig. 2
is identical with Figure 10.34 from [1], chapter 10, and has to be reproduced here without any
change and with the full legend4:
“(a) Atmospheric CO2 ,
(b) global mean surface warming,
(c) sea level rise from thermal expansion and
(d) Atlantic meridional overturning circulation (MOC)
calculated by eight EMICs for the SRES A1B scenario and stable radiative forcing after 2100,
showing long-term commitment after stabilisation. Coloured lines are results from EMICs,
grey lines indicate AOGCM results where available for comparison. Anomalies in (b) and (c)
4
The chapter and parts from it have to be cited as: Meehl, G.A., T.F. Stocker, W.D. Collins, P. Friedlingstein,
A.T. Gaye, J.M. Gregory, A. Kitoh, R. Knutti, J.M. Murphy, A. Noda, S.C.B. Raper, I.G. Watterson, A.J.
Weaver and Z.-C. Zhao, 2007: Global Climate Projections.
In: Climate Change 2007: The Physical Science Basis.Contribution of Working Group I to the Fourth
Assessment Report of the Intergovernmental Panel on Climate Change [Solomon, S., D. Qin, M. Manning, Z.
Chen, M. Marquis, K.B. Averyt, M. Tignor and H.L. Miller (eds.)].
Cambridge University Press, Cambridge, United Kingdom and New York, NY, USA.
4are given relative to the year 2000. Vertical bars indicate ±2 standard deviation uncertainties
due to ocean parameter perturbations in the C-GOLDSTEIN model. The MOC shuts down in
the BERN2.5CC model, leading to an additional contribution to sea level rise. Individual
EMICs (see Table 8.3 for model details) treat the effect from non-CO2 greenhouse gases and
the direct and indirect aerosol effects on radiative forcing differently. Despite similar atmos-
pheric CO2 concentrations, radiative forcing among EMICs can thus differ within the uncer-
tainty ranges currently available for present-day radiative forcing (see Chapter 2).“
Abbreviations:
EMIC - Earth System Model of Intermediate Complexity.
AOGCM - Atmosphere-Ocean General Circulation Model, the most complex climate model
type at present.
SRES - Special Report on Emission Scenarios (IPCC 2000), URL:
http://www.ipcc.ch/ipccreports/sres/emission/index.htm.
__________________________________________________________________________
On the other hand, Döpel has discussed the hypothesis of the exclusive use of photovoltaic
energy5, resulting in a constant global temperature. For the solar input ls, he estimated a
utilization coefficient K = 6⋅10-3 (vs. 1.2⋅10-3 according to [1], WG III Tab. 4.2.). Together
with the factor of 1.5 due to the “very probable” lower limit for ΔTs,w (vide supra), the annual
temperature increase is
−1 K ls −1 4 ⋅10−3 ls 4 ⋅102
Δt K / a = (ln q ) ln ≈ (q − 1) ln ≈
1.5 Fw,o Fw,o q −1
Starting with year 2000, the time of constant global temperature ΔtK would be approximately
200, 400, or 800 years for q = 1.02, 1.01, or 1.005, respectively, corresponding to an annual
increase in the anthropogenic heat release by 2, 1, or 0.5%. After those time intervals6, non-
photovoltaic energy would have to be used (with limited possibilities for the other regenera-
tive energies). So, the curves in Fig. 1 will hold soon again.
Starting with the year 1970 and an annual increase of the anthropogenic heat release by 5%,
which was slightly below the increase rates of those times, Döpel calculated the possible
5
The corresponding heading of section 5.3 in [2] reads: Most intensive utilization of the insolated solar energy.
6
If non-regenerative energies were used instead during those time intervals, ΔTs,w would be less than 0.5 K. On
the other hand, the anthropogenic greenhouse effect already has caused ΔTs,c = 0.8 K from the beginning of
industrial times.
5“photovoltaic time” to end in the midst of the 21st century7. In each case, his conclusion
reveals that the gradual change to a constant energy production is the only possibility to pre-
vent a threatening increase of global temperatures due to heat release. (With such a change,
the projections in Fig. 2 could become more realistic.)
This most important result of Döpel’s work from 1973 concerning sustainability corresponded
to the more general statements on the “Limits of Growth” [6] published for the first time in
the famous report to the Club of Rome [6] that had appeared just one year before. But only in
the second report, released in 1974 [7], the risks of anthropogenic heat release were men-
tioned in this context, whereas they have been omitted again in an update from 2004 [8]. The
discussion of their influence seems to be repressed widely by the greenhouse gas problems,
which are much more imperilling at present.
Of course, CO2-free techniques, as they are presumed in the projections of Fig. 2, have abso-
lute priority. But the most tax-supported of these techniques, especially nuclear fusion, are not
sustainable due to heat release and radioactive waste, and even regenerative energies will
allow further growth of production only for a transition time of few generations, as we have
seen above.
On the other hand, for nuclear waste deposition, safety for one million years (due to half-
times) will become a governmentally accepted condition, e.g. in Germany. However, more
attention has to be paid for sustainability with respect to the next decades and centuries. With
regard to the current economical problems that endanger commencements of a global climate
policy, the Deputy Chairman of the German Council for Sustainable Development Klaus
Toepfer8 has delivered the following statement:
„The collapse of the financial industry and the real economy can be overcome despite great
difficulties. The collapse of a planet ruined by climate change cannot.”
7
At that time, nuclear fusion energy is expected to become available commercially [1] for the strongly growing
human population.
8
http://www.nachhaltigkeitsrat.de/en/the-council/council-members/profdrklaus-toepfer/. From 1998-2006, K.
Toepfer has been Executive Director of the UN Environmental Programme (UNEP). In 2009, he was appointed
founding director of the Institute for Advanced Sustainability Studies (IASS) at Potsdam, Germany.
6References
[1] International Panel on Climate Change (IPCC), Assessment Report (AR) 4. Cambridge
University Press 2007. URL: http://www.ipcc.ch
[2] Döpel, R., Über die geophysikalische Schranke der industriellen Energieerzeugung. Wiss.
Zeitschrift TH Ilmenau 19 (1973) H. 2, S. 37-52. URL:
http://www.db-thueringen.de/servlets/DocumentServlet?id=12380 .
[3] Arnold, H., Robert Döpel und sein Modell der globalen Erwärmung: Eine frühe Warnung
– und die Aktualisierung. Universitätsverlag Ilmenau
( http://www.tu-lmenau.de/universitätsverlag ) 2009.
[4] World Energy Council, URL: http://worldenergycom with a booklet “Energie für
Deutschland 2006” for download fromURL: http://www.weltenergierat.de
[5] Myrhe, G., et al., New estimates of radiative forcing due to well mixed greenhouse gases.
Geophys. Research Letters 25 (1998), p. 2715-2718.
[6] Meadows, D., et al., Limits to growth. Universe Books, New York 1972.
[7] Mesarovic, M., Pestel, E., Mankind at the Turning Point. 2nd Report to the Club of Rome.
Dutton, News York 1974.
[8] Meadows, D., et al., Limits to growth: the 30-year update. Chelsea Green Publ. Co. 2004.
7You can also read