ESWATINI COVID-19 IN A RAPID SOCIOECONOMIC ASSESSMENT OF - United Nations Development ...
←
→
Page content transcription
If your browser does not render page correctly, please read the page content below
A RAPID SOCIOECONOMIC ASSESSMENT OF

COVID-19 IN      ESWATINI

A RAPID SOCIOECONOMIC ASSESSMENT OF

COVID-19 IN        ESWATINI
This assessment is a joint effort of the United Nations System in Eswatini in collabora-
tion with the Economics Association of Eswatini. It is prepared as part of the broader
development support to the Government of the Kingdom of Eswatini to contribute to
the national response to COVID-19.

Copyright © 2020

Published by

United Nations Development Programme
4th Floor
UN House
Somhlolo Road
P O Box 261
Mbabane,
Eswatini
Prelims

Contents
Acronyms & Abbreviations                                                                                                              v
Key messages                                                                                                                         vii

Introduction                                                                                                                             1
            COVID-19 Summary Statement                                                                                                   2
            COVID-19 Situation at a Glance                                                                                            2
                                                                                                                                      9
Transmission Channels
                                                                                                                                     11
COVID-19 Impact on Economic Growth under two scenarios                                                                               13
            Strategic Sectors of the Economy: Eswatini Strategic Roadmap (ESR), National Development Plan
            (NDP)                                                                                                                    14
Fiscal Policy                                                                                                                        19
            Fiscal Implications of COVID-19                                                                                          21
Social Dimension of COVID-19                                                                                                         25
            Poverty, Unemployment and Inequality                                                                                     25
            Food Security                                                                                                            28
            Education                                                                                                                29
            Health and Nutrition                                                                                                     31
            Water and Sanitation and Hygiene                                                                                         33
            Vulnerable Groups                                                                                                        33
            Persons with Disabilities                                                                                                34
            The Elderly                                                                                                              35
            Children                                                                                                                 35
Micro, Small and Medium-sized Enterprises (MSMEs)                                                                                    37
            Shutdown Impacts on SMEs                                                                                                 40
            Supply Chain Disruptions                                                                                                 40
            Demand Depression and Induced Confinement                                                                                40
            Recovery                                                                                                                 41
            Social Cohesion                                                                                                          41
            Impact of COVID-19 on Women’s Sexual and Reproductive Health and Rights                                                  41
            COVID-19 and Gender-Based Violence                                                                                       42
                                                                                                                                     43
Conclusion and Recommendations
                                                                                                                                     43
            Policy Responses to the Crisis – Recommendations

                                                                                                                                     49
Endnotes

Figures
                                                                                                                                         1
Figure 1:   Cumulative COVID-19 Positive Cases
                                                                                                                                     10
Figure 2:   Eswatini Trade Position with Other Countries
                                                                                                                                     14
Figure 3:   GDP Growth Pre & Post COVID-19

                                                                      A Rapid Socioeconomic Assessment of COVID-19 in Eswatini       v
Prelims

Figure 4:     Impact of COVID-19 on Sector Growth                    15
Figure 5:     Fiscal Balance 2016-2020                               19
Figure 6:     Public Debt Position                                   20
Figure 7:     Lilangeni Exchange Rate vis-à-vis the US Dollar        20
Figure 8:     Discount and Inflation Rates                           21
Figure 9:     Human Development Simulation on Inequality             25
Figure 10. Primary Causes of Death in Eswatini (2017)                31
Figure 11: Households Hosting HIV Members                            32
Figure 12: Ownership of MSME by Gender                               38
Figure 13: Size and Scope of the MSME and Turnover Per Sector        39
Figure14: Impact of COVID-19 on MSME Shutdown                        40

Tables
Table 1: Scenario Analysis of Pre- & Post COVID-19                   13
Table 2: Impact of COVID-19 on Sector Growth under Two Scenarios     15
Table3: Effects Of COVID-19 on Poverty Trends                        26
Table 4: Eswatini Closure of Learning Institutions                   29

Annexes                                                              50

 vi       A Rapid Socioeconomic Assessment of COVID-19 in Eswatini
Prelims

Acronyms & Abbreviations
AGOA 		    African Growth and Opportunity Act
AIDS		     Acquired Immune Deficiency Syndrome
ART		      Antiretroviral therapy
CBE 		     Central Bank of Eswatini
COVID-19   Coronavirus Disease 2019
DSA		      Debt Sustainability Analysis
EODB 		    Ease of Doing Business
ESR 		     Eswatini Strategic Roadmap
EU		       European Union
FAO		      Food Agricultural Organization
FODSWA     Federation of the Disabled in Eswatini
GBV 		     Gender Based Violence
GDP		      Gross Domestic Product
GNI		      Gross National Income
HIV 		     Human Immunodeficiency Syndrome
ICT		      Information, Communication, Technology
IFC		      International Finance Corporation
IMF		      International Monetary Fund
HDI 		     Human Development Index
HOTAS 		   Hotel and Tourism Association
ICU		      Intensive Care Unit
IPC		      Integrated Food Security Phase Classification
MEFMI		    Macroeconomic and Financial Management Institute
MENA		     Middle East and North Africa
MEPD		     Ministry of Economic Planning and Development
MIC		      Middle Income Country
MOH		      Ministry of Health
MoET 		    Ministry of Education and Training
MSMEs 		   Micro, Small and Medium-sized Enterprises
MCP 		     Multidimensional Child Poverty
MOET		     Ministry of Education and Training
MSF		      Médecins Sans Frontières
NACS 		    Nutrition Assessment Counselling and Support
NCPs 		    National Care Points
NDMA 		    National Disaster Management Agency
NDP 		     National Development Plan
NEP 		     National Emergency Plan
NERMAP     National Emergency Risk Mitigation and Adaptation Plan
OCHA		     United Nations Office of Humanitarian Affairs
OECD		     Organisation for Economic Co-operation and Development
OVC		      Orphaned and Vulnerable Children
PEPFAR		   President’s Emergency Plan for AIDS Relief

                                                          A Rapid Socioeconomic Assessment of COVID-19 in Eswatini      vii
Prelims

PLHIV 		              People Living with HIV
PPE		                 Personal Protective Equipment
SARB 		               South African Reserve Bank
SACU 		               Southern Africa Customs Union
SADC		                Southern African Development Community
SDGs 		               Sustainable Development Goals
SNECD 		              Swaziland Network for Early Childhood Development
SRH 		                Sexual Reproductive Health
SSA		                 Sub-Saharan Africa
TB		                  Tuberculosis
TEBA		                The Employment Bureau of Africa
UN		                  United Nations
UNAIDS 		             Joint United Nations Programme on HIV & AIDS
UNDP		                United Nations Development Programme
UNESCO		              United Nations Educational, Scientific and Cultural Organization
UNESWA                University of Eswatini
WASH		                Water, Sanitation and Hygiene
WFP		                 World Food Programme
WHO 		                World Health Organization
WLSA 		               Women and Law in Southern Africa

 viii     A Rapid Socioeconomic Assessment of COVID-19 in Eswatini
Prelims

Key Messages
There is exponential growth in new infections                     Too much reliance on South Africa has exposed the
with the highest being the productive age group                   vulnerability of the country. The trade list of essential
which means there is an implication for labour                    products had to be made consistent with products
supply.                                                           allowed by South Africa, exports to SACU (43.9 per cent)
                                                                  and imports to SACU (71.8 per cent). Lockdown of borders
Manzini, the commercial nerve centre and national                 and air transport in South Africa has a direct implication on
transport hub of Ngwenya-Mbabane-Manzini, is also the             exports.
epicentre of the virus. This is the underlying reason for
considering this a health crisis, a humanitarian crisis and a     As a net importer of food and given the 58.9 per cent of
socioeconomic crisis.                                             people living below the nationally defined poverty line
                                                                  in addition to the 20.1 per cent living in extreme poverty,
Whether in scenario 1 or 2, Rapid Assessment suggests             COVID-19 is potentially going to exacerbate food insecurity
that the economy will be in contraction mode. Recession           in the country. Furthermore, about 65,800 people would
is anti-growth and anti-development. NDP suggests that a          likely be added to the existing number of those living
minimum of 5 per cent growth rate is needed to achieve            below the poverty line because of weak growth outcomes
sustainable progress. GDP at constant prices means                due to the negative impact of COVID-19 in just 2020 alone.
levelling the economy roughly within 2014-2015. It is like        Approximately 15,550 would have been lifted out of
a five-year setback. Budget requires substantial adaptation       poverty if the pre-COVID-19 per capita growth was to be
as SACU revenues are not promising. The fiscal deficit is         realized.
likely to be at -9 to -11 per cent, and in either scenario, the
economy is contracting.                                            Human development is facing an unprecedented hit since
                                                                  the concept was introduced in 1990,1 Globally, COVID-19-
Population growth over the years 2020-22 is estimated at          adjusted HDI is projected to see a steep decline in 2020
0.9 per cent per annum. Given the estimated decline of            with close to six years of progress wiped out.
the GDP growth rates, per capita income will decline by an
annual average rate of 0.4 per cent under scenario 1 and          School dropout rates might rise, school closures have higher
0.6 per cent under scenario 2. This means the average living      social and economic costs for communities, particularly
standards in the country will decline as a result of COVID-19.    to vulnerable boys and girls. The girl child faces higher
                                                                  vulnerabilities than boys, and school closures increase the
Economic policy in 2020-21 will, instead, be dictated by          risk of hunger for orphaned children.
efforts to restore macroeconomic stability in the aftermath
of a severe economic contraction in 2020 (owing to the            Health spending skewed to tertiary care, and the costs
simultaneous supply and demand shock delivered to                 of medical products are high. Women and infants face
the global economy by the outbreak of the coronavirus             serious risk with lockdowns as most of the medical supplies
pandemic and the subsequent lockdown of significant               necessary for pregnancy, antenatal care and infant care are
Swazi economic partners such as South Africa).                    imported.

Manufacturing supply disruptions means the ability of             People living with HIV & AIDS and TB are at a high risk of
businesses to sustain the workforce is limited if the supply      contracting COVID, and people with disabilities are at a
contraction from China continues for long.                        higher risk because physical distancing norms cannot be
                                                                  followed in most instances. Elderly population face both

                                                                      A Rapid Socioeconomic Assessment of COVID-19 in Eswatini       ix
Prelims

health and income risks, as remittances to support them                   The primary sector has shown some resilience; hence
are affected owing to lockdowns in other countries.                       it is crucial to invest in the sector to deal with poverty
                                                                          and vulnerabilities. The challenges have to be clearly
The food insecurity to which the people are exposed has                   understood as low productivity among smallholders has a
shown the limited investments made into the agricultural                  long-term impact not just on food insecurity but also the
sector, which employs 70 per cent of the rural population.                rest of the socioeconomic sector.

      x        A Rapid Socioeconomic Assessment of COVID-19 in Eswatini
Introduction
Introduction
This Rapid Socioeconomic Assessment is an the framework, in terms of the people we must reach under
undertaking of the United Nations (UN) in the five pillars of the proposed UN Development System
collaboration with the Economics Association of response, namely health first, protecting people, economic
Eswatini. It is a contribution to the knowledge response and recovery, macroeconomic response and
products on the COVID 19 pandemic in the multilateral collaboration; and community cohesion and
country. Given the uncertainty and volatility in community resilience.
conditions of the Corona virus outbreak and
gaps in data supply and analysis, this knowledge The Kingdom of Eswatini, like the rest of the world, faces a
product is not offered as accurate predictions of stubborn pandemic that threatens the health and wellbeing
the future but as an evidence-based estimate of the nation as it relentlessly spreads across the globe.
of likely scenarios to inform socioeconomic The index case of COVID-19 in Eswatini was confirmed
response and recovery planning. on 14 March 2020. By 17 March 2020, the Prime Minister
invoked section 29 of the Disaster Management Act 2006
The Rapid assessment is aligned with the “UN framework and declared a National Emergency in the Kingdom of
for the immediate socio-economic response to COVID-19” Eswatini for two months. During this period Eswatini had
launched by the Secretary-General in April 2020. The registered at least 169 travellers from overseas with 124 of
framework is one of the three critical components of the those from China. The government introduced surveillance
UN’s efforts to save lives, protect people, and build healthier measures to track travellers and strengthen emergency
communities through health response, led by the World preparedness. These included a cancellation of national
Health Organization, and the humanitarian response led by events (e.g. Army Day, the King’s birthday celebration,
United Nations Office for the Coordination of Humanitarian Good Friday and Easter services); a cancellation of social
Affairs (OCHA). This Rapid Assessment addresses aspects of events (e.g. MTN Bushfire Festival, Intervarsity Games, etc.);
the closure of schools and tertiary institutions, limiting of
FIGURE 1 Cumulative COVID-19 Positive Cases
250
Confirmed +v Cases Recorveries
225 225
217 220
208
202 203 205
200
190
184 187 187
175 172 175
163
159
153
150
125 123
116 119
112
106 108
100
100
91
75 71
69
56 59
50
40
36
31 32
25 22 24
17 19
12 14 15 16
5 6 9 9 10
4
1
0
06-Apr
08-Apr
11-Apr
13-Apr
15-Apr
16-Apr
17-Apr
18-Apr
20-Apr
21-Apr
22-Apr
23-Apr
24-Apr
25-Apr
26-Apr
27-Apr
28-Apr
29-Apr
30-Apr
01-May
02-May
03-May
04-May
05-May
06-May
07-May
08-May
09-May
10-May
11-May
12-May
13-May
14-May
15-May
16-May
17-May
18-May
19-May
20-May
21-May
22-May
14-Mar
22-Mar
24-Mar
25-Mar
26-Mar
31-Mar
A Rapid Socioeconomic Assessment of COVID-19 in Eswatini 1Introduction
social gatherings to 20 people; the continued screening of giving space to the economy to breathe and allowing
and contact tracing, etc.2 industries – mainly in the manufacturing and production
sector with international orders to fulfil – to start operating.
The objective of this report is to conduct a preliminary rapid COVID-19 regulations remained effective with all members
socioeconomic assessment of the COVID-19 pandemic of the population expected to abide by the partial
in Eswatini as well as the implications it has for achieving lockdown measures. The Prime Minister, in his COVID-19
national development objectives enshrined in the National statement on 8 May 2020, said the partial lockdown would
Development Plan, Strategic Roadmap and Sustainable be downgraded on an incremental basis in complete
Development Goals (SDGs). Based on the assessment, conformity with a phased-approach, consistent with
some policy recommendations aimed at reducing the guidelines from the World Health Organization.
country’s vulnerability and strengthening its resilience to
COVID-19 are highlighted. The assessment is rapid in the The country has been zoned according to disaster severity
sense of being done over a very short period without going and appropriate measures applied to monitor and enforce
into much detail, and preliminary in the sense of producing compliance. Even though the measures have inflicted a
a live document to be updated as more information comes significant shock to the nation’s social and cultural life as
to light. The report is a desk review of literature from a well as on an already weak economy, they were justifiable
variety of sources supplemented by interactions with in the interest of stopping the upward trajectory of new
representatives of various institutions and affected sectors. infections. This was expected to flatten the steeply upward
In keeping with the restrictions imposed by government curve and drive it down. Evidence accumulated in the past
since 14 March 2020, consultations were conducted mostly month suggests that the epidemic has not responded to
virtually. current measures and that new infections may not have
reached the peak yet.
This Rapid Socioeconomic Assessment was undertaken
under WHO guidelines on COVID 19, and it is a product of As Figure 1 demonstrates, the curve of accumulative new
the efforts of a wide UN team, comprising the UNCT Task infections continued to rise exponentially. The first 10
Team (UNDP WFP and UNFPA), an inter-agency technical cases in the first 10 days quickly rose to 16, which became
team (RCO, UNDP, UNICEF, FAO, ILO, IOM, UNFPA, WFP) 32 in four days. The 32 index cases became 64 within the
working in collaboration with the Economics Association next four days. Between 14 March and 12 May, COVID-19
of Eswatini. This team was led by UNDP, which is the infections have risen from 1 to 163 cases. Health workers
UN’s global technical lead on socio-economic response are now processing, on average, 122 tests per day. Some
to COVID-19 under the global UN framework for the cases are referred from police roadblocks, and this has
immediate socioeconomic response to COVID-19. become an important source of COVID-19 information.
COVID-19 Summary Statement COVID-19 Situation at a Glance
The government established emergency coordination Subsequent sections of this report are organized as follows:
structures that would implement the COVID-19 National the second section analyses the channels of transmitting
Emergency Plan. These committees include a Cabinet COVID-19 in Eswatini, while the third examines the
sub-committee, an Emergency Task Force, as well as macroeconomic impact. The following section analyses the
Regional and Sector Committees. A partial lockdown was social impact, followed by an outline of the government’s
introduced on 27 March 2020 and reinforced on 27 April containment measures. The final section makes
2020 and 8 May 2020. The easing of the partial lockdown recommendations with a focus on policy interventions.
came into effect on 8 May 2020, with the primary objective
2 A Rapid Socioeconomic Assessment of COVID-19 in EswatiniIntroduction
Gender Distribution
COVID-19 infects men and women without gender disparity.
The pandemic has hit the economy hard.
Of the infected, 67 per cent are people of working age.
Number of Cases Diagnosed by Sex and Age
COVID-19 Cases by Sex COVID-19 Cases by Age
female male
45 39.39%
40
35
30 27.27%
50.51 25
49.49 20
15 14.14 14.14
10
5 1.1% 2.2% 2.2%
0
0-9 10-19 20-29 30-39 40-49 50-59 60-69
No disparities in sex distribution
67% of cases are young people 20-39 years
COVID-19 Cases by Region of Residence
Commerce Is Hardest Hit
Manzini, the commercial centre and national
transport nexus is the epicentre of the virus. 2,2%
11,11%
The number and size of port entries also
correlate with infection rates:
•• 17 per cent Hhohho – 3 major ports 17,17%
•• 11 per cent Lubombo – 2 major ports
•• 2.2 per cent Shiselweni – 1 major port 69,70%
Manzini Hhohho Lubombo Shiselweni
A Rapid Socioeconomic Assessment of COVID-19 in Eswatini 3Introduction
Consistent with its central location and commercial activity, Manzini has the highest population and the highest number
of infections.
Is the Curve Flattening?
So far, three COVID-19-related deaths have been recorded in two months.
Health authorities are preparing for the possibility of a surge in infections and hospital beds.
Cumulative Number of Infections
Base case scenario RO-40%
cumulative symptomatic cases cumulative symptomatic cases
1,250,000 1,250,000
Population Population
1,000,000 1,000,000
750,000 750,000
500,000 500,000
250,000 250,000
0 0
0 30 60 90 120 150 180 210 240 270300 330 360
0 30 60 90 120 150 180 210 240 270300 330 360
Days since first introduction Days since first introduction
Total Under 20 20-60 Over 60 Total Under 20 20-60 Over 60
Source: Nhlabatsi N, Harling G, Lukhele B. (Baylor)
Epidemic Model Curve
Each infected person has the potential to infect others. The surge in infections is related to the number of
people infected before the source of infection is stopped.
Eswatini Modelled Epidemic Curve
β-1.30-07
β-1.30-07
5 β-1.30-07
5 x 10 β-1.30-07
Infectious Population
4
3
2
1
0
0 100 200 300 400
Time (days)
Source: Malinzi et al (UNESWA Mathematical Modelling Group)
4 A Rapid Socioeconomic Assessment of COVID-19 in EswatiniIntroduction
Social Distancing Potential Impact
Social distancing, handwashing and face masks are the primary modalities for preventing infections. What is
their potential impact?
Potential Impact of Social Distancing
No action No action
Fewer Infections 40% Deferred Peak 40%
50% Social 50% Social
60% distancing 60% distancing
70% effect 70% effect
80% 80%
350,000 350,000
300,000 289,336 (265,340 (337,750) 300,000 May 20th
250,000 250,000
200,000 186,293 (181,610 (239,820) 200,000 June 7th
141,120 (116,340 (202,560) June 17th
150,000 150,000
96,565 (64,380 (153,940) July 4th
100,000 100,000
42,056 (0) 92,480) August 6th
50,000 50,000
3,685 (0) 17,820) November 14th
0 0
Mar-23May-02 Jun-11 Jul-21 Aug-30Oct-09 Nov-18Dec-28 Mar-23May-02 Jun-11 Jul-21 Aug-30Oct-09 Nov-18Dec-28
Source: Pierce C et al (CHAI)
Implications of Lockdown
The effect of reduced shopping days:
•• Once a week
•• Thrice a week
•• Five times a week
•• Six times a week
Potential Impact of Limiting Shopping
Limited Trading Days Savvy Shoppers
35 (a) Open everyday 35 (b) Baseline
Open 6-days-a-week Every-other-day
30 Open 5-days-a-week 30 Once-a-week
Open 3-days-a-week
25 Open once-a-week 25
% Infected
% Infected
20 20
15 15
10 10
5 5
0 0
0 50 100 150 200 250 300 0 50 100 150 200 250 300
t (days) t (days)
Source: Mkhonta SK et al (UNESWA COVID-19 Project)
A Rapid Socioeconomic Assessment of COVID-19 in Eswatini 5Introduction
Potential Impact on Hospitals
Impact of reduced travel and commercial activity can be translated into a potential reduction in hospital
admissions and ICU pressure.
Potential Need for Hospital Care
No action No action
Hospital Admissions 40% ICU Admissions 40%
50% Social 50% Social
60% distancing 60% distancing
70% effect 2,000 70% effect
80% 1,699 (1,560 (2,040) 80%
1,750
15,000 14,496 (13,200) 16,530) 1,500 1,122 (1,120 (1,460)
12,500 1,250
895 (780 (1,330)
10,000 9,665 (9,580) 12,410) 1000
7,571 (6,270) 10,230)
7,500 750 561 (410 (930)
5,114 (3,630) 8,150) Hospital capacity
5,000 N2,500 beds 500 ICU Capacity
263 (0 (540) ~10
2,346 (0) 4,940)
2,500 250
208 (0) 890) 31 (0 (120)
0 0
02
0
11
18
3
28
1
9
-3
-2
02
0
11
l-2
t-0
18
3
28
1
9
-
n-
v-
c-
-3
ay
g
-2
l-2
t-0
ar
-
n-
Ju
v-
c-
Oc
Au
Ju
No
De
ay
g
ar
M
M
Ju
Oc
Au
Ju
No
De
M
M
Source: Pierce C et al (CHAI)
Even under the best case scenario, potential for insufficient hospital and ICU beds
Case for Social Distancing
Social distancing, together with handwashing, is the primary intervention against infection.
Effectiveness of this intervention is projected to pay off in lives saved at various levels.
Potential Deaths Averted by Social Distancing
Senario Cummulative Deaths Deaths Averted (Best Fit)
4,150
No action -
(3,980/4,320)
3,985
40% (3,710/4,260) 165
Social distancing effect
3,652
50% (3,270/4,290) 458
3,505
60% (3,120/3,890) 645
1,710
70% 2,440
(0/1,420)
610
80% 3,485
(0/1,330)
Source: Pierce C et al (CHAI)
COVID-19 Hotspots
The risk profile of the Kingdom suggests the Ngwenya-Mbabane-Manzini highway corridor linking with South Africa is the po-
tential national hotspot.
The narrative is consistent with other ports of entry into South Africa.
6 A Rapid Socioeconomic Assessment of COVID-19 in EswatiniIntroduction A Rapid Socioeconomic Assessment of COVID-19 in Eswatini 7
Transmission Channels

Transmission Channels
The transmission channels of COVID-19 can be            (January 2020 projections) from 3.4 per cent (October 2019
traced to direct, and indirect routes and its impact    projections) in light of the slow performance in emerging
felt across the various points of the intricate web     market economies.3 His Majesty, the King, in his State of
of the value chains. Also, this has a huge effect       the Nation Address, had announced that the economy of
on the demand- and supply-side of the economy           Eswatini would project a growth rate of 2.8 per cent in 2020.4
because it disrupts both international and              Private consumption and investment fuelled by a decline in
domestic supply chains of goods and services.           consumer demand due to disrupted economic activity and
While movements of people are being restricted          uncertainty have obviously affected the economic growth
in several countries, trade across borders has          of the country. The disruptions have worsened the food
continued in a very limited way, at least for now.      insecurity, given reduced food production during the year.

The supply shock will, in turn, affect household        Furthermore, the quarantine measures will result in a sharp
consumption and have a ripple on effect on demand. As   supply-side shock, hitting working hours and productivity.
demand falls, the economy will experience a slowdown.   Manufacturers will suffer from a disruption of their global
This development has prompted the IMF review 2020       supply chains after global exports contracted by more than
global growth projections downwards to -3.3 per cent    17 per cent in the first two months of the year. Supply-side

                                                            A Rapid Socioeconomic Assessment of COVID-19 in Eswatini    9
Transmission Channels
disruptions will be short-lived, but demand effects will in Eswatini are micro and small enterprises, the owners
be long-lasting. On the whole, manufacturers’ activities mostly lack the safety nets to resist the shock.
have been restricted, save for those that produce essential
products such as food, sanitizers, and protective clothing At the moment, 58.9 per cent of Emaswati live below the
and masks. Manufacturers, especially in the labour- nationally defined poverty line, which makes them6 even
intensive textile factories, have been allowed to resume more vulnerable to the economic shocks brought on by
production to fulfil international orders. COVID-19. But the levels of deprivations and vulnerabilities
vary. For those just above the poverty line, COVID-19 may
Businesses that experience reduced revenue and job cuts easily bring them further below the poverty threshold. In
will compel households to reduce their expenditure.5 Eswatini, 20.1 per cent of the population lives in extreme
Lower demand will make businesses to cut down on their poverty.
production and retrench workers. Job losses and lower
demand for goods tend to reinforce each other, risking Food insecurity among households is another manifestation
the creation of a vicious cycle. And since most businesses of vulnerability. Eswatini as a whole is extremely food
FIGURE 2 Eswatini Trade Position with Other Countries
Exports by trading partner
North America, 2.46% Oceania, 0.02%
South America, 0.31%
Rest of SSA, 8.94%
MENA, 0.45%
SACU
43.93%
EU, 25%
Asia, 1.3%
Other Europe,
1.86%
SADC (excl. SACU),
15.72%
Imports by trading partner
North America, 1.79% MENA, 3.01%
Oceania, 0.05%
South America, 0.52%
Asia, 16.11%
SACU
Rest of SSA, 0.09% 71.85%
EU, 5.31%
SADC (excl. SACU), 0.98%
Other Europe, 0.29%
10 A Rapid Socioeconomic Assessment of COVID-19 in EswatiniTransmission Channels
insecure and has shifted from being a net exporter of food of essential products such as smart phones, iPads, sim
to net Importer since the 1990s.7 COVID- 19 pandemic has cards and routers, all items they could not replenish easily
the potential to worsen the situation in which case women without free movement of people and goods.
and the rural population will suffer the most.
The absence of free movement of goods and services
Eswatini is a landlocked country that is almost totally reliant have had reverberating effects on the economy and the
on South Africa for all its imports and exports. The Kingdom ripple effects are felt keenly on small businesses and wage
has almost 80 per cent of guaranteed electricity supply employment in the formal and informal sectors, especially
from South Africa, shares a common currency regime in the service sector. An example of goods which were ready
the Rand Monetary Area and common customs under the for export but could not move was a consignment of
Southern Africa Customs Union (SACU). The two countries handicrafts destined for the EU via ORT International Airport
are so integrated in their economic, social and political in Johannesburg8. While the value of this consignment was
policies that changes in South Africa are often adopted only E250,000, its impact on the livelihoods of hundreds of
and integrated into the local system with minor adaption low-income rural households was great.
for domestic effect. In some cases, this is not even possible.
Examples include the currency exchange rate, customs and Another area of life that has suffered a hit as a result of the
excise, and value added tax. When South Africa changed its pandemic is the leisure and entertainment industry, which
VAT rate from 14 to 15 per cent in the 2017 budget, Eswatini is defined by its economic and cultural activities. Among
had to revise its own budget accordingly even though it activities banned as part of measures to control the spread
had already been approved. Moreover, the Minister of of coronavirus are the much loved game of soccer and
Trade’s list of essential products had to be made consistent sports generally , as well as entertainment for both young
with products allowed by South Africa; hence Eswatini and old. Among the hardest hit in the list of popular social
trade stopped abruptly until the consistency was achieved. events is the international Bushfire Festival normally held
in May but which has now been postponed indefinitely
The road network linking Eswatini and South Africa
is the lifeblood of the economy and the cultural links Every sector will have a record of huge losses at the end
between the two countries. Lockdown regulations in when government takes stock of what the country has
South Africa, Eswatini and Mozambique require that lost to the pandemic. Education, health, the economy,
anyone crossing the border be quarantined on the other agriculture, the manufacturing industry and all other vital
side. Cross-border passenger transport is banned. Closure sectors will have their own stories to tell just as they will
of common borders except for Ngwenya, Matsamo, all be looking forward to redefining their operations in
Mananga, Mahamba and Lavumisa allows only essential line with the emerging realities of what is now called “the
exports of food, medicines, and pharmaceuticals to enter new normal”. One of the sectors that will suffer the greatest
Eswatini. There are long delays at the border despite the blow is the thriving tourism sector, which depends heavily
few trucks allowed on the road, and this has aggravated on visiting South Africans and transiting visitors who
the health conditions of people in the country as essential constitute about two-thirds of tourists that flock into the
goods cannot come in easily. This lack actually pervades country. The lockdown has brought this flow of tourists to a
all areas of life. For instance, as people are encouraged to complete halt. Another major impact of the coronavirus on
work from home, communication companies such as MTN, the Eswatini’s struggling economy is the spillover effects of
SPTC and Eswatini Mobile were granted essential services the virus’s impact on South Africa, which is the dominant
status, thereby enjoying the privilege of carrying out their economy and major driver of growth in the region.
businesses. But as the lockdown continued they ran out
A Rapid Socioeconomic Assessment of COVID-19 in Eswatini 11COVID-19 Impact on Economic Growth under two scenarios
COVID-19 Impact on Economic
Growth under Two Scenarios
The impact of the pandemic on the global falling to 1.3 per cent in 2019. The 2019 figure is below
economy is projected to be much worse than the 5 per cent needed to tame poverty in the country,10 as
during the 2008/09 financial crisis, as it is agriculture growth levels off. The fiscal measures adopted
expected to diminish sharply by 3 per cent in in the country, the disruption in world trade, as well as the
2020. In a baseline scenario, which assumes that changes and behaviour of the economic agents are sure to
the pandemic will fade away in the second half of affect economic growth significantly.
2020 for containment efforts to begin to unwind
gradually, the global economy is projected to To assess the possible impact of COVID-19 on GDP,
grow by 5.8 per cent in 2021 by which time it is researchers conducted an analysis under two scenarios.
estimated that economic activities would have Scenario 1, which is considered moderate or optimistic,
normalized, helped by policy support. The risks assumes that current restrictions would be lifted from
for even more severe outcomes, however, are September 2020. “Normalization” refers to the lifting of
substantial. all restrictions under the partial lockdown to open the
economy for business.11 In this scenario, the economic
The COVID-19 pandemic met Eswatini in an already fragile impact is still significant, with growth declining from the
economic and social situation. The country’s economic 1.3 per cent in 2019 to -1.9 per cent in 2020 (see Table 1).
growth in recent years has been subdued, expanding at Scenario 2 assumes that normalization would occur in
an average growth rate of 1.7 per cent during 2014-19 as 12 months (i.e., as from January 2021). And this scenario
a result of mounting fiscal challenges, a difficult external is considered severe or pessimistic (see assumptions
environment and the impact of the 2015/16 drought. presented in Annex 1). In this scenario, the impact on
However, GDP rose to 2.4 per cent in 2018, driven by growth would be very large, with real GDP falling to -6.2
recoveries in agriculture and the services sectors before per cent.
Table 1: Scenario Analysis of Pre- & Post- COVID-19
Year GDP Growth GDP Growth Under GDP Growth Under GDP Levels in Constant GDP Levels in Constant
2011 Values 2011 Values
Pre-COVID-19 Scenario 1 Scenario 2
Under Scenario 1 Under Scenario 2
(E Million) (E Million)
(%) (%)
(%)
2016 1.3 40,060 40,060
2017 2.0 40,871 40,871
2018 2.4 41,832 41,832
2019 1.3 42,367 42,367
2020 -1.9 -6.2 41,567 39,758
2021 2.6 2.1 42,653 40,596
2022 0.8 1.5 42,992 41,222
A Rapid Socioeconomic Assessment of COVID-19 in Eswatini 13COVID-19 Impact on Economic Growth under Two Scenarios
FIGURE 3 GDP Growth Pre- & Post- Covid-19
Scenario Analysis of Pre & Post Covid-19
2.8
2.4 2.6 1.5
2 2.1 2.1
1.3 1.38
1.3
0.83 0.8
2016 2017 2018 2019 2020 2021 2022
-1.9
-6.2
GDP Growth Pre-Covid-19 GDP Growth Under scenario 1
Sources: MEPD & CBE; “Economic Impact Analysis of Coronavirus (COVID-19) Outbreak in Eswatini; April 2020 &
“GDP Projections 2019-2022 Public – Pessimistic/Optimistic Scenarios; April 2020”.
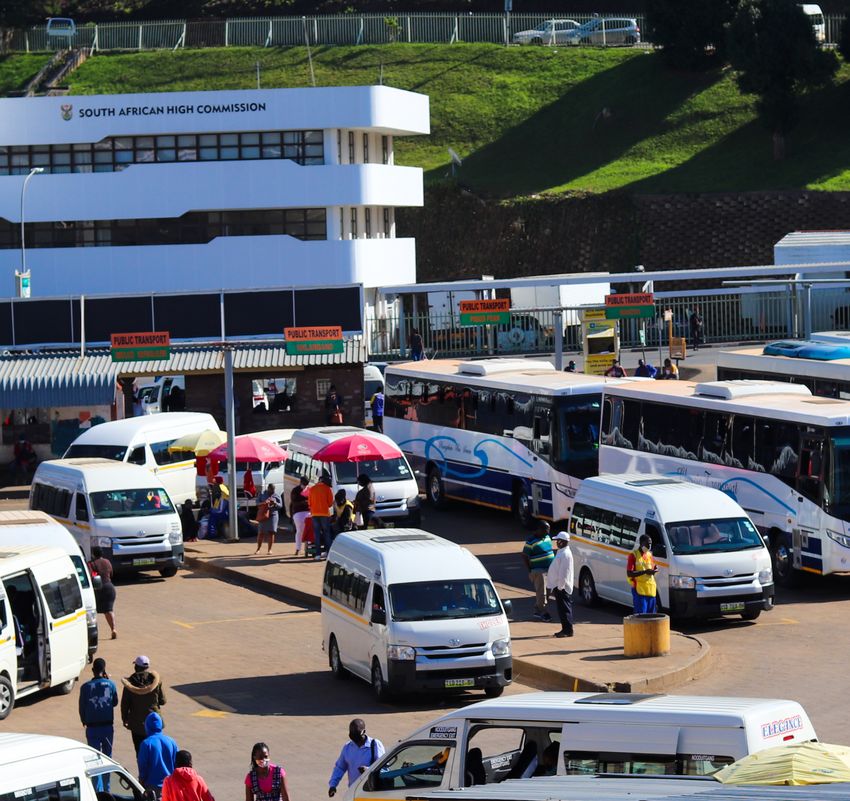
Observations from Table 1 and Figure 1 can be highlighted be E1.2 billion lower than the 2019 level by 2022, meaning
as follows: that the economy will not recover from COVID-19.
The impact of COVID-19 can be measured in terms of its Population growth from 2020-22 is estimated at 0.9 per
impact on the growth of the economy. In the first year of cent per annum. Given the growth rates of GDP presented
the impact (i.e., 2020), the economy will shrink by 1.9 per in the Table 1, per capita income will decline by an annual
cent under the optimistic scenario (i.e., lifting of lockdown average rate of 0.4 per cent under scenario 1 and 0.6 per
regulations as from September 2020) and by 6.2 per cent cent under scenario 2. This means that average living
under Scenario 2 (i.e., lifting of lockdown regulations as standards in the country will decline as a result of COVID-19.
from January 2021).
Strategic Sectors of the Economy:
The shrinkage will take GDP from E42.4 billion down to Eswatini Strategic Roadmap (ESR),
E41.6 billion under Scenario 1 and down to E39.8 billion National Development Plan (NDP
under Scenario 2. In the second year, GDP will recover via
The Eswatini Strategic Roadmap (ESR) has identified five
a 2.6 per cent growth, which takes GDP up to E42.7 billion
sectors as crucial for economic growth based on their
under Scenario 1 and E40.6 million under Scenario 2. By
ability to deliver high impact on output, job creation
the third year, the GDP growth will decelerate from 2.6 to
and public revenue mobilization. These are agriculture,
0.8 per cent under Scenario 1 and from 2.1 to 1.5 per cent
manufacturing and agri-processing, mining and energy,
under Scenario 2. The corresponding GDP levels are E43.0
education and ICT, as well as tourism. This section analyses
billion and E41.2 billion, respectively.
the performance of these sectors under the two COVID-19
scenarios already outlined above.
Under Scenario 1, GDP will be E0.6 billion by 2022, higher
than the 2019 level. This means the economy would have
Table 2 and Figure 4 present a matrix in the scenario analysis
recovered fully from COVID-19. Under Scenario 2, GDP will
of the performance of the overall economy. Because of
14 A Rapid Socioeconomic Assessment of COVID-19 in EswatiniCOVID-19 Impact on Economic Growth under two scenarios
FIGURE 4 Impact of COVID-19 on Sector Growth
Growth by Sector in Percentile
Tertiary
Arts and Recreation
Professional Services
Real Estate activities Market
Real Estate activities
Financial Services
Accomodation and food
Transportation and Storage
Wholesale and retail trade; repair of motor vehicles
Secondary Sector
Construction
Manufacturing
Forestry and Logging
Support Activities to Agriculture
Growing of Crops: Swazl National Land
-80 -70 -60 -50 -40 -30 -20 -10 0
Growth Scenario 2, 2020 Growth Scenario 1, 2020
Table 2: Impact of COVID-19 on Sector Growth under Two Scenarios
Table 3: Sec-
toral Output
GDP by Eco- Output Pre- Percentage Percent- Output Output Percent- Output Output
nomic Activity COVID-19 Rate of Growth age Rate under Loss age Rate under Loss
at Constant Baseline of Growth Scenario 1 under of Growth Scenar- under
2011 Prices (E Pre COVID-19 under Scenario 1 under io 2 Scenar-
million) Estimate Scenario 1 Scenario 2 io 2
Description Yr. 2019 Yr. 2020 Yr. 2020 Yr. 2020 Yr. 2020 Yr. 2020 Yr. 2020 Yr. 2020
Growing of 195 -9.7 -9.7 176 19 -15.3 166 30
crops: Swazi
National Land
Support 165 -0.2 -0.8 163 1 -4.0 158 7
activities to
agriculture
Forestry and 493 0.0 -8.4 452 41 -10.9 440 54
Logging
Manufactur- 13,900 3.7 -5.8 13,094 806 -9 12,649 1,251
ing
Construction 1,305 2.2 -12.8 1,138 167 -22.2 1,015 290
Wholesale 5,411 0.2 -2.4 5,282 130 -8 4,978 433
and retail
trade; repair
of motor
vehicles and
motorcycles
A Rapid Socioeconomic Assessment of COVID-19 in Eswatini 15COVID-19 Impact on Economic Growth under Two Scenarios
Transpor- 989 2.9 -3.6 954 36 -27.6 716 273
tation and
storage
Accommo- 271 2.8 -36.2 173 98 -42.9 155 116
dation and
food service
activities
Activities aux- 185 6.1 -4.9 176 9 -7.1 172 13
iliary to finan-
cial services
Real estate 1,220 -2.6 -2.6 1,188 32 -12.4 1,068 151
activities,
market
Professional, 1,552 4.0 -2.4 1,515 37 -5.8 1,462 90
administrative
and support
services
Arts, enter- 146 0.0 -61.5 56 90 -75 36 109
tainment and
recreation
Total 28,104 26,618 1,487 25,149 2,955
Sources: MEPD & CBE; “Economic Impact Analysis of Coronavirus (COVID-19) Outbreak in Eswatini; April 2020 & “GDP Projec-
tions 2019-2022 Public – Pessimistic/Optimistic Scenarios; April 2020”.
The ESR commits to defined objectives with timelines in the following manner
Short Term (< 1 year) Medium Term Long Term (> 3 From Short to Medium From Medium to Long Term
(1-3 years) years) Term
Fiscal consolidation Revenue mobili- Reposition the Ensure inclusive Restore macroeconomic stability
Arrears clearance zation Kingdom of growth Ensure sustainability of pub-
Quick wins on Ease Structural re- Eswatini for Effective social safety lic expenditure, public debt,
of Doing Business forms innovation net to protect vulnera- productive capital spending to
(EODB) Improve EODB & inclusive ble citizens enhance growth and mitigate
ranking growth Ensure no Liswati is cash flow crisis and arrears
ICT & infrastruc- left behind accumulation12
ture
Improve social
indicators
inter-sectoral linkages, a stimulus provided to any of the interest are listed under two columns, namely, “Output Loss
five key growth sectors is expected to have both direct under each Scenario”. The totals of these columns give the
and indirect effects on the other sectors. For example, magnitude of output losses under each scenario, output
agriculture is linked to virtually all the other sectors from loss E1.5 billion under the moderate/optimistic scenario
both the input and output sides. Accordingly, we can and E3 billion under the severe/pessimistic scenario. These
determine the likely impact of COVID-19 by looking at the have serious implications for Eswatini Strategic Roadmap
growth of all the individual sectors. This is the conceptual (ESR), National Development Plan (NDP) and Sustainable
thinking which underlies the calculations done in Annex 3. Development Goals (SDGs)
All the sectors showing negative growth in the Year 2020 The NDP has identified six national outcomes to be achieved
(i.e., the first year of COVID-19) under each of Scenarios 1 to develop Eswatini holistically. These outcomes were
& 2 have been listed in Table 3. This is done with a view formulated after analysing the features of the country’s
to determining the impact of COVID-19. The results of development trajectory, including fiscal crisis, low human
16 A Rapid Socioeconomic Assessment of COVID-19 in EswatiniCOVID-19 Impact on Economic Growth under two scenarios
and social development, high unemployment and poverty balance, COVID-19 is delaying progress towards the goals
rates, disastrous impacts of climate change as well as weak and targets of SDGs.
governance mechanism and public service delivery. The
NDP also shows that despite the achievements recorded The single most important instrument available to
in all the sectors, there are serious challenges in meeting Eswatini to come close to achieving the ESR goals, NDP
the development aspirations for the country. The national national outcomes and SDGs is a fiscal policy with fiscal
outcomes include: good governance, economic recovery consolidation as a critical component. The 2020-21 national
and fiscal stability; enhanced and dynamic private sector budget is an attempt to move towards fiscal consolidation.
supporting sustainable and inclusive growth; enhanced In it, public revenue rises to 18 per cent to E21 billion from
social and human capital development, efficient public E18 billion in the 2019/20 budget. Public expenditure also
service delivery that respects human rights, justice and rule experienced a 10 per cent jump from E22 billion in the
of law; well managed natural resources and environmental 2019/20 budget to E24 billion in the 2020/21 budget with
sustainability; and efficient economic infrastructure the margin of increase falling below that of public revenue.
network.13 The deficit fell by 27 per cent from E4 billion in 2019/20 to
E3 billion in 2020/2. These trends were consistent with the
COVID-19 has changed the baseline underlying the NDP objectives of fiscal consolidation. However, the onset of
targets; hence the need to review the baseline and targets. COVID-19 has disrupted the picture through the lockdown
Also, by delaying and throwing the country’s movement of the economy.
towards the ESR goals and NDP national outcomes off-
A Rapid Socioeconomic Assessment of COVID-19 in Eswatini 17Fiscal Policy
Fiscal Policy
On 6 May 2020, the government extended than the average receipt before the pandemic
the ongoing partial lockdown of the country emerged. Meanwhile, Eswatini usually receives
but permitted firms in seven sectors to go to a share of the joint SACU receipts totalling
work from 8 May onwards. These firms are about E8.3bn14) (US$450m) a year. The original
manufacturing and production companies with government projection of E8.34bn earnings
international orders; agents and consultants; for 2020 in the February budget was rubbished
furniture and decor shops; dry cleaners; retail in April when the eSwatini Revenue Authority
clothing shops, tailors and dressmakers; and collected 19 per cent below target and with a
vehicle-testing stations. With the 6.2 per cent notable decline in value-added tax (VAT) inflows.
contraction in the economic forecast for this year, The 2020 budget, therefore, requires substantial
the 2020 national budget passed in February this adaptation, as SACU receipts made up the largest
year has come under severe pressure. Customs source of revenue. The emerging picture can be
revenue, which the government was relying seen in Figure 5.
on for funding, has virtually dried up across the
Southern African Customs Union (SACU). The The figure shows that the national budget has been in
SACU usually collects about R120bn (US$6.5bn) deficit throughout the period in question. The deficit
annually, with monthly revenue averaging about increased over the first three years but started falling in
R10bn. However, in April (the first full month of the next three. For 2020/21, the deficit was lower than
lockdown), SACU receipts were about R7bn lower in the previous year, in line with the objective of fiscal
FIGURE 5 Fiscal Balance 2016-2020
- 0.0
(500,000.00) -1.0
(1,000,000.00) -2.0
(1,500,000.00)
(2,000,000.00) -3.0
(2,500,000.00) -4.0
(3,000,000.00)
E '000
-5.0
(3,500,000.00) -6.0
(4,000,000.00)
(4,500,000.00) -7.0
(5,000,000.00) -8.0
2015/ 2016/ 2017/ 2018/ 2019/ 2020/
16 17 18 19 20* 21**
Overall surplus/(deficit) (2,151,4 (3,877,5 (4,450,3 (3,257,7 (3,933,9 (2,875,2
Surplus/(deficit) as a % -3.8 -6.5 -7.1 -4.9 -5.4 -3.6
GDP
Source: Central Bank of Eswatini
A Rapid Socioeconomic Assessment of COVID-19 in Eswatini 19Fiscal Policy
FIGURE 6 Public Debt Position
25.0 35.0
30.0
20.0
25.0
E' Billions
15.0
Per cent
20.0
10.0 15.0
10.0
5.0
5.0
0.0 0.0
Mar Jun Sep Dec Mar Jun Sep Dec Mar Jun Sep Dec Mar Jun Sep Dec Mar
16 16 16 16 17 17 17 17 18 18 18 18 19 19 19 19 20
Public Domestic Debt 3.2 4.0 5.1 5.5 6.1 6.1 6.7 7.3 7.7 7.7 8.2 9.3 11.8 12.6 12.9 13.6 13.7
Public External Debt 5.1 5.2 4.8 4.9 5.2 5.4 5.6 5.5 5.3 6.0 6.6 6.7 7.1 7.6 8.4 7.8 9.3
Total Public Debt 8.3 9.2 10.0 10.5 11.3 11.5 12.2 12.7 13.0 13.7 14.8 16.0 18.9 20.3 21.2 21.4 23.1
Domestic Debt (% GDP) 5.7 7.1 9.1 9.8 10.2 10.3 11.3 12.2 12.3 12.3 13.1 14.8 17.6 18.9 19.2 20.2 18.8
External Debt (% GDP) 9.0 9.2 8.5 8.7 8.8 9.1 9.4 9.2 8.6 9.7 10.6 10.7 10.5 11.3 12.5 11.7 12.8
Total Debt (% GDP) 14.8 16.3 17.6 18.5 19.0 19.3 20.6 21.4 20.9 22.0 23.7 25.6 28.2 30.2 31.7 31.9 31.6
Source: Central Bank of Eswatini
FIGURE 7 Lilangeni Exchange Rate vis-a-vis US Dollar
E/USD
20.00 18.58
18.00 16.66
16.00 14.81 14.44 15.01
13.63
14.00
12.00
10.00
8.00
6.00
4.00
2.00
0.00
Nov-19 Dec-19 Jan-20 Feb-20 Mar-20 Apr-20
Source: Central Bank of Eswatini
consolidation. As a proportion of GDP, the deficit of -3.6 per
cent was below the SADC macroeconomic convergence The deficit has been financed by public borrowing,
threshold of 5 per cent. However, COVID-19 is likely to including domestic arrears accumulation. Figure 5 shows
reverse the situation from a decrease in deficit to an the level of public borrowing since March 2016.
increase most likely to about -9 to -11 per cent of GDP as
alluded to above. Total public debt as a proportion of GDP increased from 15
20 A Rapid Socioeconomic Assessment of COVID-19 in EswatiniFiscal Policy
FIGURE 8 Discount & Inflation Rates
10
9
8
7
Per cent
6
5
4
3
2
1
0
20 7M 1
16 01
18 11
20 7M 1
20 8M 1
20 9M 1
19 01
20 0M 1
20 01
20 6M 9
20 7M 9
20 8M 9
20 9M 9
20 6M 3
20 7M 3
18 03
20 9M 3
03
16 05
17 05
20 8M 5
19 05
20 6M 7
20 7M 7
20 8M 7
20 9M 7
1 1
1 0
1 0
1 1
2 1
1 0
1 0
1 0
1 0
1 0
1 0
1 0
1 0
1 0
1 0
1 0
1 0
20 6M
20 M
20 M
20 M
M
20 M
20 M
20 M
20 M
1
20
Source: Central Bank of Eswatini
per cent in March 2016 to 29 per cent in December 2019. recent increases in public debt and the high gross financing
During the same period, domestic debt tripled, rising needs raise both sustainability and liquidity concerns. The
from 5.8 per cent of GDP to 18 per cent, while external debt burden has become an additional cause for concern
debt almost doubled itself by growing from 6.9 per cent now given that COVID-19 has introduced greater needs for
of GDP to 11.2 per cent. Since 2015, the government has more public spending than was envisaged in the 2020/21
relied increasingly on domestic debt to plug expanding national budget. Meanwhile, the debt profile will limit state
financing needs, thereby minimizing exchange rate risk. support for the private sector, so its ability to produce is
While this ratio is within the threshold of 35 per cent sure to be constrained until the economy improves.
fixed by government policy. The government’s 2019
debt sustainability analysis (DSA), supported by the Fiscal Implications of COVID-19
Macroeconomic and Financial Management Institute of
The fiscal implications of COVID-19 are more than can be
Eastern and Southern Africa (MEFMI), concluded that
easily related. They include the following:
although the country’s debt level was still relatively low,
A Rapid Socioeconomic Assessment of COVID-19 in Eswatini 21Fiscal Policy
•• Revenue will decline by E2.7 billion, falling to E18.7 budget produced under the leadership of the
billion from the pre-COVID-19 level of E21.2 billion. Ministry of Health as against the amount provided for
•• Assuming the pre-COVID-19 expenditure remains at equipment, medicines and personnel services by the
the level of E24.1 billion, the budget deficit will widen National Resource Mobilization Fund for COVID-19.
to E5.5 billion (as compared to the pre-COVID-19 level
of E2.9 billion). As a proportion of GDP, the deficit In the short term, there will be pressure to devote more
will increase from 3.6 to 9.1 per cent (and thereby public resources into the health sector to fight COVID-19.
significantly breach the SADC Macroeconomic The government can achieve this through reallocations
Convergence threshold of 5 per cent.) within the budget or by increasing the total expenditure
•• As a proportion of GDP, public debt is projected to level or both. The supplementary budget contained an
increase by 30 to 38 per cent (excluding arrears of additional E100m (US$61.4m) for new public healthcare
E5.3 billion). spending. The National Disaster Management Agency
•• Public debt servicing is projected to increase by 5 per (NDMA) has estimated the emergency resource-needs at
cent due to the exchange rate depreciation. Given about E803 million (US$44 million). Over and above public
this scenario, some of the required measures to arrest health sector issues, there will be socioeconomic issues in
the deteriorating fiscal situation are of a short-to- the form of negative effects transmitted through various
medium term nature (including the achievement of channels, which all require resources to mitigate.
fiscal consolidation), while others are of a longer term
(including the resolution of structural problems). It is After paralysing the economy, the pandemic is currently
recommended to use short-term measures to fight tying down resources in multiple battles to save lives,
COVID-19 and mitigate its impact by supporting prevent new infections, sustain communities and prepare
efforts targeted directly or indirectly at closing the for sustainable early recovery and resilience. In the
gap of E2.7 billion caused by the reduction of public medium to long term, there will be pressure to stimulate
revenue in the wake of COVID-19. the economy through total budget increases. Faced with
•• The gap is defined by the difference in the COVID-19 a weak tax base (many thanks to COVID-19), the increase
22 A Rapid Socioeconomic Assessment of COVID-19 in EswatiniFiscal Policy
in total expenditure will lead to an increase in the fiscal
deficit. Overall, the fiscal deficit/GDP ratio will widen from COVID-19 has disrupted the normal relations between
an estimated 4.4 per cent in 2019/20 to about 9-11.4 per the inflation rate and discount rate. The imperative was to
cent in 2020/21. reduce the discount rate to boost the economy.
Further fiscal implications of COVID-19 can be observed Finally, it can be said that COVID-19 affects both fiscal and
in the exchange rate. The rand – and, by implication, the monetary policy. As already established, the country’s
lilangeni, given their 1:1 peg – averaged an estimated monetary policy is heavily influenced by the policy rate of
R14.44: US$1 in 2019. By 2020, the rand had depreciated the South African Reserve Bank (SARB, the central bank),
by 25 per cent owing to the impact of the coronavirus which is a de facto base rate for the Central Bank of Eswatini
pandemic on the global economy and emerging market (CBE). To avoid capital outflows, the CBE rarely undercuts
currencies. As of mid-March, the country’s foreign reserves the SARB’s benchmark rate. On 19 March, however, the
were only enough to cover just 2.4 months of import, down SARB did the unusual by cutting its main policy rate by 100
from 3.2 months previously. By global standards, a country basis points. Taking the cue at its meeting of March 2020,
requires 3 months to sustain the foreign-exchange regime. the Central Bank of Eswatini reduced its discount rate from
6.5 to 5.5 per cent (i.e., by 100 basis points). In addition, the
Inflation, a perennial issue in the management of a national CBE reduced the liquidity requirements for commercial
economy, has received a boost from COVID-19. Inflation banks from 25 to 20 per cent and for development banks
in Eswatini broadly tracks price trends in South Africa – from 22 to 18 per cent. In April 2020, the CBE introduced
the source of most of its imports. Estimates project a rise a further stimulus package for banks. It reduced the
in inflation from an estimated 2.6 per cent in 2019 to 3.9 discount rate by another 100 basis points from 5.5 to 4.5
per cent in 2020. The depreciation of the rand (to which per cent; thus granting a cumulative 200 basis points
the lilangeni is pegged) against the US dollar and rising reduction. The government introduced these measures to
inflation in South Africa will overwrite a COVID-19-induced help households and businesses to weather the adverse
contraction in domestic aggregate demand in 2020 and the economic impact of coronavirus. Nevertheless, all these
sharp decline in global fuel prices. There is a possibility that measures can only help to cushion the negative effects, not
it might rise further than 3.9 per cent if the administratively prevent them. And they can only attempt to mitigate the
determined prices for electricity and water come into effect effects COVID-19.
in July 2020 (having been postponed from April 2019) and
if the prices of other essential commodities in short supply
due to the economy lockdown keep rising.
A Rapid Socioeconomic Assessment of COVID-19 in Eswatini 23Social Dimension of COVID-19
The Social Dimensions of
COVID-19
Poverty, Unemployment and Inequality the signs are already showing. Global human
development, which can be measured as a
Achim Steiner, the UNDP Administrator, has been combination of the world’s education, health
quoted as saying: “The world has seen many and living standards, could decline this year for
crises over the past 30 years, including the Global the first time since the concept was introduced
Financial Crisis of 2007-09. Each has hit human in 1990, led by a massive setback in effective
development hard but, overall, development education because of school closures affecting
gains [have] accrued globally year-on-year,” almost 9 in 10 students and deep recessions in
adding, “COVID-19 – with its triple hit to health, most economies (including a 4 per cent drop in
education, and income – may change this trend”. GNI per capita worldwide). The decline in the
Steiner’s observation is a pointer to the realities index – reflecting the narrowing of capabilities –
the world is currently grappling with and an would be equivalent to erasing all the progress
indication that the human race may be entering achieved in human development in the past six
into a new realm of experience that would pose years.15
new and potent challenges to the world – and
FIGURE 9 Human Development Simulation on Inequality
Change in Human Development Index value, annual
The Global
Financial Crises
0.010
0.005
0
19 1
20 1
20 1
20 9
20 9
20 9
82
20 2
12
19 0
00
20 0
20
19 3
03
20 3
19 8
20 8
20 8
19 4
20 4
14
85
20 5
20 5
19 6
06
20 6
87
20 7
17
8
0
1
8
0
1
0
8
1
8
1
8
0
1
8
0
0
1
8
1
0
20
19
19
20
19
20
20
20
19
20
-0.005
-0.010
-0.015
2020 simulated change in
-0.020 Covid-19-adjusted HDI
a) The 2019 value is a provisional estimate.
Source: Human Development Report Office 2019 simulations based on data from the
International Telecommunications Union, UNESCO &WHO.
A Rapid Socioeconomic Assessment of COVID-19 in Eswatini 25Social Dimension of COVID-19
The Eswatini Human Development Index (HDI) for Economic growth is a necessary, though insufficient,
2018 is 0.608, but after discounting for inequality in the condition for poverty reduction. The impact that economic
distribution of the HDI dimension indices, the HDI falls to growth can have on poverty depends on the sources and
0.430, a loss of 29.3 per cent. Multidimensional Poverty sectors of that growth. Some sectors have more impactful
Index identifies multiple overlapping deprivations suffered multiplier effects compared to others. Hence, they can
by individuals in three dimensions – health, education thus deliver much better outcomes than others. In some
and standard of living. In Eswatini, 19.2 per cent of the literature, such as studies in India, it has been approximated
population (263 thousand people) are multidimensionally that a one percentage point increase in real GDP per capita
poor while an additional 20.9 per cent are classified as results in a 0.78 of a percentage point decrease in poverty
vulnerable to multidimensional poverty (285 thousand levels. Using the 1:0.78 ratio19 between per capita GDP
people). The breadth or intensity of deprivation, which is growth and poverty trends from the effects of COVID-19,
the average deprivation score experienced by people in the outcomes have been summarized in Table 3 using the
multidimensional poverty, is 42.3 per cent.16 two growth scenarios alluded to earlier in the report.
Thus, poverty remains high in Eswatini despite its decline Table 3 shows that up to approximately 65,800 people
from 63 per cent in 2010 to 59 per cent in 2017.17 It is would potentially be added to the existing number of
estimated that about 20.1 per cent lives in extreme people living below the poverty line21 as a result of poor
poverty, and these are largely rural dwellers. Further growth outcomes due to the negative impact of COVID-19
estimates show that 75 per cent of the rural population in just 2020 alone. Importantly, approximately 15,550
is predominantly poor, compared to 20 per cent in urban people would have been lifted out of poverty if the pre-
areas. This heavy burden of poverty affects children, 56.5 COVID-19 per capita growth was to be realized.
per cent of whom is multidimensionally poor. At 65 per
cent, the multidimensional child poverty (MCP) in the rural The national unemployment rate stood at 23 per cent in
areas is more than double that of urban areas (23 per cent). 2016. The formal sector employed 3.1 per cent and the
And the MCP is slightly higher for boys (60 per cent) than informal 60.3 per cent with the working-age population
for girls (54 per cent). 18 consisting of 738,799 people of which 364,630 persons are
out of the labour force. Almost 82 per cent of employment
Table3: Effects Of COVID-19 on Poverty Trends
2020 Projected Growth Effect on Poverty20
GDP Projection Jan 2020 Real GDP Growth 2.8
(Pre-COVID-19) Poverty levels would have reduced from 59 % of
Real GDP/Capita 1.7 the population to 57.8 %.
Growth About 15,547 people lifted out of poverty (above
Poverty Trend -1.33 the poverty line)
GDP With COVID-19 (Opti- Real GDP Growth -1.9
mistic Scenario) Poverty levels worsen from 59 % of the population
Real GDP/Capita -3.0 to 61.3 %
Growth About 27,435 people pushed below the poverty line
Poverty Trend +2.34
GDP With COVID-19 (Pes- GDP/Capita -6.2
simistic Scenario) Poverty levels worsen from 59 % of the total popu-
Real GDP Per Capita -7.2 lation to 64.6 per cent
Poverty Trend +5.62 About 65,844 people pushed below the poverty line
26 A Rapid Socioeconomic Assessment of COVID-19 in EswatiniYou can also read