"EVACUATE THE DANCEFLOOR": EXPLORING AND CLASSIFYING SPOTIFY MUSIC LISTENING BEFORE AND DURING THE COVID-19 PANDEMIC IN DACH COUNTRIES - MPG.PURE
←
→
Page content transcription
If your browser does not render page correctly, please read the page content below
Jahrbuch Musikpsychologie
                 jbdgm.psychopen.eu | 2569-5665

Research Reports on Thematic Focus

“Evacuate the Dancefloor”: Exploring and Classifying Spotify Music
Listening Before and During the COVID-19 Pandemic in DACH Countries
„Evacuate the Dancefloor“: Exploration und Klassifizierung von Spotify-Hörverhalten vor und während der
COVID-19-Pandemie in den DACH-Ländern

Kework K. Kalustian* 1, Nicolas Ruth 2

[1] Department of Music, Max Planck Institute for Empirical Aesthetics, Frankfurt/Main, Germany. [2] Department of Psychology,
Goldsmiths, University of London, London, United Kingdom.

Abstract
Many people used musical media via music streaming service providers to cope with the limitations of the COVID-19 pandemic. Accounting
for such behavior from the perspective of uses-and-gratifications theory and situated cognition yields reliable explanations regarding
people’s active and goal-oriented use of musical media. We accessed Spotify’s daily top 200 charts and their audio features from the
DACH countries for the period during the first lockdown in 2020 and a comparable non-pandemic period situation in 2019 to support those
theoretical explanations quantitatively with open data. After exploratory data analyses, applying a k-means clustering algorithm across the
DACH countries allowed us to reduce the dimensionality of selected audio features. Following these clustering results, we discuss how
these clusters are explainable using the arousal-valence-circumplex model and possibly be understood as (gratification) potentials that
listeners can interact with to modulate their moods and thus emotionally cope with the stress of the pandemic. Then, we modeled a cross-
validated binary SVM classifier to classify the two periods based on the extracted clusters and the remaining manifest variables (e.g., chart
position) as input variables. The final test scenario of the classification task yielded high overall accuracy in classifying the periods as
distinguishable classes. We conclude that these demonstrated approaches are generally suitable to classify the two periods based on the
extracted mood clusters and the other input variables, and furthermore to interpret, by considering the model-related caveats, everyday
music listening via those proxy variables as an emotion-focused coping strategy during the COVID-19 pandemic in DACH countries.

Keywords: API, COVID-19, interpretable machine learning, k-means clustering, popular music, SVM classifier, streaming behavior

Zusammenfassung
Während der COVID-19-Pandemie bewältigten viele Menschen diese einschränkende Situation, indem sie Musikmedien über
verschiedene Musikstreaming-Dienstleister nutzten. Eine Betrachtung dieses Verhaltens aus der Perspektive des Uses-and-Gratification-
Ansatzes und der Situated Cognition liefert verlässliche Erklärungen für die aktive und zielgerichtete Nutzung von Musikmedien. Um solche
Erklärungen quantitativ mit frei verfügbaren Daten zu untermauern, haben wir die täglichen Top-200-Charts von Spotify in den DACH-
Ländern und die dazugehörigen Audio-Features gemäß den von Spotify bereitgestellten Audio-Feature-Informationen für die Zeiträume
während des ersten Lockdowns im Jahr 2020 und dem gleichen Zeitraum ohne Pandemie in 2019 abgerufen. Nachdem wir explorative
Datenanalysen durchgeführt haben, reduzierten wir die Dimensionalität ausgewählter Audio-Features durch Anwendung eines k-Means-
Clustering-Algorithmus über die DACH-Länder hinweg. Basierend auf den Clustering-Ergebnissen diskutieren wir, wie diese Cluster nicht
nur konzeptuell mit dem Arousal-Valence-Circumplex-Modell erklärbar sind, sondern auch womöglich als (Gratifikations-)Potenziale
verstanden werden können, mit denen die Hörer*innen interagieren können, um ihre Stimmungen zu modulieren und somit emotional mit
dem Stress der Pandemie umzugehen. Darüber hinaus modellierten wir einen kreuzvalidierten binären SVM-Klassifikator, um die
Zeiträume basierend auf den extrahierten Clustern und den verbleibenden manifesten Variablen (z.B. Chartpositionen) als Input-Variablen
zu klassifizieren. Das endgültige Testszenario der Klassifizierungsaufgabe ergab eine hohe Gesamtgenauigkeit bei der Klassifizierung der
Zeiträume als unterscheidbare Klassen. Abschließend kommen wir somit zu dem Schluss, dass diese aufgezeigten Ansätze grundsätzlich
geeignet sind, die beiden Zeiträume auf Basis der extrahierten Mood-Cluster und der anderen Input-Variablen zu bestimmen und
außerdem das alltägliche Musikhören über diese stellvertretenden Variablen als emotionsfokussierte Bewältigungsstrategie während der
COVID-19-Pandemie in den DACH-Ländern unter modellbedingten Einschränkungen zu interpretieren.

Schlüsselwörter: API, COVID-19, interpretierbares maschinelles Lernen, k-Means Clustering, populäre Musik, SVM-Klassifikator,
Streaming-Hörverhalten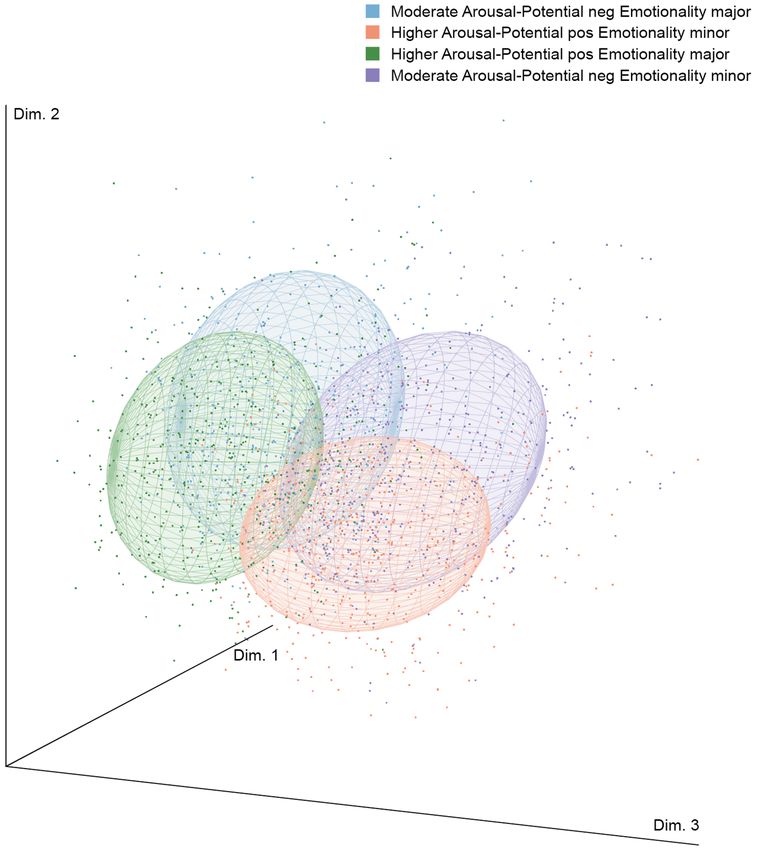
Spotify Streaming and the COVID-19 Pandemic                                                                                                                   2

    Jahrbuch Musikpsychologie, 2021, Vol. 30: Musikpsychologie – Empirische Forschungen - Ästhetische Experimente, Artikel e95,
    https://doi.org/10.5964/jbdgm.95
    Eingereicht: 2021-02-18. Akzeptiert: 2021-06-28. Publiziert (VoR): 2021-09-24.
    Begutachtet von: Jochen Steffens; Holger Schwetter.
    *Korrespondenzanschrift: Department of Music, Max Planck Institute for Empirical Aesthetics, Grüneburgweg 14, 60322, Frankfurt am Main, Germany.
    E-Mail: kework.kalustian@ae.mpg.de
                        Dieser Open-Access-Artikel steht unter den Bedingungen einer Creative Commons Namensnennung 4.0 International Lizenz, CC
                        BY 4.0 (https://creativecommons.org/licenses/by/4.0/deed.de). Diese erlaubt für beliebige Zwecke (auch kommerzielle) den Artikel zu
                        verbreiten, in jedwedem Medium zu vervielfältigen, Abwandlungen und Bearbeitungen anzufertigen, unter der Voraussetzung, dass
    der Originalartikel angemessen zitiert wird.

The global COVID-19 pandemic and its related lockdowns, curfews, and increased preventative measures
dramatically changed everyday life. Many European countries implemented the same or similar measures to
stop the virus’ spread. For instance, the three major German-speaking countries (i.e., Austria, Germany, and
Switzerland) enacted lockdowns, curfews, and travel restrictions between March and June 2020. These and
other similar measures around the world changed everyday life, social and leisure activities—such as listening
to and making music (Lades et al., 2020). In this vein, Spotify—as one of the biggest music streaming service
providers (Statista, 2020)—has released mood-specific and topical playlists addressing this critical situation
so that listeners can foster their mental well-being (King, 2020). Building on these general observations, the
pandemic’s influence on many facets of everyday life offers a rare opportunity to investigate music-listening
behavior in times of a ubiquitous crisis and uncertainty. Accordingly, different research areas have scrutinized
the pandemic’s influence on everyday life in general and on music listening and making in particular: Research
groups, such as the multi-national research network Musicovid1, or conferences, such as the UK Society for
Education, Music and Psychology Research conference, featured panels dedicated to research on the topic.
Furthermore, special editions of scientific journals like Frontiers in Psychology or the current Yearbook were
planned to promote music and COVID-19 research. Despite the growing body of research on this topic, many
questions remain unanswered.

Prior to answering any open questions, however, existing research on how the pandemic impacted music and
how music helped affected people during the pandemic should first be reviewed starting with literature that
describes how the pandemic influenced everyday life in general.

The Pandemic’s Impact on Everyday Life
Internet traffic increased by up to 15–20% in the first weeks of the pandemic, since many people started to
work remotely or restrictions forced them to stay at home (Feldmann et al., 2020). Leisure activities as well
as work processes such as meetings moved online, and Seetharaman (2020) predicts that, from an economic
perspective, the pandemic will change individual jobs and work as well as many companies’ business models.
In addition to their work, people’s mental health and well-being were expected to be affected most during the
crisis (Bäuerle et al., 2020). In their study, Bäuerle and colleagues (2020) found that Germans experienced
more anxiety, depression, and distress during the pandemic than usual. Nevertheless, Germans seem to have

1) See https://www.aesthetics.mpg.de/forschung/abteilung-musik/musicovid-an-international-research-network.html

Jahrbuch Musikpsychologie
2021, Vol. 30, Artikel e95
https://doi.org/10.5964/jbdgm.95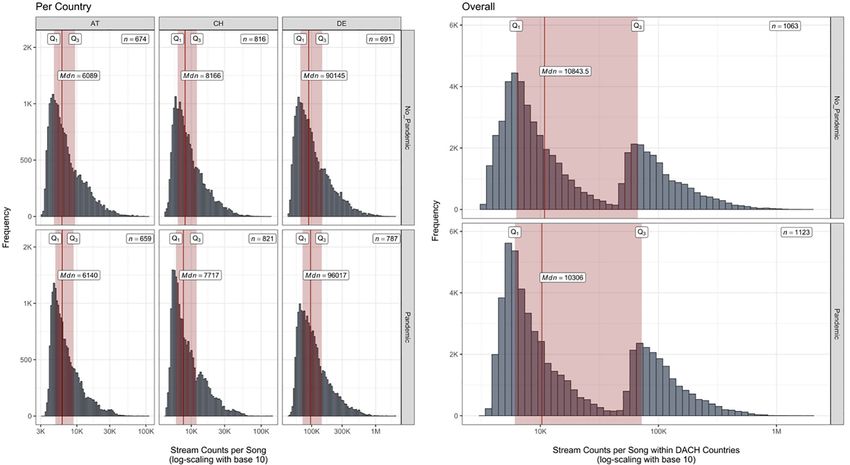
Kalustian & Ruth                                                                                               3

coped better than expected with the situation (Entringer & Kröger, 2020). Still, a survey indicates that people
spent a lot of time (4.45 hours per day on average) thinking about the pandemic and its effect (Petzold et al.,
2020).

While many people were able to adapt their work and private lives to the situation, the pandemic had a strong
impact on individuals working in the cultural industry. With no cultural events, many of them lost their jobs
and income. The live music sector was especially affected since most concerts scheduled in 2020 were either
cancelled or postponed. Some musicians found ways to re-engage in musical training (Antonini Philippe et al.,
2020) or organized online concerts like Global Citizen’s and Lady Gaga’s TV concert, while fans also found
ways to socially engage in music events online (Palamar & Acosta, 2021). Some scholars and journalists
even believe that the pandemic was in some ways a catalyst for a change in the cultural industries and their
relationship with the Internet (Lee et al., 2020).

Effects of Music During the Pandemic
The pandemic influenced how music was released, performed, and used to communicate. Lehman (2020)
shows how song lyrics were used to communicate certain rules (like how to social distance and wash your
hands), for example. Not only did the pandemic affect music, but music influenced people during the pandemic,
too, and not only by telling them how to properly apply certain hygiene concepts.

Music therapeutical interventions were used to successfully reduce stress and improve well-being in medical
staff (Giordano et al., 2020). Another study showed how music should be used in a therapeutic way to improve
the well-being of adults and children (Mastnak, 2020). It was argued that music helps to cope with a situation
like the pandemic and could be applied in personal settings. Additionally, music offered a distraction and
an opportunity to bond socially and engage with others and community events. Virtual music concerts were
described as a sort of collective therapeutic hotline that helped people cope with social distancing and the lack
of cultural events (Vandenberg et al., 2020). This indicates that individuals tend to turn to music for specific
reasons and may adapt their music listening behaviors to an extraordinary situation.

COVID-19 Pandemic and Music Listening
Research on the use of music streaming platforms shows how people use these providers to fulfill certain
needs or for certain reasons and that service developers try to attend to these needs by incorporating social
and creative functions into their software (e.g., Hampton-Sosa, 2017; Henning & Ruth, 2020). These findings
may lead one to believe that music consumption increased during the pandemic. However, a recent study finds
that consumption indeed decreased (Sim et al., 2020). The researchers interpret that the number of streaming
users declined since travel and commuting was largely on pause during the lockdown. People may have also
listened to CDs, vinyl records, radio, or other formats as they worked from home.

Comprehensive research explores how music is used in certain contexts like parties, social situations, com-
muting, sports (Greb et al., 2018; Rentfrow & Gosling, 2003; Skanland, 2011; Sloboda, 2010; van Goethem
& Sloboda, 2011), or during daily routines (Greasley & Lamont, 2011; Lonsdale & North, 2011; North et
al., 2004; Sloboda, 2010). Many of these situations changed during the pandemic, which arguably impacted
music-listening behavior.

Jahrbuch Musikpsychologie
2021, Vol. 30, Artikel e95
https://doi.org/10.5964/jbdgm.95
Spotify Streaming and the COVID-19 Pandemic                                                                       4

It is not unusual that external factors influence the overall music listening of certain populations. An analysis of
the US billboard charts from 1955 to 2003, for example, explains why people listen to more meaningful music
with social connotations during politically and socially threatening time-periods (Pettijohn & Sacco, 2009).

The selection and use of media, especially music, for satisfying certain needs and achieving goals is well
documented and can be explained by different theoretical approaches.

Theoretical Backgrounds
At least three intertwined approaches can describe music listeners’ active and/or goal-orientated selection
behavior toward musical media.

The first approach specifically addresses music listeners’ selective exposure routines by assuming that the
uses-and-gratifications approach can explain decision-making processes (Katz et al., 1973). This theory posits
that individuals have personal and social needs, which are characterized by their personality and their knowl-
edge of how to satisfy these needs through music or media (e.g., Delsing et al., 2008). Thus, people most
frequently choose music they know or prefer to gain gratification from listening to it. Gratification from listening
to music can be summarized into five categories, namely: surveillance, diversion, personal relationships,
personal identity, and mood management (Lonsdale & North, 2011). Additionally, in certain situations people
tend to listen to music that may help them cope with their need to feel nostalgic or secure, especially in times
of crises (Pettijohn & Sacco, 2009; also Yeung, 2020). In this vein, it is unsurprising that streaming service
providers, e.g., Spotify, take advantage of these needs and use pop music to compile playlists that intend to
fulfill certain needs, such as enhancing well-being, helping to relax, and coping with stress, while users create
quarantine playlists focused on song lyrics that seemed funny in the pandemic situation (like the eponymous
song of this article). From a uses-and-gratifications perspective, the former playlists seem sensible in the idea
of helping people cope, divert, and manage their mood.

Zillmann’s (1988) mood management theory is a related conceptual model. It helps to explain how people
choose media and music based on their current and targeted mood (e.g., Zillmann, 2000). For example, if a
listener feels sad and wants to be happy, they will choose that kind of music that appears happy for them to
reach their target mood (or vice versa according to the underlying dispositions in terms of compensation or
cathartic principles, see Schramm, 2005). According to this theory, media or music can be used to enhance,
decrease or to maintain a certain mood (Zillmann, 1988). In a listening context, people tend to use music
more frequently to acquire or keep a positive mood than to reach or stay in a negative mood (Schramm,
2005). Listening to music to achieve a positive mood was most frequently associated with coping with negative
affective states and low emotional health (Randall & Rickard, 2017).

The third concept that accounts for listeners’ active role in choosing musical media to make sense of their
surrounding environment is situated cognition (see e.g., Newen et al., 2018; Schiavio et al., 2017). One
overarching branch within the music-related debates of situated cognition encompasses the enactive aspects
of agents (e.g., listeners and/or musicians) when they interact with their musical environment to foster their
well-being, either tacitly or explicitly. Although studies are often interested in how people can make sense of
their environment (e.g., by humming, listening, dancing or simply musicking, see Small, 1998, or van der Schyff
et al., 2018), enactivist approaches also value the felt or perceived emotionality as an essential part of musical
cognition (see e.g., Krueger, 2009). Accordingly, this perspective can be used to interpret any music-related

Jahrbuch Musikpsychologie
2021, Vol. 30, Artikel e95
https://doi.org/10.5964/jbdgm.95
Kalustian & Ruth                                                                                                  5

coping strategy, such as the uses-and-gratification and/or mood-management approach, as a goal-oriented
way why people listen to music and, foremost, how they bring forth their music-related gratifications while
interacting with their surrounding musical environment.

Research Question
If music is used for coping, mood regulation, and to fulfill certain needs during the pandemic, this behavior
should be reflected in the data on streamed music during the pandemic in comparison to data from the same
period in 2019. Therefore, we aim to answer the following research question:

      RQ: To what extent can we estimate and classify the listening behavior during the pandemic and a
      comparable reference period based on Spotify’s provided audio features for each track by taking the
      mood-related features particularly into account?

To answer the research question systematically, we examine the following hypotheses:

      H1: The dimensionality of Spotify’s mood-related audio features can be reduced to fewer clusters so
      that potential differences (r ≥ .10) can be observed in the stream counts of these clusters between the
      pre-pandemic and the pandemic period for each and across all DACH countries.

      H2: The mood-related clusters and the remaining audio features can successfully be implemented in
      a classification task that aims to classify both periods in an interpretable way so that a high overall
      accuracy can be achieved (ACC ≥ 90%).

                                                   Method
To answer the research question by examining the hypotheses H1 and H2, we automated data collection and
then used exploratory data analysis, null hypothesis significance testing and (un)supervised machine learning
techniques, and methods from the scope of interpretable machine learning to analyze the data.

Data Retrieval
As Spotify is the leading music streaming service provider in many countries, including the German-speaking
countries of Europe (e.g., Statista, 2020), it appears reasonable to examine the music streamed from it. Addi-
tionally, Spotify offers an application programming interface (API) that enables developers to retrieve metadata
for every song on the platform. The DACH countries (i.e., Germany, Austria, Switzerland) were chosen because
their charts feature comparable songs since both English- and German-speaking artists are featured. Moreover,
leading music publishing companies, such as Sony Music, Universal Music, and Spotify itself consider these
three countries as one target audience (Sony Music, 2021; Spotify, 2021b; Universal Music, 2021). By using
web scraping techniques, we retrieved Spotify’s daily top 200 charts from DACH countries as well as the
respective song IDs. Audio features were collected by using Spotify’s API and the R package “Spotifyr”
(Thompson et al., 2021) on the previously retrieved song IDs. The period between March 11 (WHO declares
COVID-19 a pandemic) and June 14, 2020, (travel restrictions lifted in the DACH countries) lasts 96 days
with 200 daily chart positions for each country (NCountry (each) = 19,200; NTotal, Pandemic = 57,600). The same time
frame was used to retrieve data from 2019 (NGermany = 19,199, NAustria = 19,199, NSwitzerland = 19,200; NTotal,
Pre-pandemic = 57,598). Prior to compiling the final dataset (N = 115,198), we controlled for any missing values or

Jahrbuch Musikpsychologie
2021, Vol. 30, Artikel e95
https://doi.org/10.5964/jbdgm.95
Spotify Streaming and the COVID-19 Pandemic 6 observations. On May 17, 2019, in Germany and Austria one missing observation was found respectively for the chart positions 103 in Germany and 135 in Austria. Since those two missing observations in total could not be reconstructed, we removed them and cleaned the entire dataset by converting the cell information into the correct format (e.g., factors as factors, not character strings). Audio Features Spotify provides information on several audio features for every song on its platform, which developers can access via an API. According to the description by Spotify (2021a), these features are estimated and calculated for each track. Some variables are represented as integers, such as loudness (in dB) or tempo (in BPM), while other features, such as “Acousticness”, “Energy” or “Valence” are aggregated scores based on algorith- mic computations implemented by Spotify (2021a). All of the provided audio features are: “Acousticness”, “Danceability”, “Duration”, “Energy”, “Instrumentalness”, “Key”, “Liveness”, “Loudness”, “Mode”, “Speechiness”, “Tempo”, and “Valence”. While there is some research on mood-orientated music selection and playlist curation on Spotify (e.g., Eriksson et al., 2019; Luck, 2016), there are, to our knowledge, only few studies using the free aggregated audio features by Spotify for investigating music listening behavior (e.g., Heggli et al., 2021), whereas within the scope of music information retrieval audio features are often used for content/emo- tion-based music recommender systems (e.g., Deng, 2014). Statistical Analyses Exploratory Analyses For exploring the distributions of the raw (i.e., non-summarized) overall stream counts to understand the properties of the data, it is helpful to plot histograms. Theoretically, a high frequency of low stream counts and a lower frequency of higher stream counts seems more likely than a symmetric (normal) distribution of the stream counts in question. This is because few songs typically reach peak stream counts, while most songs are streamed to a moderate extent—especially those that are listed in such top chart lists. This also matters for recommender systems (see, e.g., Gorakala & Usuelli, 2015, and Deng, 2014). The following histograms show highly right-skewed, or left-leaning, frequencies of those stream counts of songs per country and, accordingly, also for all DACH countries together per period. That is, the stream counts per song of the upper 25% quartile (above the third quartile) are higher than in the respective interquartile range (see labels and the red-shaded rectangles in Figure 1). Hence, the exploratory analysis reveals that stream counts are not normally distributed and the higher stream counts of songs above the third quartile (Q3) are far outside the respective medians. Specifically, when taking a look at the overall histograms we see that smaller frequencies of stream counts in Switzerland and Austria yield bimodal distributions (or two combined unimodal distributions) of the overall data when they are combined with the stream counts of Germany. These findings make it reasonable to summarize the stream counts for each song with medians instead of means (i.e., ensuring robustness). Jahrbuch Musikpsychologie 2021, Vol. 30, Artikel e95 https://doi.org/10.5964/jbdgm.95
Kalustian & Ruth                                                                                                             7

Figure 1

Comparison of Stream Counts of Daily Top 200 Spotify Charts Before and During the Pandemic per Country and Across All DACH
Countries

Note. A log-scaling with base 10 was applied to the x-axis for visual purposes, mainly, to avoid a heavy tail of the higher
stream counts.

Toward a Classification Model
To address our first hypothesis, we reduce the dimensionality of the mood-related audio features by using a
clustering approach. This makes the mood-related audio features more interpretable, which, in turn, means
that we can implement the cluster assignments in question as additional input variables into our classification
model.

K-Means Clustering
We considered commonly used algorithms for structuring the given audio features to have more interpretable
information (i.e., reducing the dimensions of a dataset). Partitioning a dataset into fewer dimensions essentially
means identifying groups with similar within-characteristics compared to other groups with other within-charac-
teristics (see James et al., 2015). To explore such groups in a given dataset without first reducing dimensional-
ity, we can use one of the most straightforward and effective clustering techniques: The k-means algorithm.
Once we have determined the number of distinct clusters/groups (in fact, the “k” in the name denotes the
number of assumed clusters) and normalized the values of the variables that should be clustered, we can
run this algorithm. The crucial point of this clustering strategy is that an identified cluster is characterized by
the average of all data points that should belong to this cluster because of their similarities. That is, each
cluster possesses a center, a centroid, that corresponds to the mean of its assigned data points. Several
variations of this strategy exist: They use different distance measures, which account for the mentioned with-

Jahrbuch Musikpsychologie
2021, Vol. 30, Artikel e95
https://doi.org/10.5964/jbdgm.95
Spotify Streaming and the COVID-19 Pandemic                                                                       8

in-cluster-similarities, and each has its respective (dis)advantage and goal (for a discussion of the four most
used variations, see Morissette & Chartier, 2013). Even if there are several variations of this dimensionality
reduction strategy with different distant measures, their basic idea boils down to (see Hartigan & Wong, 1979):
Once the number of centroids is determined, for example, by using the gap statistic (see Tibshirani et al., 2001)
and theoretical considerations, k centers (centroids) are randomly and iteratively assigned to each observation
by minimizing the sum of the squared Euclidean distances (or another distance metric) between observations
and their centroids. The algorithm terminates as soon as these centroid assignments no longer change during
the iterations. Since the centroids are the means of the observations assigned to their cluster and our case
includes the tonal modality of the songs (i.e., 0 and 1), we basically weigh these modes to have not only, for
instance, two clusters that mainly distinguish between higher and lower valence levels, but also clusters that
also account for the different modes. This is, in fact, a trade-off decision between theoretical and data-driven
considerations. Since Hartigan and Wong’s algorithm ensures that cluster assignments will be stable once the
iterations are completed, it also accounts for cluster observations that are closer to other cluster centroids as
it aims to minimize the sum of squared errors. Accordingly, observations could be assigned to a cluster whose
centroid is farther than other potential centroids, provided such assignments would reduce the sum of squared
error (cf. Lloyd’s version: Morissette & Chartier, 2013, also James et al., 2015). Thus, in our case, it appears
reasonable to stick with Hartigan and Wong’s solution, especially as it empirically outperforms Lloyd’s version
(Slonim et al., 2013). However, before implementing an assumed number of clusters, we should validate the
optimal number of clusters by testing different k-values on at least a subset of the entire dataset. For doing
data-driven considerations, we use the above-mentioned gap statistic method proposed by Tibshirani and
colleagues (2001). Essentially, this method formalizes the well-known elbow/silhouette heuristics (cf. scree plot
method) for estimating the optimal number of clusters by using the rationale of a Monte Carlo simulation (Efron
& Tibshirani, 1993). The gap statistic’s advantage over elbow/silhouette heuristics is that the total within-cluster
variation (characteristics) for different k-values (centroids) is taken into account as a reference distribution of
the data (i.e., the null hypothesis that the data do not have distinguishable clusters) when determining the
optimal k-value. The reference distribution, on the other hand, is sampled by using a Monte Carlo simulation
(i.e., bootstrapping). Once the Monte Carlo simulation is done, the final value of optimal clusters is selected
according to the maximal gap statistic with regard to the reference distribution.

Following this procedure, we choose Spotify’s (2021a) mood-related audio features. We also include songs’ to-
nal modality as a dummy-coded variable, and tempo (BPM) since many well-reviewed theoretical and empirical
findings strongly support the assumption that these variables influence listeners’ mood (Sloboda, 2010). Once
we have min-max-normalized and rescaled all considered features to the same scale between 0 and 1, we
apply the gap statistic method to identify the optimal number of clusters. This procedure partitions the entire
dataset of all distinct songs, in our case, into four clusters as can be seen in Figure 2 and Table 1.

Jahrbuch Musikpsychologie
2021, Vol. 30, Artikel e95
https://doi.org/10.5964/jbdgm.95
Kalustian & Ruth                                                                                                               9

Figure 2

Optimal Clusters With Error Bars According to the Gap Statistic Method

Table 1

K-Means Cluster Solution on Min-Max-Normalized and Rescaled Mood-Related Audio Features

Cluster                   n        Mode       Danceability         Energy   Loudness (rescaled)   Valence   Tempo (rescaled)

1                     26,990        1             .672              .572           .738            .335           .120
2                     32,626        0             .754              .716           .812            .678           .121
3                     26,129        1             .738              .722           .823            .640           .119
4                     29,453        0             .679              .605           .748            .350           .120

Finally, we run Hartigan and Wong’s (1979; see above) k-means algorithm on the selected audio features of the
entire dataset with kGap Statistic = 4, 50 random initializations, and 100 iterations.

Although these clusters are initially meaningful in terms of a high compactness within and high distinguishability
between clusters (based on a high between sum of squares [BSS] to total sum of squares [TSS] ratio—in our
case: BSS/TSS = 83.3%), these clusters are still less informative regarding their underlying and assumed mood
dimensions since they are unlabeled. To give these clusters informative and interpretable names, we should
take a closer look at their specific means while considering the range of their normalized scale (i.e., a value
of .5 indicates a constant value for the variables Danceability, Energy, Loudness (rescaled), and Valence). We
can state, for example, that “Valence” is represented by two values that indicate both a high (i.e., positive; .678
> .5 and .640 > .5) and a low (i.e., negative; .335 < .5 and .350 < .5) characteristic for each tonal modality
(major = 1, minor = 0) according to Spotify’s characterization of these mood-related variables. In this vein, we
finally can decide how to name these clusters so that they are conceptually informative and interpretable.

Interpreting these cluster centroids according to the arousal-valence-circumplex model (Russell, 1980, also
Scherer, 2005) and the theories mentioned above, we can state that if a cluster has a high (> .5) “Valence”,

Jahrbuch Musikpsychologie
2021, Vol. 30, Artikel e95
https://doi.org/10.5964/jbdgm.95
Spotify Streaming and the COVID-19 Pandemic 10
“Danceability”, “Energy” and “Loudness” value, this cluster can be characterized by a higher arousal-potential
and a positive emotionality that music listeners may associate with such qualities of those audio features.
Since this particular cluster (higher arousal-potential with positive emotionality) consists of songs whose tonality
should be major, we can support the potential positiveness that listeners may also experience based on the
tonality of the songs that should belong to this cluster (see e.g., Parncutt, 2014, also Athanasopoulos et al.,
2021, also Sievers et al., 2013). Hence, we can name and characterize the other clusters according to their
values on the arousal and valence levels and update the previous Table 1 as shown in Table 2.
Table 2
K-Means Cluster Solution on Min-Max-Normalized and Rescaled Mood-Related Audio Features With Additional Cluster Characterizations
Cluster/Cluster names n Mode Danceability Energy Loudness (rescaled) Valence Tempo (rescaled)
1
Moderate Arousal- 26,990 1 .672 .572 .738 .335 .120
Potential with negative
Emotionality (major)
2
Higher Arousal- 32,626 0 .754 .716 .812 .678 .121
Potential with positive
Emotionality (minor)
3
Higher Arousal- 26,129 1 .738 .722 .823 .640 .119
Potential with positive
Emotionality (major)
4
Moderate Arousal- 29,453 0 .679 .605 .748 .350 .120
Potential with negative
Emotionality (minor)
A scatterplot is helpful for visually assessing the compactness and separation of these clusters. As Figure 3
shows, the different clusters are distinguishable when they are plotted in a three-dimensional space. The two
clusters with a higher arousal-potential (bright red- and dark green-colored) are more compact than those with
moderate arousal-potential, as these show greater dispersion (i.e., purple- and blue-colored).
Jahrbuch Musikpsychologie
2021, Vol. 30, Artikel e95
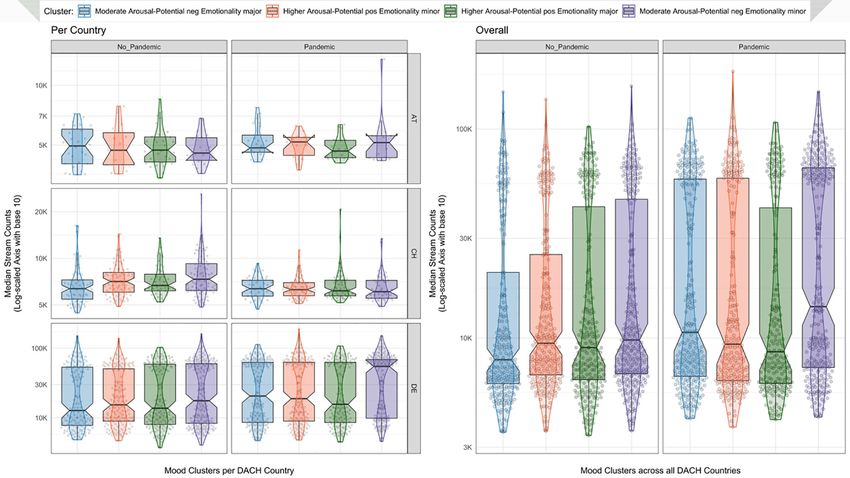
https://doi.org/10.5964/jbdgm.95Kalustian & Ruth 11 Figure 3 3D Scatterplot With Ellipsoids of the K-Means Cluster Solution Across All DACH Countries Note. Ellipsoids show at a coverage level of 68.27% (i.e., area within the first SD when a bivariate normal distribution is assumed) how concentrated the respective clusters are. Dimension reduction for visual purposes was conducted by using principal component analysis. To account for research hypothesis H1, we need to test whether and how these cluster assignments differ between the two periods in question across all DACH countries and between each DACH country. So, to explore any meaningful differences regarding the most streamed cluster per country and per period, we can plot the clusters within each DACH country and between those two periods against their stream counts while taking the skewness of the stream counts (see Figure 1) into account by summarizing on median stream counts. At first glance, Figure 4 shows that the most boxplot notches overlap. Based on that, we can informally conclude that any potential differences in the streamed clusters per country are rather small, if even present, regarding their effect size (r ≤ .10). Interestingly, the median stream counts of the purple-colored mood cluster “Moderate Arousal-Potential with negative Emotionality (minor)” are higher during the pandemic across all Jahrbuch Musikpsychologie 2021, Vol. 30, Artikel e95 https://doi.org/10.5964/jbdgm.95
Spotify Streaming and the COVID-19 Pandemic                                                                                      12

countries and per country, except for Switzerland. Here we see rather the opposite since the songs belonging
to the cluster “Moderate Arousal-Potential with negative Emotionality (minor)” were streamed in Switzerland
during the pre-pandemic period more frequently than during the pandemic. To test this visual impression
statistically, we run pairwise comparisons via the Dunn test with Holm correction for each country and for both
periods across all countries with an alpha-level of 5%.

Figure 4

Combined Box, Violin, and Scatter Plots of the K-Means Cluster Solution for Each DACH Country and Across All DACH Countries Against
Their Median Stream Counts Before and During the Pandemic

As expected from the visual information in Figure 4, there are statistically significant differences in the median
stream count per song in a cluster observable, both between two DACH countries and across all DACH
countries between both periods. According to the Dunn test with Holm correction for the median stream counts
per song per DACH country between both periods, we can observe few relevant difference effects: Indeed, in
Switzerland the central tendencies of the median stream counts per song belonging to the purple-colored mood
cluster Moderate Arousal-Potential with negative Emotionality (minor) differ to a moderate extent (MdnNo_Pan-
demic = 7,328.5, MdnPandemic = 6,085, z = -3.69, padj = .002, r = .328, nNo_Pandemic = 76, nPandemic = 51). That
is, people in Switzerland streamed more of the songs that belong to this cluster during the pre-pandemic
period. Furthermore, we can also observe a small difference effect regarding the bright red-colored cluster
“Higher Arousal-Potential with positive Emotionality (minor)” in Switzerland. During the pandemic, the songs
belonging to this clusters were less streamed compared to the pre-pandemic period (MdnNo_Pandemic = 7,084,
MdnPandemic = 6,275, z = -2.86, padj = .0416, r = .241, nNo_Pandemic = 79, nPandemic = 63). The only other relevant
difference effect, although a small one, is observable in one cluster in Germany. Here, people streamed the
songs belonging to the purple-colored cluster Moderate Arousal-Potential with negative Emotionality (minor)

Jahrbuch Musikpsychologie
2021, Vol. 30, Artikel e95
https://doi.org/10.5964/jbdgm.95
Kalustian & Ruth                                                                                                 13

more often during the pandemic (MdnNo_Pandemic = 17,591.5, MdnPandemic = 54,730, z = 3.75, padj =.002, r = .185,
nNo_Pandemic = 190, nPandemic = 217).

When it comes to differences across all DACH countries between both periods, we can only state small differ-
ence effects in the clusters Moderate Arousal-Potential with negative Emotionality (major) (MdnNo_Pandemic =
7,874.5, MdnPandemic = 10,639, z = 3.53, padj = .002, r = .154, nNo_Pandemic = 250, nPandemic = 275) and Moderate
Arousal-Potential with negative Emotionality (minor) (MdnNo_Pandemic = 9,786.5, MdnPandemic = 14,124, z = 3.55,
padj = .002, r = .148, nNo_Pandemic = 288, nPandemic = 283). Based on these findings, we can now address the
second hypothesis by building a binary classifier.

Building a Support-Vector Machine Binary Classifier
To test hypothesis H2, we build a binary classifier and change with this the perspective in that we aim to
identify and classify given information. That is, the two periods, as factors, pose now the dependent variable,
whereas the mood clusters as factors together with rescaled stream counts and chart positions as well as
the variables “Acousticness”, “Speechiness”, “Liveness”, “Instrumentalness”, the duration of the songs, and the
DACH countries as factors pose now the independent or input variables.

Simple classifications tasks within the scope of machine learning, such as binary classifications (cf. logistic
regression), are helpful in deciding to which class an observation belongs in not seen data (i.e., the validation
and/or the test dataset) based on learned/modeled structures of a training dataset. Different algorithms have
various uses for solving such tasks (see e.g., naïve Bayes, k-nearest neighbor, or random forest classifiers
in James et al., 2015). However, when it comes to multiple input variables (i.e., high-dimensional space)
and complex (i.e., non-linear or overlapping) cases regarding which label (i.e., pre-pandemic vs. pandemic)
an observation belongs to, fewer algorithms are suited to handle this task well. Considering these precondi-
tions, we choose the support-vector machines (SVM) algorithm, because it is particularly strong in solving
high-dimensional and non-linear problems (Rhys, 2020). While the fundamental idea of this algorithm is
straightforward, the mathematical background requires more explanation (for a detailed introduction to SVM
and their mathematical background, see, e.g., Campbell & Ying, 2011; Hastie et al., 2009; James et al., 2015;
for the original algorithm proposal: Boser et al.,1992). The main reason why SVMs often outperform other
(multi-label) classifiers is that the algorithm includes a so-called kernel trick. This trick essentially transforms
the data based on a (non)linear kernel function that adds an extra dimension to the data (i.e., hyperplane)
whose position is supported by the data points that touch the margin of this hyperplane. The hyperplane allows
actual overlapping observations to be separated in a higher dimension, such that either some misclassifications
are accepted for ensuring greater robustness (i.e., soft margin classification), or that misclassifications are
not tolerated (i.e., hard/maximal margin classification; prone to overfitting). So, it appears reasonable to not
always seek the maximal margin and the perfect fit that would yield correct classifications, both on the correct
side of the hyperplane and the margin. That is, we also have to choose whether a soft or a hard/maximal
margin classifier should be used as an additional cost hyperparameter (C) that penalizes incorrect observations
inside the margin and boundary with narrower margins. Finally, to control how much influence an observation
has on the position of the hyperplane, we use an additional hyperparameter (γ) to validate how granular
the decision boundaries should be. Before running the SVM algorithm at all, these hyperparameters need to
be cross-validated so that the optimal values can be used during model training once the entire dataset is
partitioned into training and test sets, such that classifications (or predictions) can be made based on the
(learned/modelled) structures within the training data.

Jahrbuch Musikpsychologie
2021, Vol. 30, Artikel e95
https://doi.org/10.5964/jbdgm.95
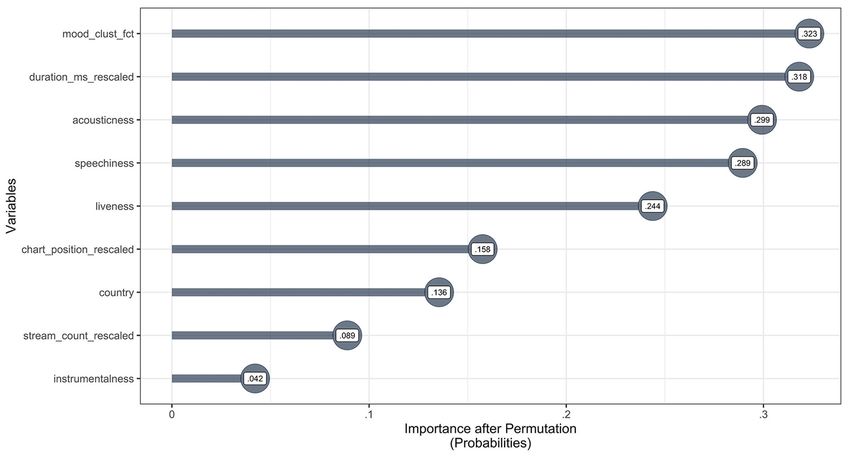
Spotify Streaming and the COVID-19 Pandemic                                                                     14

Since we have two balanced classes (i.e., the periods), we split the data structure by considering the so-called
Pareto principle such that 20% of the entire data were assigned to the test dataset and 80% of the data were
used for training and cross-validation purposes. Furthermore, we aggregated the datasets so that the training
and test data consist of the same track IDs and the same countries.

After partitioning the entire dataset into training and test sets, we took a smaller random sample (20%) of the
training dataset (due to computational reasons) to finally run a random grid search for five-fold cross-validated
hyperparameters (Rhys, 2020, regarding the concept of k-fold cross-validation see, e.g., Witten et al., 2011)
for a radial kernel function within the range of 0.5 ≤ γ ≤ 5 and 10-1 ≤ C ≤ 104 (this entire cross-validation
took nonetheless more than two and a half hours although multiple cores were parallelized). Building on the
outcomes of this five-fold cross-validation of the hyperparameters, we trained the binary SVM classifier with a
radial kernel function with the best cross-validated fit of C = 100 and γ = 2. Once our SVM model was trained,
we applied it on the test set to classify the two periods in question. The results show that our model can
indeed classify the two periods with a high overall accuracy (i.e., macro-F1 measure) across all classes (ACC
= 97.87%, 95% CI [.977, .981]). The pre-pandemic period was used as a reference class which means that the
model was trained to classify true positive/correct observations of the pre-pandemic period. Although such a
high accuracy poses a desired outcome of our model training, we do not know at this stage which independent
or input variables had to what extent influence in classifying the pre-pandemic period that correctly. In other
words: Why should we trust our model?

Interpreting SVM classifications — Since the SVM algorithm is based on complex inner structures, the
interpretability of its outcome is not a trivial task—not to speak of when we deal with relatively large datasets.
To overcome such an obstacle, we can examine different aspects that ensure or facilitate interpretability on
different levels. On a more general level we can, for instance, extract different degrees of importance of the
used independent variables to classify (or predict) the dependent variable of interest (Fisher et al., 2019). On a
more specific level, it is also possible to investigate, for example, a partial dependence of a certain independent
variable regarding its probability to classify (or predict) the outcome variable. This is particularly useful when
interpreting marginal effects of an independent variable on the dependent variable: The smaller the marginal
effects on the dependent variable are, the less important they are regarding their classification or prediction
impact (Greenwell et al., 2018; see also Boehmke & Greenwell, 2020, and Molnar, 2019, where interpretable
machine learning methods are introduced and discussed).

When considering such approaches to ensure interpretability of our built model, we can apply them accordingly
so we can explain how our independent variables influence the true correct/positive classification of observa-
tions that belong to the pre-pandemic period (and accordingly to the pandemic period). Specifically, we can
use a permutation approach to extract the importance of the used independent variables. The main idea of
this approach revolves around the error that the model will have during its classification or prediction if the
values of the independent variables in the training set were permuted. For if the values of the independent
variables are permuted, their relation to the dependent variable is practically destroyed. Now, if the difference
in the probability to correctly classify (or predict) the dependent variable between the baseline classification
and the permuted version shows that the model error is higher (relative to the other independent variables), we
can conclude that the independent variable with the highest probability of making an error if it is ignored after
permutation is the most important independent variable to correctly classify (or predict) the reference class of

Jahrbuch Musikpsychologie
2021, Vol. 30, Artikel e95
https://doi.org/10.5964/jbdgm.95
Kalustian & Ruth                                                                                                15

the dependent variable (Boehmke & Greenwell, 2020). Accordingly, the independent variables with the lowest
probability after their permutation are less important to classify the dependent variable correctly.

After carrying out such a permutation of all input variables of the entire training set with five Monte Carlo
simulations (i.e., the independent variables of 92,229 observations were, first, five times permuted, then,
the results were averaged), we can plot the results of the probabilities for classifying the pandemic period
incorrectly if the respective independent variables are ignored relative to the other variables as shown in Figure
5.

Figure 5

Permutation-Based Variable Importance (Independent Variables) for the SVM Model (Training Set)

As we can see, our previously clustered mood-related audio features are the most important independent
variable (factor) in classifying the pandemic period. That is, the probability for a classification error increases
by 32.3% if this factor will be ignored relative to the other independent variables. We see, by using this
permutation-based variable importance approach, we already can provide more concrete interpretability since
we can explain to what extent the respective independent variables influence the true correct/positive classifica-
tion of the dependent variable. However, we can even improve the interpretability if we consider the partial
dependence of the distinct mood clusters within the variable mood_clust_fct since we now know that this
variable (factor) is the most important one. By doing so, the values of all four distinct mood clusters are
once replaced with each cluster, then the classification of the dependent variable of interest follows. Once this
iterative process is done, all classifications are averaged.

Resulting from this procedure, we see in Figure 6 that the average/estimated probabilities of the distinct
clusters to classify the dependent variable, the pandemic period in our case, indeed marginally differ.

Jahrbuch Musikpsychologie
2021, Vol. 30, Artikel e95
https://doi.org/10.5964/jbdgm.95
Spotify Streaming and the COVID-19 Pandemic 16
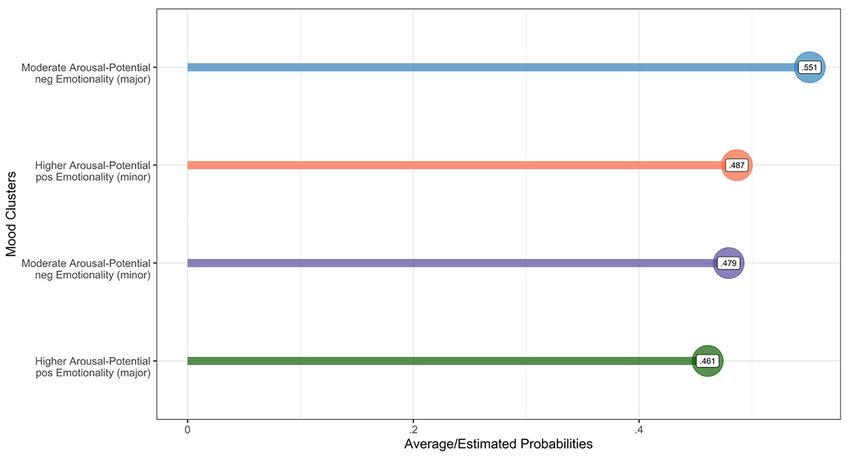
Figure 6
Partial Dependence Plot of the Mood Clusters With Averaged Probabilities Regarding the Classification of The Pandemic Period
Furthermore, we see that all clusters have a similar effect on the model classification of the pandemic period.
In particular, we see that the songs, that belong to the cluster Moderate Arousal-Potential with negative Emo-
tionality (major), show the highest probability for classifying the pandemic period relative to the other clusters
(this goes in line with the observed difference effect, see Figure 4), whereas the songs belonging to the cluster
“Higher Arousal-Potential with positive Emotionality (major)” have the lowest probability, although similarly low
as both clusters in the middle.
After carrying out these methods to gain more insights, we could indeed extract useful information on both
levels. On the more general level, we now know which independent variables contribute to what extent to the
classification task. Moreover, we know that our identified mood clusters are the most important variable in our
model. On the other hand, we also could zoom in the mood cluster variable (factor) to see how the different
clusters have their marginal effects in classifying the pandemic period. That is, these post-hoc methods can
ensure more interpretability so that even highly complex supervised machine learning algorithms/models do not
remain non-understandable black box models (provided the model is well-trained and cross-validated).
Results
Examining music-listening behavior during the COVID-19 pandemic in the DACH countries by using open data
from the streaming service provider Spotify yields results that support our research hypotheses, even with
some caveats. Our work supports H1 (distinct mood-related clusters can be identified based on the given audio
features that reflect music-listening behavior) in that we could indeed identify mood-related clusters with a
Jahrbuch Musikpsychologie
2021, Vol. 30, Artikel e95
https://doi.org/10.5964/jbdgm.95Kalustian & Ruth 17 BSS/TSS ratio of 83.3% that could represent music-listening behavior during the pandemic as a proxy in virtue of the different audio feature qualities. Furthermore, we could find statistically significant differences with small to moderate effects (.149 ≤ r ≤ .328) regarding the respective cluster stream counts within a country as well as across all countries between both periods. Hence, we can support H1 not only in terms of the overall identified clusters, but also with respect to significantly different cluster stream counts within two countries and across all DACH countries between the pre-pandemic and the pandemic period. On the other hand, we also have evidence to support H2 (periods can be classified based on the mood-related clusters, the other available audio features, and the DACH countries) based on the outcome of our built binary SVM classifier that yielded a high overall accuracy (ACC = 97.87%, 95% CI [.977, .981]). For a tidy overview of the model’s performance metrics, we can consult the confusion matrix to evaluate our model’s accuracy by using the harmonic mean of precision (ratio of correct classified observations and the total of all classified observations) and recall (proportion of correct classified observations to all observations that should be classified as correct because they possess the characteristic or the label to be classified). This is especially desirable, as we cannot visualize the final classification results and the decision boundaries because of the high dimensionality of the data (for the so-called curse of dimensionality, see Bellman, 1957). Furthermore, a principal component analysis for dimensionality reduction would not yield the desired interpretability, unlike the visualization of the cluster solution, since the different input variables in question would not be distinguishable, while the decision boundaries of our trained model would be obsolete at the same time. However, based on the variable importance and the partial dependence of the most important variable to classify the (pre-)pandemic period, we could develop an understanding of how the independent variables have effects on the classification of the two periods in question. So, to have now the tidy overview of the model’s performance, a confusion matrix provides further useful insights. The correct classification rates for both periods are high as shown by the columns precision and recall of Table 3. Specifically, our model classifies almost all observations correctly; however, the slightly higher recall than precision in the pandemic period indicates that our model also misclassifies some observations as pan- demic-related even though they are not (i.e., false correct classifications). Recalling that the blue-colored mood cluster Moderate Arousal-Potential with negative Emotionality (major) has the highest probability relative to the other clusters in classifying the pandemic period, we can at this point infer that false correct classifications of the pandemic period are at least correlated with this cluster. The opposite is true regarding the pre-pandem- ic-related observations: Our model correctly classifies some pre-pandemic-related observations, while it misses others (lower recall than precision, i.e., false incorrect classifications; for a discussion of these classification measures, see, e.g., James et al., 2015). However, as we deal with balanced data (prevalence = 50%), such misclassifications are also balanced across both classes (see F1-score) so that the overall accuracy provides in our case indeed a suitable evaluation metric. Jahrbuch Musikpsychologie 2021, Vol. 30, Artikel e95 https://doi.org/10.5964/jbdgm.95
Spotify Streaming and the COVID-19 Pandemic                                                                       18

Table 3

SVM Classification Confusion Matrix

                                            Observations (song IDs)                       %

Period (classes)                      Correctly classified       Actual   Precision     Recall            F1

No Pandemic                                 11,236               11,487    97.93         97.81           97.87
Pandemic                                    11,244               11,482    97.82         97.92           97.87

All in all, we can therefore state that our model performs quite well in classifying the observations of each
period to their respective class based on the used input variables.

                                                             Discussion
Since we clustered Spotify’s mood-related audio features together with the tonal modalities that Spotify assigns
to the songs, we have, in principle, a framework for making further assumptions about the possible underly-
ing music-listening behavior regarding Spotify’s top 200 chart songs during the first wave of the COVID-19
pandemic in DACH countries and the reference period in 2019. In this vein, we can state that the four
identified clusters may represent emotional dimensions according to the arousal-valence-circumplex model
(Russell, 1980, Scherer, 2005) that can be experienced by potential listeners whose levels of music-related
(psycho)social states and traits—such as musical preferences (Rentfrow & Gosling, 2003), personality traits
(Costa & McCrae, 1980, also Gosling et al. 2003), cognitive styles of music listening (Kreutz et al., 2008), or
musical sophistication (Müllensiefen et al., 2014)—are represented on the levels of those audio features. As we
could find statistically meaningful differences in the stream counts of the identified clusters within two countries
and across all DACH countries between both periods, we can state that the identified clusters were streamed
differently in both periods. This is insofar interesting as we can conclude the following: Since across all DACH
countries the clusters with moderate arousal and negative emotional potentials, both in minor and major, were
streamed during the pandemic more often, we can tentatively assume that music listeners could cope with
pandemic’s stress by listening to the songs belonging to these clusters—possibly according to the iso-principle
(see Schramm, 2005). However, we have to be careful with such assumptions as such effects might only be
correlative and not causal, especially as we do not have survey data at hand, but only proxy variables (see the
identified mood cluster) that could support such assumptions.

Furthermore, since our binary SVM classifier could classify each period based on the mood clusters, the
remaining audio features, and the DACH countries, the results indicate that both periods show distinct profiles,
which is why it was possible to classify the observations to the periods. Thus, we can answer our research
question based on H1 and H2 as follows:

      H1*: The dimensionality of Spotify’s mood-related audio features could be reduced to fewer clusters.
      The statistically significant small to moderate difference effects (.149 ≤ r ≤ .328) in the median stream
      counts per song within a cluster per country between both periods as well as across all DACH coun-
      tries support the hypothesized difference effects.

      H2*: The mood-related clusters could be implemented in a classification task such that each period was
      classified with high proportions of precision and recall and a high overall accuracy (ACC = 97.87%).

Jahrbuch Musikpsychologie
2021, Vol. 30, Artikel e95
https://doi.org/10.5964/jbdgm.95
You can also read