The role of emission reductions and the meteorological situation for air quality improvements during the COVID-19 lockdown period in central Europe
←
→
Page content transcription
If your browser does not render page correctly, please read the page content below
Atmos. Chem. Phys., 21, 13931–13971, 2021
https://doi.org/10.5194/acp-21-13931-2021
© Author(s) 2021. This work is distributed under
the Creative Commons Attribution 4.0 License.

The role of emission reductions and the meteorological situation
for air quality improvements during the COVID-19 lockdown
period in central Europe
Volker Matthias, Markus Quante, Jan A. Arndt, Ronny Badeke, Lea Fink, Ronny Petrik, Josefine Feldner,
Daniel Schwarzkopf, Eliza-Maria Link, Martin O. P. Ramacher, and Ralf Wedemann
Helmholtz-Zentrum Hereon, Max-Planck-Straße 1, 21502 Geesthacht, Germany

Correspondence: Volker Matthias (volker.matthias@hereon.de)

Received: 3 May 2021 – Discussion started: 8 June 2021
Revised: 17 August 2021 – Accepted: 18 August 2021 – Published: 21 September 2021

Abstract. The lockdown measures taken to prevent a rapid              The lockdown can be seen as a big experiment about air
spreading of the coronavirus in Europe in spring 2020 led to       quality improvements that can be achieved through drastic
large emission reductions, particularly in road traffic and avi-   traffic emission reductions. From this investigation, it can be
ation. Atmospheric concentrations of NO2 and PM2.5 were            concluded that NO2 concentrations can be largely reduced,
mostly reduced when compared to observations taken for the         but effects on annual average values are small when the mea-
same time period in previous years; however, concentration         sures last only a few weeks. Secondary pollutants like ozone
reductions may not only be caused by emission reductions           and PM2.5 depend more strongly on weather conditions and
but also by specific weather situations.                           show a limited response to emission changes in single sec-
   In order to identify the role of emission reductions and        tors.
the meteorological situation for air quality improvements in
central Europe, the meteorology chemistry transport model
system COSMO-CLM/CMAQ was applied to Europe for the                1   Introduction
period 1 January to 30 June 2020. Emission data for 2020
were extrapolated from most recent reported emission data,         The global spread of the coronavirus since the start of 2020
and lockdown adjustment factors were computed from re-             resulted in unprecedented emission reductions caused by
ported activity data changes, e.g. Google mobility reports.        lockdown measures in many parts of the world. In Europe,
Meteorological factors were investigated through additional        significant reductions in road and air traffic as well as in
simulations with meteorological data from previous years.          industrial activities began between the end of February and
   The results showed that lockdown effects varied signifi-        the middle of March 2020. Emissions were heavily reduced
cantly among countries and were most prominent for NO2             in short time but then steadily increased again as lockdown
concentrations in urban areas with 2-week-average reduc-           measures were lifted step by step, until they reached ap-
tions up to 55 % in the second half of March. Ozone con-           proximately previous-year levels in summer (Forster et al.,
centrations were less strongly influenced (up to ±15 %) and        2020). However, this temporal emission behaviour varied
showed both increasing and decreasing concentrations due           from country to country and among the different emission
to lockdown measures. This depended strongly on the me-            sectors. Emission reductions between the second half of
teorological situation and on the NOx / VOC emission ratio.        March and end of June 2020 were probably the largest in Eu-
PM2.5 revealed 2 %–12 % reductions of 2-week-average con-          rope since decades, in particular in traffic. From an air quality
centrations in March and April, which is much less than a          perspective, this can be regarded as a huge real-world exper-
different weather situation could cause. Unusually low PM2.5       iment about the effects of severe emission reductions on air
concentrations as observed in northern central Europe were         pollutant concentrations and possible side effects of emission
only marginally caused by lockdown effects.                        reduction measures, e.g. on secondary pollution formation.

Published by Copernicus Publications on behalf of the European Geosciences Union.
13932                            V. Matthias et al.: The role of emissions and meteorology during the COVID-19 lockdown

   Observational data at ground level and from satellite            runs were based on the same meteorological fields. Consid-
showed large but regionally different reductions in NO2 con-        erable decreases in NO2 concentrations due to the lockdown
centrations (e.g. Bauwens et al., 2020; Menut et al., 2020;         measures alone have been found. The effect on fine particle
Velders et al., 2021; Lonati and Riva, 2021). For particulate       concentrations has been comparably less pronounced (−5 %
matter (PM), concentration reductions were less clear and           to −15 %). Sharma et al. (2020) performed a similar study for
not necessarily in line with the expectations that would fol-       India; they reported a remarkable increase in O3 . With focus
low the estimated emission reductions. Obviously, weather           on the Netherlands, Velders et al. (2021) used a machine-
conditions also have a significant impact on pollutant con-         learning (ML) algorithm to remove the effects due to meteo-
centration levels, but despite the high number of publications      rological variability on pollutant concentrations and applied
that analyse COVID-19 lockdown effects on air pollution,            chemical transport modelling. They concluded that the un-
meteorological influences are mostly not taken into account         usual 2020 meteorology in the Netherlands led to decreased
properly (Gkatzelis et al., 2021). Wind direction determines        PM10 and PM2.5 concentrations but the NO2 and O3 con-
strongly the advection of gases and aerosols from distant re-       centrations were not affected. In a study addressing the air
gions into the area of interest, higher wind speeds can ac-         quality during the lockdown period in Milan, Collivignarelli
tivate additional emission sources like resuspension of de-         et al. (2020) eliminated the influence of weather phenomena
posited particles, solar radiation affects photochemical reac-      on the air quality by identifying a meteorological reference
tions and precipitation amounts control deposition.                 period. Using machine-learning (ML) models fed by meteo-
   As has been pointed out in recent publications about the         rological data, Petetin et al. (2020) estimated the NO2 mixing
effect of COVID lockdown emission reductions on air pollu-          ratios for Spain that would have been observed in absence of
tant concentrations (e.g. Menut et al., 2020; Velders et al.,       the lockdown. It was found that the lockdown measures were
2021), the relationship between emissions and concentra-            responsible for a 50 % reduction in NO2 levels. Goldberg et
tions is not necessarily straightforward and easy to explain. A     al. (2020) showed that accounting for meteorological influ-
simple comparison between before and after lockdown con-            ences is important when satellite data are used to estimate the
centrations neglects seasonal and weather effects. A similar        drops in columnar NO2 in the United States. And van Heer-
argument holds for comparisons with the same week of the            waarden et al. (2021) used ground-based and satellite obser-
previous year. While seasonal effects are considered in this        vations in combination with radiative transfer modelling to
case, the weather situation might still be very different. In ad-   disentangle meteorological effects and those of aerosol emis-
dition, technology or economically driven emission changes          sions. They concluded that lockdown measures were far less
from one year to another are not taken into account. Chem-          important for the irradiance record than the exceptionally dry
istry transport models and sophisticated emission models can        and particularly cloud-free weather.
help in disentangling the relationships between emissions,             In this paper we present results derived with the COSMO-
meteorology and concentration levels. In addition, they can         CLM/CMAQ model system together with a highly modular
quantify the contribution of different source sectors and in-       emission model to quantify the contribution of the estimated
vestigate effects of reduced concentrations of specific pollu-      emission reductions on the concentrations of NO2 , O3 and
tants on the formation of other secondary species. For exam-        PM2.5 in central Europe and to separate the contribution of
ple, it has been discussed by Kroll et al. (2020) and Huang         emission changes from those caused by distinct weather pat-
et al. (2020) that lower NO emissions might lead to higher          terns. CMAQ was fed with updated emission data for the year
ozone concentrations and a higher potential for the oxida-          2020, including time profiles for sectors and countries that
tion of organics, which might result in increased secondary         approximate the lockdown emission reductions. Chemistry
organic aerosol (SOA) formation. In fact, Amouei Torkma-            transport model simulations were performed for January–
halleh et al. (2021) analysed observed NO2 and O3 concen-           June 2020. The effects of distinct weather patterns on the ef-
trations in numerous cities around the world and report in-         fects of emission reductions on pollutant concentrations were
creased ozone in urban environments. However, depending             investigated through additional simulations with meteorolog-
on the NOx / VOC emission ratios and the meteorological             ical conditions for the same time period in recent previous
situation, the effects might differ from place to place (see        years with very different weather conditions. The results al-
e.g. Mertens et al., 2021).                                         low for an interpretation of the observed concentration re-
   To quantify the effects of the lockdown measure on am-           ductions when compared to previous years. It also gives a
bient concentrations, these need to be separated from other         range of possible concentration changes resulting from the
sources of influence which predominantly are assumed to             same emission reductions.
be the meteorological conditions. For Europe, Menut et
al. (2020) assessed the influence of lockdown measures on
air quality without the biases of meteorological conditions in      2   Model simulations
an ad hoc modelling study for March 2020. They compared
a reference model run with 2017 emission data for Europe            This study focuses on the effects of emission reductions dur-
to a lockdown run with estimated emission reductions. Both          ing the lockdown in central Europe in spring and early sum-

Atmos. Chem. Phys., 21, 13931–13971, 2021                                           https://doi.org/10.5194/acp-21-13931-2021
V. Matthias et al.: The role of emissions and meteorology during the COVID-19 lockdown                                      13933

                                                                   cess 16 September 2021). Particle and gas concentration
                                                                   fields of the Global Analysis and Forecast are provided on a
                                                                   T511 spectral grid with 137 vertical levels. Emission changes
                                                                   caused by lockdown measures are not considered in this
                                                                   data set. The IFS-CAMS data were temporally and spatially
                                                                   remapped onto the boundary of the CMAQ domain. Finally, a
                                                                   unit conversion and a transformation of the chemical species
                                                                   from IFS-CAMS to CMAQ were applied.
                                                                      Meteorological data for the CMAQ model were provided
                                                                   by a simulation of the COSMO model (Baldauf et al., 2011;
                                                                   Doms et al., 2011; Doms and Schättler, 2002) applying
                                                                   the version COSMO5-CLM16 (climate mode; Rockel et al.,
                                                                   2008). To simulate the radiative transfer as realistic as possi-
                                                                   ble, an extension of the COSMO model for the MACv2 tran-
                                                                   sient aerosol climatology was used. The soil was initialized
                                                                   taking the data from a 40-year simulation with the COSMO
                                                                   model. Then, the atmospheric simulations were performed
                                                                   for the period 1 September 2019 to 30 June 2020 using the
                                                                   MERRA2 global reanalysis (Gelaro et al., 2017) as initial
                                                                   and lateral boundary conditions. The same was done for the
                                                                   periods 1 September 2015 to 30 June 2016 and 1 September
                                                                   2017 to 30 June 2018. To ensure that the atmospheric fields in
                                                                   the transient model integration are close to the observations
                                                                   over the whole period of 10 months, a nudging technique
                                                                   was used as described in Petrik et al. (2021). The reader is
Figure 1. Inner domain of the CMAQ model (black line) along with   referred to this publication to find more information about
the coordinates of the CMAQ projection (values outside the zebra   the setup of the atmospheric model (setup “CCLM-oF-SN”).
frame).                                                               CMAQ simulations were performed with emissions as
                                                                   they could be expected for 2020 without any lockdown mea-
                                                                   sures and with another emission data set that was modified
mer 2020. While emission changes were considered for all           according to reported changes in traffic and industrial activ-
of Europe, the main area under investigation with respect to       ities. The latter is regarded as the emission data set that best
effects on concentrations covers the most populated regions        reproduces real-world emissions during the first COVID-19
in central Europe (Fig. 1) only. This restriction was applied      lockdown phase in 2020. In the following we will refer to
for the sake of a higher resolution and for allowing a rea-        this simulation as the COV case, while the simulation with
sonable interpretation of meteorological impacts. The Com-         expected emissions without lockdown is referred to as the
munity Multiscale Air Quality Model (CMAQ) (Byun and               noCOV case. The difference between the simulated pollutant
Schere, 2006; Byun and Ching, 1999) version 5.2 was used           concentrations for the two cases represents the COVID-19
with the carbon bond 5 (CB05) photochemical mechanism              lockdown effects on air quality. A detailed description of the
(CB05tucl) (Kelly et al., 2010) and the AE6 aerosol mech-          emission data construction is given in the next section. Addi-
anism. The model was run for 2020 with a spin-up time of           tional model simulations with meteorological conditions for
2 weeks in 2019 to avoid the influence of initial conditions       the years 2016 and 2018 have been performed with CMAQ
on the modelled atmospheric concentrations. CMAQ was set           using the same 2020 emission data sets.
up on a 36 × 36 km2 grid for all of Europe and for a one-way
nested 9 × 9 km2 grid for central Europe; see Fig. 1. The ver-
tical model extent comprises 30 layers from the model sur-         3     Emission data
face up to the 100 hPa pressure level. Twenty of these layers
are below approx. 2000 m, and the lowest layer has a height        3.1    Basic emissions 2020, noCOV case
of 36 m.
   Chemical boundary conditions for the outer model do-            Emissions are based on the CAMS-REGAP-EU version
main were taken from the IFS-CAMS analysis (Inness et              3.1 available at the ECCAD website (https://permalink.
al., 2019) available from the MARS archive at ECMWF and            aeris-data.fr/CAMS-REG-AP, last access: 16 September
the Copernicus Atmosphere Monitoring Service Atmosphere            2021). The data set comprises annual totals for anthro-
Data Store (https://ads.atmosphere.copernicus.eu/cdsapp#!/         pogenic emissions in 13 GNFR sectors (Granier et al., 2019).
dataset/cams-global-reanalysis-eac4?tab=overview, last ac-         The most recent data set was for 2016. For this study, the

https://doi.org/10.5194/acp-21-13931-2021                                        Atmos. Chem. Phys., 21, 13931–13971, 2021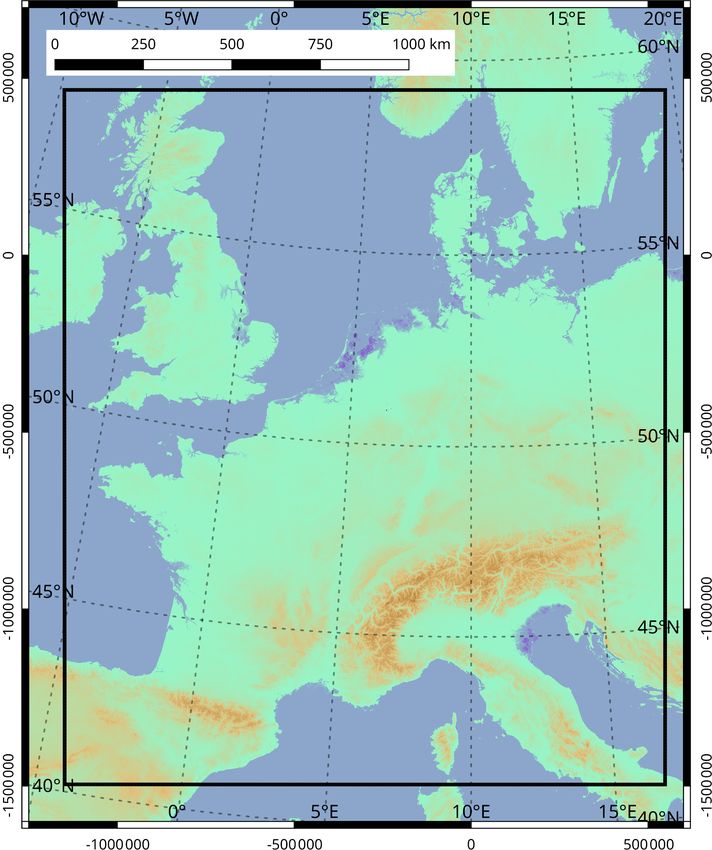
13934                           V. Matthias et al.: The role of emissions and meteorology during the COVID-19 lockdown

emission data were extrapolated to the year 2020 based on         cess: 16 September 2021). Using the time series data, a mean
the temporal emission development in previous years.              annual change rate for emissions (CE, in %) was derived for
   For the application in the CMAQ model the data were            each pollutant, sector and country separately. The projection
re-gridded and vertically and temporally redistributed. Addi-     of the 2016 emissions to the year 2020 was realized through a
tionally, in order to investigate the effects of lockdown mea-    projection factor PF = 1 + CE / 100 × (2020 − 2016). Using
sures on the emissions, sector- and country-specific temporal     a mean change rate based on the development of emissions
profiles of lockdown effects were applied. The data prepara-      within the 3 years 2017–2019 (method 1), PF could be very
tion was done with a modular toolbox for emission calcula-        large (more than 2) for some countries and sectors. This can
tion, the Highly Modular Emission MOdel (HiMEMO), cur-            result from large changes and fluctuating time series of the
rently developed at Helmholtz-Zentrum Hereon. The frame-          yearly emissions. In order to avoid very large and presum-
work is built in the R programming language, using the li-        ably erroneous emission changes between 2016 and 2020,
braries netcdf, proj4, sp, raster and their dependencies.         a maximum allowed annual change rate was introduced. If
   HiMEMO was run with gridded emission data from                 the CE was larger than 10 %, a modified CE was computed
the CAMS inventory for 2016 in a spatial resolution of            by considering the entire time series of annual emissions but
0.05◦ × 0.1◦ . The inventory contains gridded annual emis-        not more than 10 years (method 2). If there still was a CE
sions for chemical species groups, i.e. NOx , NMVOC, CO,          of more than 10 %, we limited it to a maximum change of
NH3 , CH4 , SO2 , PM2.5 and PM10 . Several of these chemical      ±10 %. Regarding the shipping sector, no changes were as-
groups need to be split into chemical components or sub-          sumed between the years 2016 and 2020.
groups of species according to the CB05 chemical mecha-
nism used by CMAQ. The NOx split was done by apply-               3.2     Lockdown effects, COV case
ing a NO / NO2 ratio of 90/10 for traffic, a ratio of 92/8 for
shipping and 95/5 for all other sectors. Land-based NMVOC         For the lockdown scenario, we adjusted national emis-
emissions were split for individual sectors according to a        sions from the following GNFR sectors: A_PublicPower,
split provided by the Netherlands Organisation for Applied        B_Industry, F_RoadTransport, G_Shipping and H_Aviation.
Scientific Research (TNO; Jeroen Kuenen, personal com-            Lockdown emission reduction functions, here called lock-
munication, 2020). PM was split as described by Bieser et         down adjustment factors (LAFs), were calculated based on
al. (2011a) for the SMOKE for Europe emission model. All          published data sources that resemble the effects of lockdown
other species in the CAMS-REGAP-EU inventory were di-             measures on a daily basis. LAFs were derived for 42 Eu-
rectly transferred to CMAQ.                                       ropean countries and two sea basins, the North Sea and the
   Vertical emission distributions per sector follow Bieser et    Baltic Sea.
al. (2011b). The vertical distribution for the shipping sector       The data sets used for the construction of the LAFs are de-
was treated differently for land and ocean-going ships, with      scribed in the following. If the input data were not available
the latter being emitted at altitudes up to 100 m. The temporal   for an individual country, data from a neighbouring country
profiles follow those provided by TNO (Denier van der Gon         were used to estimate the reduction. A table showing the data
et al., 2011, also described in Matthias et al., 2018).           availability per sector and country is given in Appendix A
   Biogenic emissions of VOCs (BVOCs) and NO were cal-            (Table A1). The LAFs are applied to all species, heights and
culated with the Model of Emissions of Gases and Aerosols         time steps of the anthropogenic emission data set for 2020.
from Nature (MEGAN) (Guenther et al., 2012). Version 3 of
MEGAN (Guenther et al., 2020) was used in this study; it          3.2.1    A_PublicPower and B_Industry
was driven by preprocessed meteorological data for CMAQ
as described above. Vegetation data tables were downloaded        Eurostat data (https://ec.europa.eu/eurostat/databrowser/
from the MEGAN website and not further modified for this          view/sts_inpr_m/default/bar?lang=en,         last      access:
study. Leaf area index (LAI) data were taken from GEOV1           16 September 2021) were used to account for changes
products (SPOT/PROBA V LAI1) as an alternative input for          in the sectors A_PublicPower and B_Industry. The energy
MEGAN3 (Baret et al., 2013).                                      data provided there comprise monthly information on the
   The annual emission data for 2016 were extrapolated to         volume index of production for electricity, gas, steam and air
2020 for each national emission sector according to the Grid-     conditioning supply. They are available for 35 countries in
ded Nomenclature For Reporting (GNFR) in order to pro-            Europe. The industry data comprise monthly information on
duce expected emissions for 2020 without lockdown effects.        the volume index of production for mining and quarrying;
The starting point was the time series data of yearly to-         manufacturing; electricity, gas, steam and air conditioning
tals for the pollutants BC, CO, NH3 , NMVOC, NOx , PM10 ,         supply; and construction and are available for 20 countries
PM2.5 and SO2 , which are provided by the EMEP cen-               in Europe. The indices are based on an index value of
tre on emission inventories and projections (EMEP/CEIP            2015. However, since we want to use them to evaluate the
2020 Present state of emission data; https://www.ceip.at/         lockdown period, we normalized the changes based on the
webdab-emission-database/reported-emissiondata, last ac-          January 2020 value. The data are given in a monthly resolu-

Atmos. Chem. Phys., 21, 13931–13971, 2021                                         https://doi.org/10.5194/acp-21-13931-2021
V. Matthias et al.: The role of emissions and meteorology during the COVID-19 lockdown                                    13935

tion; however, for many countries in Europe the lockdown          pean countries are available. The relative reductions in this
started in the middle of March. Therefore, a piecewise cubic      sector were most pronounced, reaching −90 % in March and
spline interpolation procedure was applied to derive daily        April and a slower recovery than the other sectors.
lockdown adjustment factors while still maintaining the
monthly values. Examples are given for both sectors in            3.2.5    Sector comparison
Germany in Fig. 2.
                                                                  LAFs for Germany, France, the UK and Sweden are exem-
3.2.2   F_RoadTransport                                           plarily shown in Fig. 4. Huge emission reductions in road
                                                                  traffic and air traffic between 10 and 20 March (day of the
Google mobility reports (https://www.google.com/covid19/          year (DOY) 70–80) can clearly be seen. Public power and
mobility/, last access: 16 September 2021) deliver daily per-     industry, on the other hand, show much smaller reductions
centage change of visits in different areas (e.g. residential,    (10 %–30 %) and almost reach previous-year levels until the
transit, recreation, work places). The reference value is the     end of June. At the same time in France and Germany, road
median of the corresponding weekday between 3 January and         traffic was back to 90 % of the previous year; however, in the
6 February 2020. We use Google mobility reports for transit       UK and in Sweden 20 %–40 % reductions were still visible
on a national level to account for the changes in road traffic    in the activity data. Comparisons of country-specific LAFs
emissions. Through this method, reduced traffic on national       for the sectors F_RoadTransport and H_Aviation are given
holidays, e.g. around Easter and 1 May, is considered as well;    in Appendix A (Figs. A1 and A2).
however, vehicle types cannot be distinguished.                      Figure 5 presents total daily NOx emissions in the entire
                                                                  central European domain (see Fig. 1) for the time period from
3.2.3   G_Shipping                                                1 January to 30 June 2020 for the COV and the noCOV case
To derive scaling factors that account for ship traffic and       separated by GNFR sectors. Road transport is the most im-
emission reductions in this sector, bottom-up ship emission       portant emission sector with approx. 20 % to 30 %, followed
inventories were created with the MOSES ship emission             by ocean shipping, other stationary combustion, industry and
model (Schwarzkopf et al., 2021) using automatic identifi-        public power, which all have similar contributions of approx.
cation system (AIS) data for 2019 and 2020 covering the           10 %. Combustion shows a clear decline towards the sum-
German Bight and the western Baltic Sea. The data were            mer months due to the fact that domestic heating is mainly
                                                                  necessary in winter.
recorded in Bremerhaven and Kiel by the German Federal
Maritime and Hydrographic Agency (BSH). A 7 d rolling                Reductions caused by the lockdown stem mostly from the
mean filter was applied to the calculated CO2 emission ra-        road transport sector, with a strong drop in emissions starting
tios (Fig. 3). On average, the data revealed a slight reduction   around DOY 75 (15 March). The aviation sector, which ex-
of ship traffic in the North Sea area by approx. 10 %. For the    perienced the strongest relative drop in emissions during the
Baltic Sea traffic reductions were clearly visible with a down-   lockdown, does not play a major role for the overall emission
                                                                  of NOx . However, it might be important near airports and
ward trend from March until the middle of June that could be
mainly attributed to roll-on/roll-off (RoRo) ships and passen-    in the upper troposphere. Overall, NOx emissions in central
ger ships. For the first 75 d of the year until 15 March 2020     Europe dropped by around 25 000 mol s−1 (approx. 4 kt h−1 ,
no reductions were applied; afterwards daily LAFs were used       when given as NO2 ) during the strictest lockdown period in
similar to the approach for road traffic. LAFs for the North      late March and early April. This corresponds to a relative
Sea were also applied for the Mediterranean Sea; those for        drop of around 30 % (Fig. 5).
the Baltic Sea were also applied to inland shipping. The rea-
soning behind this is that shipping in the Mediterranean is
mostly international cargo transport, similar to the North Sea,   4     Observational data
and inland navigation is connected to short-range transport,
similar to the Baltic Sea. As can be seen in Fig. 3, relative     We focus our analysis on the most important air pollutants
increases in shipping emissions might also occur during lim-      for human health, namely NO2 , O3 and PM2.5 . In this chap-
ited time.                                                        ter, first the meteorological situation between 1 January and
                                                                  30 June 2020 is analysed. Afterwards, observational air qual-
3.2.4   H_Aviation                                                ity data at six selected measurement stations within the EEA
                                                                  network (https://www.eionet.europa.eu/countries/index, last
Airport traffic total arrivals and departures data from           access: 16 September 2021) are presented and discussed.
Eurocontrol (https://ansperformance.eu/data, last access:
16 September 2021) were used to account for emission              4.1     Meteorological situation
changes in the aviation sector. We applied a reduction based
on a weekday mean from 3 January until 6 February 2020,           During the lockdown period in spring 2020 large parts of the
similar to Google mobility data. Daily values for 42 Euro-        region of interest experienced exceptional weather that is as-

https://doi.org/10.5194/acp-21-13931-2021                                        Atmos. Chem. Phys., 21, 13931–13971, 2021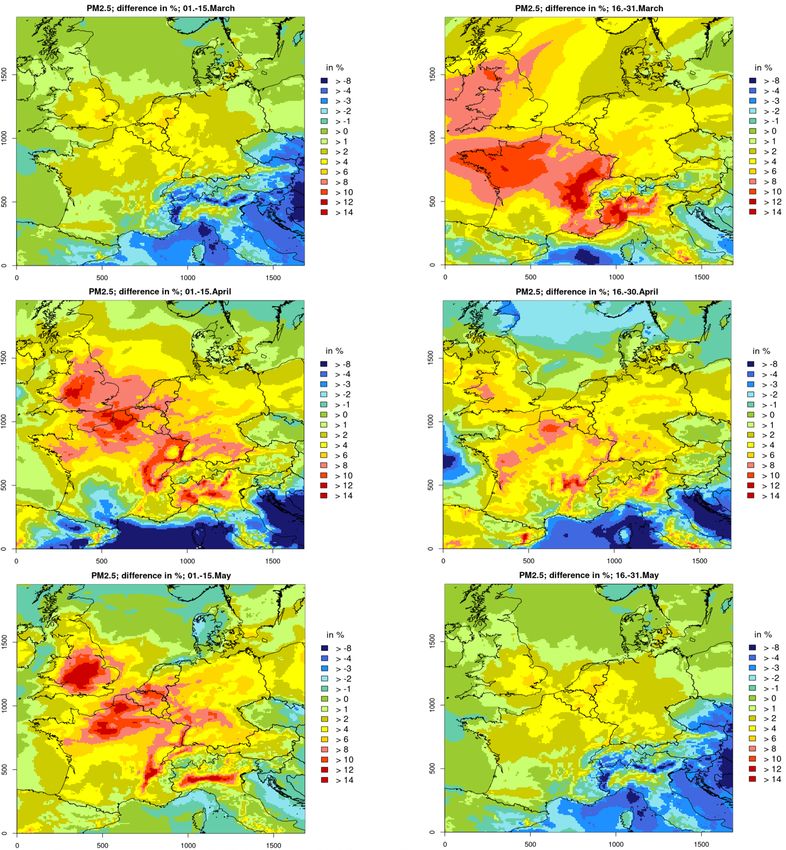
13936                            V. Matthias et al.: The role of emissions and meteorology during the COVID-19 lockdown

Figure 2. Examples for monthly values and interpolated functions for lockdown adjustment factors (in %) for the sectors A_PublicPower
and B_Industry in Germany.

                                                                     Werner (1993) has been chosen (see also Bissolli and
                                                                     Dittmann, 2001). This classification identifies predominant
                                                                     synoptic regimes over central Europe and defines 30 so-
                                                                     called “Großwetterlagen” (GWLs), which can be isolated by
                                                                     an objective method introduced by James (2007). The un-
                                                                     derlying data for this analysis were provided by the German
                                                                     Weather Service. The results of the GWL classification can
                                                                     be found in Table A2.

                                                                     4.1.1   Pre-lockdown period

                                                                     In February 2020, an unusually wet period occurred due
                                                                     to strong cyclonic activity in central Europe. Westerly and
                                                                     north-westerly cyclonic regimes were observed on 76 % of
                                                                     the days, whereas high-pressure-type regimes were observed
                                                                     on only 24 % of the days. Thus, the shortwave downwelling
                                                                     irradiance in February 2020 is one of the lowest measured
Figure 3. Lockdown adjustment factors created from the 7 d rolling   at the weather station Wettermast Hamburg (53◦ 310 0900 N
mean ratios of CO2 emissions from shipping in 2020 relative to       and 10◦ 060 1000 E) (https://wettermast.uni-hamburg.de, last
2019. Until day 75 (15 March) no changes and a LAF of 1 was          access: 5 July 2021) (Brümmer and Schultze, 2015) during
assumed.
                                                                     the last 25 years (Fig. A4), being representative for north-
                                                                     western Europe. The accumulated precipitation for Febru-
                                                                     ary at this weather station with an amount of more than
sumed to have a strong influence on concentrations of some           120 mm was exceptionally high compared to the last decades
of the pollutants in focus.                                          (Fig. A4).
   The weather conditions during the first half of the year
2020 show strong variations across the months and a dif-             4.1.2   Main lockdown period
ferent character in the northern part of our model domain
compared to more southern regions like the Po Valley. While          For the meteorological characterization of the main lock-
in the north February was extremely wet and windy (south-            down period between the middle of March and the end of
westerly direction), the second half of March and April were         April we rely in addition to the GWL analysis on maps of the
very dry and sunny. Thus for meteorological reasons a com-           500 hPa geopotential height and the surface pressure distri-
parison of pre-lockdown pollutant concentrations with those          bution. The underlying data were extracted from simulations
during the lockdown is fairly meaningless in assessing the ef-       with the COSMO–MERRA system, the same meteorologi-
fect of lockdown measures on the concentrations in the cen-          cal fields which have been used for the chemistry transport
tral and northern part of the region of interest.                    calculations with CMAQ displayed and discussed in the fol-
   To further analyse the weather regimes for the first half         lowing chapters. In Fig. 6 a subset of those maps for three
of 2020 the classification proposed by Gerstengarbe and              selected time periods is shown; the complete set of maps

Atmos. Chem. Phys., 21, 13931–13971, 2021                                            https://doi.org/10.5194/acp-21-13931-2021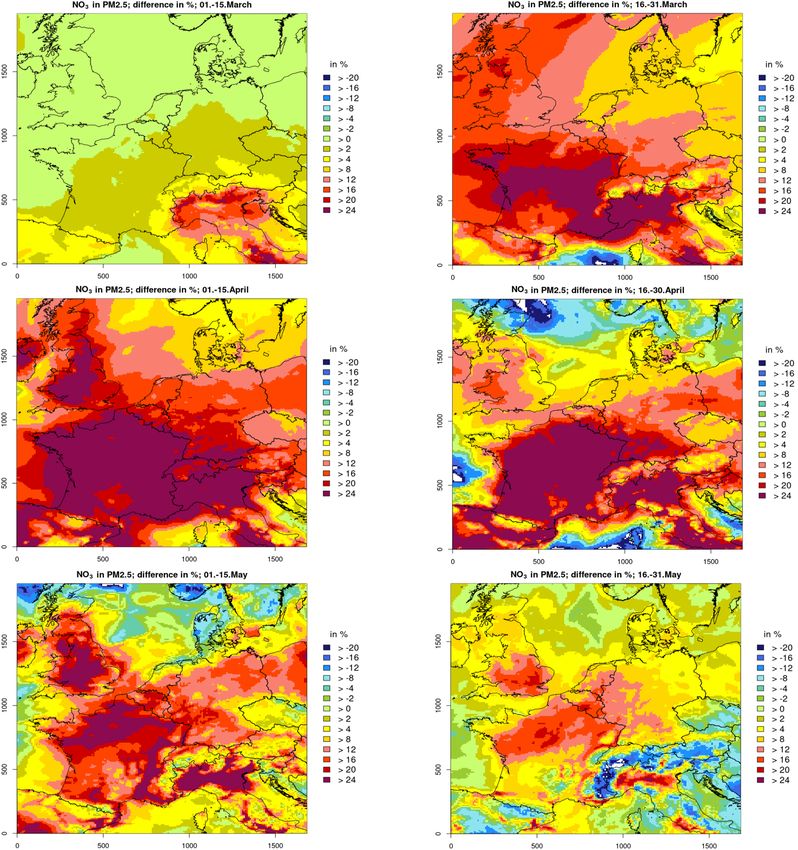
V. Matthias et al.: The role of emissions and meteorology during the COVID-19 lockdown                                    13937

Figure 4. LAFs for Germany (a), France (b), the United Kingdom (c) and Sweden (d) for the sectors A_PublicPower, B_Industry, F_
RoadTransport and H_Aviation.

generated can be found in Appendix A (Fig. A5). To charac-         transport from Asia and Northern Africa to the Po Valley was
terize and quantify horizontal advection, wind roses derived       reported (Collivignarelli et al., 2020).
from observations at the Wettermast Hamburg are displayed             In the first half of April the weather in the north-eastern
in Fig. 7. The wind data in each plot cover a time period of       part of central Europe was again quite variable, and in south-
about 15 d. Measurements at an altitude of 110 m were cho-         ern Europe the cut-off from the northern regime could still be
sen to better represent a larger area and eliminate parts of the   recognized. In the western part of central Europe a ridge has
surface influences on the wind.                                    established, which stretched towards the UK. Accordingly,
   In the middle of March, the synoptic regime substan-            winds in northern Germany blew predominantly from west-
tially changed over Europe. High-pressure-type GWLs be-            erly/north westerly directions. Later on, a ridge over all of
came dominant; i.e. high ridges over central Europe and            central Europe dominated the weather in the study domain
high-pressure systems led to a typical atmospheric block-          (Fig. 6, middle), only the eastern Mediterranean was still in-
ing of cyclones. The weather situation shows first a vary-         fluenced by a cut-off trough. In the Po Valley, according to
ing blocking in northern and central Europe followed by a          measurements around Milan, the weather during the second
high-pressure ridge reaching from the Azores to Scandinavia        half of March to 10 April was dry and very sunny with low to
(Fig. 6, left), which changed to a high-pressure ridge stretch-    medium wind speeds (Collivignarelli et al., 2020). Towards
ing from Iceland into Russia. In northern Germany the wind         the middle of April a high-pressure bridge was established
regime was dominated by a flow with mainly easterly compo-         reaching from Iceland into eastern Europe.
nents, which were relatively high wind speeds (Fig. 7, left).         In the second half of April a high-pressure system estab-
In southern Europe the situation, which was similar at the be-     lished over the British Isles attached to a ridge located over
ginning of the period to that one in the north, with changes       central Europe leading to dry and sunny weather all over Eu-
starting on about 23 March, an isolated trough formed, lead-       rope. This condition was basically stable until 25 April, when
ing to low-pressure system activity. For 28 and 29 March dust      a cyclonic flow took over, leading to more westerly winds
                                                                   over central Europe, a situation which lasted until the first

https://doi.org/10.5194/acp-21-13931-2021                                        Atmos. Chem. Phys., 21, 13931–13971, 2021
13938                           V. Matthias et al.: The role of emissions and meteorology during the COVID-19 lockdown

Figure 5. Daily average values for sector separated NOx emissions summarized over the entire central European model domain for the
noCOV and the COV case (with LAF).

days of May. Winds in northern Germany switched over from          4.1.3   Lockdown transition
easterly to more westerly directions this time (Fig. 7, right).
   Overall, an exceptionally dry period occurred which             In May 2020, atmospheric conditions were very different in
started in the early lockdown period and continued until the       central Europe compared to the previous months. For in-
end of April. The weather was characterized by very low            stance, Germany was dominated by large amounts of rain in
cloud cover and record-breaking large amounts of solar irra-       the south, sunny conditions in the west, and dry but cloudy
diance (see the record at the Wettermast Hamburg in Fig. A4)       conditions in the east and north. Observed sunshine duration
and little precipitation. This exceptional weather period is       and solar irradiance corresponds approximately to average
also discussed by van Heerwaarden et al. (2021), who re-           climatic conditions. In contrast, large parts of western Europe
ported record breaking solar irradiation for the Netherlands.      (the Netherlands, Belgium, West Germany, the UK) experi-
                                                                   enced sunny and dry weather throughout the entire month of

Atmos. Chem. Phys., 21, 13931–13971, 2021                                          https://doi.org/10.5194/acp-21-13931-2021
V. Matthias et al.: The role of emissions and meteorology during the COVID-19 lockdown                                                  13939

Figure 6. 500 hPa geopotential heights (in geopotential decametres, gpdm) and surface pressure (in hPa) for selected time segments in
March and April 2020 according to the COSMO simulations. The geopotential heights are averaged over 4 d (21–24 March, 6–9 April and
21–24 April from left to right, respectively). Displayed surface pressure distributions are representative snapshots within those time segments.

Figure 7. Wind roses derived from measurements of the weather station Wettermast Hamburg at an altitude of 110 m. Results for three
periods covering about 15 d each are shown: 16–31 March 2020, 1–15 April 2020 and 16–30 April 2020, from left to right.

May (van Heerwaarden et al., 2021). Finally, the large-scale              in the behaviour and nature of concentration, time series ob-
conditions in June turned out to favour long-lasting periods              servations at selected air quality measurement stations have
with dry and sunny weather conditions in northern Germany                 been examined. The analysed stations have been selected in
due to blocking conditions caused by high-pressure systems                a way that they are geographically distributed over the study
located over Scandinavia. However, the more southerly re-                 domain and represent different emission characteristics. The
gions were rather too wet in a climatological sense.                      stations Radhuset in Malmö, Sweden, and Sternschanze in
                                                                          Hamburg, Germany, are classified as urban background sta-
4.2   Concentrations of NO2 , O3 and PM2.5                                tions, not directly influenced by traffic. Waldhof is a rural
                                                                          background station in northern Germany located about 60 km
The reduced emissions of pollutants during the lockdown pe-               north of the city of Hanover. Vredepeel is a background sta-
riods should lead to changes in ambient concentrations of                 tion in a fairly populated part of the Netherlands situated
those substances and related secondary pollutants as ozone.               in the triangle between the cities Nijmegen, Eindhoven and
Beside regional emissions advected pollutants and the mete-               Venlo. The observatory Košetice in the Czech Republic is lo-
orological conditions also determine local and regional con-              cated in the Moravian Highlands in an agricultural country-
centrations. To assess changes in air quality and alterations

https://doi.org/10.5194/acp-21-13931-2021                                                 Atmos. Chem. Phys., 21, 13931–13971, 2021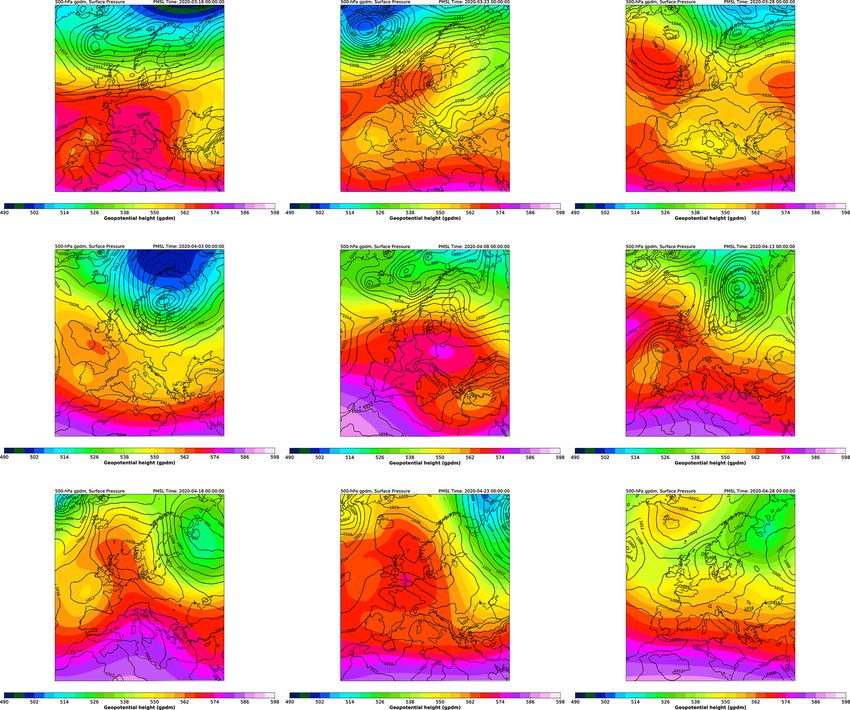
13940                           V. Matthias et al.: The role of emissions and meteorology during the COVID-19 lockdown

side about 80 km from the south-east of Prague. To represent       trations appear in winter, only, when emissions are high and
a region south of the Alps the Italian station San Rocco in        atmospheric mixing is suppressed, e.g. during high-pressure
the Po Valley about 30 km east of Parma has been selected.         situations with advection of cold air. Similar to the NO2 con-
With the exception of Košetice, having an elevation of about       centrations, rainy and windy weather in February 2020 leads
530 m, the stations are situated below an altitude of 80 m. To     to low PM2.5 concentrations at all stations.
allow a comparison of the concentration measurements un-
der different meteorological influences, time series of NO2 ,      4.3    Model results at measurement stations
O3 and PM2.5 for the years 2015 to 2020 have been exam-
ined. However, PM2.5 was not available at the station San          In order to judge the quality of the model results, simulated
Rocco.                                                             concentrations were compared to observations at selected
   The observational results for the selected stations for NO2 ,   stations, including some of those presented above. Figure 9
O3 and PM2.5 are displayed in Fig. 8. For NO2 , at all sta-        exemplarily shows the comparison at Vredepeel, and Table 1
tions, with the exception of Waldhof, an obvious trend from        contains statistical values for NO2 and O3 at 11 stations and
higher concentrations in the winter months to lower ones in        for PM2.5 at 4 stations in Europe.
spring in early summer can be seen. At Waldhof this trend             Modelled NO2 concentrations are typically lower than the
is not that clear due to lower values in January for most of       observed values; in particular, the model shows a stronger
the years. As it can be expected, in urban (Malmö and Ham-         downward trend of the concentrations in spring than ob-
burg) or densely populated (Vredepeel and San Rocco) re-           served. This pattern is reversed for ozone, where the mod-
gions the NO2 concentrations are on a higher level. At most        elled 8 h max concentrations are typically too high, with bet-
stations the NO2 concentrations for March 2020, the month          ter agreement in spring compared to winter. PM2.5 is under-
during which in all countries the lockdown measures started,       estimated on average, but only at two out of four stations.
are among the lowest ones compared to the previous years.          Here, the agreement is typically better in winter compared to
For Hamburg, Vredepeel and Košetice this also holds for the        spring. As average for all selected stations, the model bias
months April to June. An obvious feature, which appears at         for NO2 is −17 %, for O3 it is +21 % and for PM2.5 it is
all stations except San Rocco, is that the February concen-        −5 %. The temporal correlation (R 2 ) based on daily mean
trations in 2020 are lower compared to the previous years,         values varies between 0.42 and 0.74 for NO2 , between 0.07
although no lockdown measures were taken in Europe in              and 0.75 for O3 , and between 0.21 and 0.62 for PM2.5 . De-
February. Presumably, meteorological conditions are respon-        tails are given in Table 1.
sible for these relatively low NO2 concentrations. February
2020 was a month with steady westerly winds and longer
periods of intense precipitation in northern Europe. While
strong winds cause rapid dilution of pollutants, steady pre-
                                                                   5     COVID-19 lockdown effects
cipitation has a cleaning effect due to dissolution of pollu-
tants in cloud and rainwater and subsequent washout.
   For O3 , at all stations and for all years the typical trend    Effects of the lockdown measures on emissions were dis-
from low winter concentrations to higher concentrations in         cussed in Sect. 3. Now, CMAQ model results are evaluated
spring and early summer can be seen. During the lockdown           for the COV and the noCOV case during the lockdown phase.
month April the O3 concentrations for the years 2018, 2019         Meteorological impacts are discussed through comparisons
and 2020 were higher than in the previous years. During            of CMAQ model results that were derived with meteorologi-
those years the radiation was rather intense in April, which       cal data for the years 2016 and 2018.
favours the photochemical formation of ozone. At the rural
stations Waldhof and Košetice ozone concentrations in May          5.1    CMAQ results for central Europe
and June 2020 were lower than in previous years. At the ur-
ban stations in Malmö and Hamburg the relative increase in         Differences between the CMAQ results for 2020 for the COV
O3 concentrations over the 6-month period is lower com-            and the noCOV case reveal the impact of the lockdown emis-
pared to the more rural stations. This can be interpreted as       sion reductions on air pollutant concentrations. The magni-
a titration effect of O3 by reactions with NO, which has sig-      tude of the concentration changes varies considerably in time
nificant sources in urban areas. In general, the observations      and space. Here, we focus our evaluation on the period with
of O3 maxima do not provide any indication of significant          the highest emission reductions between 16 and 31 March
effects related to lockdown emission changes in 2020.              2020. During this time the most widely spread and tempo-
   PM2.5 concentrations also show no clear signal that would       rally stable emission reductions took place in Europe. Dif-
allow us to relate concentrations to lockdown emission re-         ferences among weekdays and weekends and, to a limited
ductions. Slightly higher concentrations and variability can       extent, also among different weather situations are averaged
be observed in winter compared to summer at all stations.          out by investigating a half-month period. However, changing
This can be related to the fact that very high PM concen-          effects over time are also discussed.

Atmos. Chem. Phys., 21, 13931–13971, 2021                                          https://doi.org/10.5194/acp-21-13931-2021
V. Matthias et al.: The role of emissions and meteorology during the COVID-19 lockdown 13941 Figure 8. https://doi.org/10.5194/acp-21-13931-2021 Atmos. Chem. Phys., 21, 13931–13971, 2021
13942 V. Matthias et al.: The role of emissions and meteorology during the COVID-19 lockdown
Figure 8. Observed monthly concentrations of NO2 , O3 and PM2.5 at Waldhof (Germany), Vredepeel (the Netherlands), San Rocco (Italy),
Košetice (Czech Republic), Malmö (Sweden) and Hamburg (Germany). The median is displayed within the central boxes which span from
the 25th percentile to the 75th percentile, called the interquartile range of the underlying frequency distributions. For NO2 and PM2.5 these
distributions are based on hourly measurements at the different stations and for O3 on daily 8 h maximum values. The whiskers above and
below the central boxes indicate the largest and the smallest value within 1.5 times the interquartile range, respectively. Dots denote values
outside these ranges. PM2.5 was not available at San Rocco.
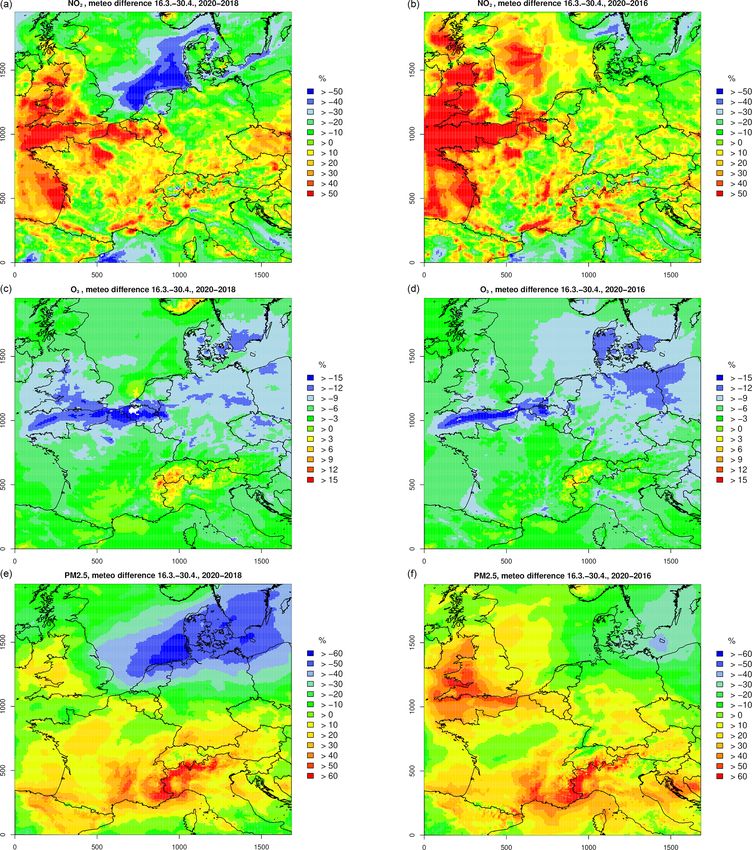
5.1.1 NO2 concentrations gium and Italy, as it was seen for the second half of March.
Maps for relative reductions due to the lockdown for six half-
month periods between 1 March and 31 May 2020 are given
Figure 10 shows maps of the modelled average NO2 concen-
in Appendix A (Fig. A6).
trations in central Europe between 16 and 31 March for the
case without lockdown measures (noCOV) together with the
absolute and relative concentration reductions caused by the 5.1.2 O3 concentrations
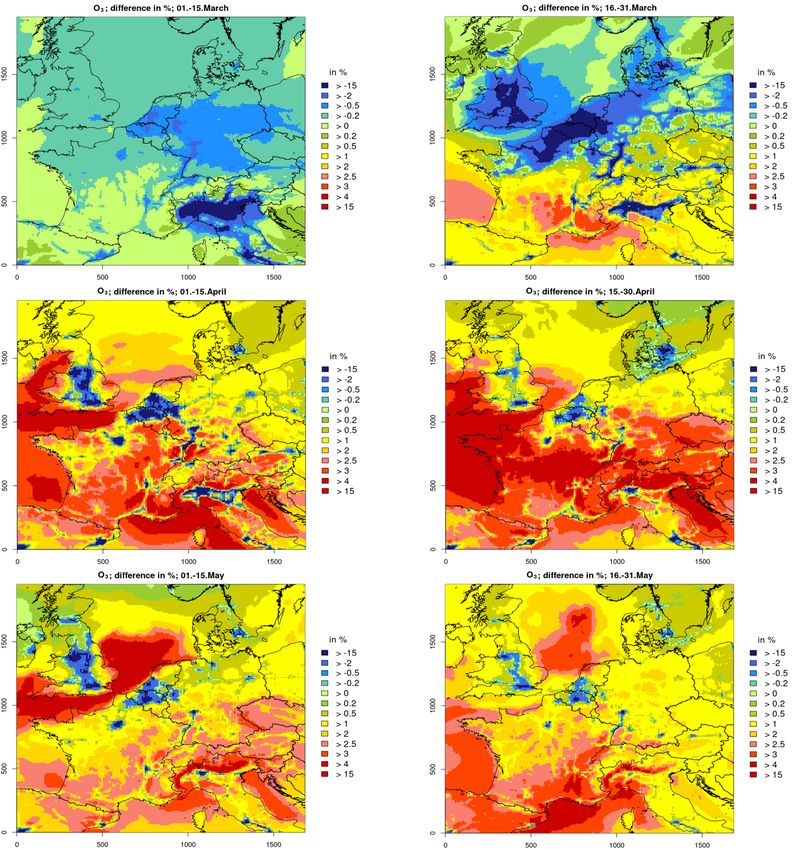
lockdown. The NO2 concentrations for the noCOV case in
central Europe show the typical pattern with highest concen- It can be expected that reduced NOx emissions are also re-
trations in densely populated areas like England, Belgium, flected in modified O3 concentrations with lower values in
the Netherlands, and western Germany as well as northern all regions that are NOx -limited. However, for the second
Italy (Fig. 10a). Average concentrations range between 5 and half of March increased O3 concentrations between 1 and
10 µg m−3 . Reductions in NO2 concentrations caused by the 8 µg m−3 were modelled in the COV case for northern cen-
lockdown are highest in the same regions, also reaching sev- tral Europe and the Po Valley (Fig. 11). Because these are the
eral µg m−3 . Relative reductions are highest in France, Bel- regions with the highest NOx emissions in Europe, they were
gium, Italy and Austria, reaching more than 40 % on aver- most likely VOC-limited during this first lockdown period,
age. Germany, the Netherlands, the UK, southern Sweden and O3 titration with NO was reduced when NOx emissions
and the Czech Republic show lower reductions between 15 % were reduced. Most of the southern parts of the modelling
and 30 %. In the following weeks, NO2 concentrations stayed domain exhibited a decrease in ozone of 1–2 µg m−3 on aver-
more or less on the same level in most parts of Europe, but the age caused by the lockdown and the reduced NOx emissions.
lockdown effects decreased slightly as it could be expected In the following weeks, areas with increased ozone turned
from the emission changes. Overall, relative concentration smaller week by week and were limited to large cities and
reductions were most significant in England, France, Bel- the most densely populated areas; see Fig. 12 for the first
Atmos. Chem. Phys., 21, 13931–13971, 2021 https://doi.org/10.5194/acp-21-13931-2021V. Matthias et al.: The role of emissions and meteorology during the COVID-19 lockdown 13943 Figure 9. Comparison between model results (green) and observations (red) at Vredepeel, the Netherlands. (a) NO2 , (b) O3 and (c) PM2.5 . All concentrations are given in µg m−3 ; box plots show medians, 25 % and 75 % quartiles, and whiskers representing 1.5 times the interquar- tile range. Values that fall outside the range of the whiskers are given as dots. https://doi.org/10.5194/acp-21-13931-2021 Atmos. Chem. Phys., 21, 13931–13971, 2021
13944                          V. Matthias et al.: The role of emissions and meteorology during the COVID-19 lockdown

Table 1. Statistical evaluation of a comparison between observations of NO2 at selected background stations of the EEA network with
CMAQ model results between 1 January and 30 June 2020.

                            Station               Observed      Modelled             Bias   Correlation
                                                  (µg m−3 )   (COV case)      (model–obs)
                                                                (µg m−3 )       (µg m−3 )
                            NO2 concentrations 1 January–30 June 2020
                            Risoe, DK                   4.7             5.7          1.0          0.46
                            Waldhof, DE                 5.0             3.8         −1.2          0.63
                            Zingst, DE                  4.4             2.9         −1.5          0.63
                            Neuglobsow, DE              2.9             2.6         −0.3          0.66
                            Vredepeel, NL              12.4            10.2         −2.2          0.64
                            De Zilk, NL                11.4            12.8          1.4          0.51
                            Košetice, CZ                3.4             3.0         −0.3          0.42
                            San Rocco, IT              13.5             9.2         −4.3          0.74
                            Besenzone, IT              15.8            11.9         −3.9          0.71
                            Casirate d’Adda, IT        19.4            15.9         −3.5          0.71
                            Paray-le-Frésil, FR         3.1             2.1         −1.0          0.54
                            O3 concentrations 1 January–30 June 2020
                            Risoe, DK                  71.2            75.7           4.5         0.07
                            Waldhof, DE                63.6            74.5          10.9         0.25
                            Zingst, DE                 70.6            79.7           9.1         0.23
                            Neuglobsow, DE             62.8            74.8          12.0         0.16
                            Vredepeel, NL              56.8            70.5          13.7         0.55
                            De Zilk, NL                63.1            70.6           7.5         0.34
                            Košetice, CZ               70.0            78.6           8.6         0.21
                            San Rocco, IT              54.7            73.4          18.7         0.68
                            Besenzone, IT              49.5            69.3          19.8         0.59
                            Casirate d’Adda, IT        56.3            74.0          17.7         0.75
                            Paray-le-Frésil, FR        58.6            77.2          18.6         0.43
                            PM2.5 concentrations 1 January–30 June 2020
                            Waldhof, DE                 6.8             7.3          0.5          0.21
                            Vredepeel, NL              10.6             9.2         −1.4          0.57
                            De Zilk, NL                 6.8             7.8          1.0          0.44
                            Košetice, CZ                9.3             7.8         −1.5          0.62

half of April and the first half of May. Most regions in Eu-        tion decreases were most significant in France and northern
rope turned into NOx -limited areas in spring 2020, resulting       Italy with values up to 20 %, while in the rest of the do-
in lower ozone concentrations of 1–2 µg m−3 (about 2 %–4 %          main 6 %–10 % lower PM2.5 was simulated. In the follow-
change) caused by the emission changes during the lockdown          ing weeks, PM2.5 concentrations were typically reduced by
(Fig. A7).                                                          10 %–20 % because of the lockdown measures in most parts
                                                                    of central Europe. Somewhat lower values were found in the
5.1.3   PM2.5 concentrations                                        northern and southern parts of the domain. The reduction in
                                                                    PM2.5 concentrations decreased to 6 %–12 % in the second
Simulated PM2.5 concentrations in the second half of March          half of May (see Fig. A8).
2020 for the noCOV case show relatively high concentra-                An investigation of the chemical components of the mod-
tions between 12 and 15 µg m−3 in large parts of central Eu-        elled PM2.5 concentrations for the noCOV case reveals that
rope and the Po Valley, while the UK, Denmark and north-            about two-thirds consists of the inorganic components nitrate
ern Germany exhibited concentrations below 10 µg m−3 (see           (NO−                 −                      +
                                                                         3 ), sulfate (SO4 ) and ammonium (NH4 ). The lockdown
Fig. 13, top). The lockdown emission reductions lead to con-        measures caused large reductions in NOx emissions. Conse-
centration reductions between 1 and 3 µg m−3 in those re-           quently, nitrate was reduced by more than 24 % in large parts
gions with higher concentrations and values below 1 µg m−3          of France and northern Italy between the middle of March
in the north-western part of the domain. Relative concentra-        and the end of April; see Fig. A9 in Appendix A. The re-

Atmos. Chem. Phys., 21, 13931–13971, 2021                                            https://doi.org/10.5194/acp-21-13931-2021
V. Matthias et al.: The role of emissions and meteorology during the COVID-19 lockdown 13945 Figure 10. CMAQ results for NO2 concentrations in central Eu- Figure 11. CMAQ results for O3 concentrations in central Europe rope between 16 and 31 March 2020. (a) Concentrations without between 16 and 31 March 2020. (a) Concentrations without lock- lockdown measures (noCOV run). (b) Absolute concentration re- down measures (noCOV run). (b) Absolute concentration reduc- ductions due to lockdown measures (noCOV – COV run). (c) Rel- tions due to lockdown measures (noCOV – COV run); positive val- ative concentration reductions due to lockdown measures (noCOV ues denote high reductions. (c) Relative concentration reductions – COV run). Positive values for absolute and relative differences due to lockdown measures (noCOV – COV run); positive values denote high reductions. denote reductions, and negative values denote increases. https://doi.org/10.5194/acp-21-13931-2021 Atmos. Chem. Phys., 21, 13931–13971, 2021
13946                          V. Matthias et al.: The role of emissions and meteorology during the COVID-19 lockdown

Figure 12. CMAQ results for changes in O3 concentrations due to lockdown measures in central Europe between 1 and 15 April 2020 (a)
and 16–31 May 2020 (b). Positive values denote concentration reductions, and negative values denote concentration increases.

duction was usually somewhat lower in other parts of the            where NOx emission reductions lead to decreased O3 titra-
domain. Particulate nitrate is mostly bound to ammonium;            tion. This pattern changes towards the end of April, and in
however, the model results show a lower relative reduction of       the following O3 is decreased on most of the days at all sta-
the ammonium concentrations compared to nitrate. It is only         tions as a consequence of lower NOx emissions. This effect
on the order of 8 %–20 % at maximum (Fig. A10). This is             remains variable at Vredepeel, a station close to the region
because ammonium is preferably bound to sulfate in atmo-            with highest NOx emissions in Europe. At Waldhof, O3 re-
spheric aerosols, and sulfate concentrations even increased         ductions are observed between the beginning of April and
by a few percent as a consequence of the lockdown mea-              the end of June. On average, between 16 March and 30 June,
sures (Fig. A11). This can be explained by the large reduc-         O3 is only decreased by 0.6 µg m−3 (< 1 %) at Vredepeel.
tion in the formation of particulate nitrate in the COV case.       At Waldhof and San Rocco, the reductions are 1.2 µg m−3
Less nitrate means less ammonium which is then available            (1.6 %) and 1.5 µg m−3 (1.9 %), respectively.
as gaseous ammonia. This may lead to the formation of ad-
ditional ammonium sulfate in areas where gaseous sulfuric           5.2   Impact of meteorological conditions
acid is available.
                                                                    For investigating the effects of the exceptional meteorolog-
5.1.4   Temporal development of concentration changes               ical situation on the concentration reductions in March and
                                                                    April 2020, additional CMAQ model simulations were per-
The detailed temporal development of the effect of lockdown         formed. Meteorological data simulated with COSMO-CLM
emission reductions on atmospheric concentrations of NO2 ,          for the first 6 months in 2016 and 2018 were used as input
O3 and PM2.5 is followed at selected measurement stations.          data, together with the 2020 emissions for both the COV and
Figure 14 shows the modelled differences between the no-            the noCOV case. Biogenic emissions were also kept the same
COV and the COV model runs at Waldhof, Vredepeel and                for the 2016 and 2018 runs in order to investigate effects of
San Rocco. Lockdown emission reductions lead to reduced             meteorological conditions only. These additional years were
concentrations of NO2 and PM2.5 at all stations; however,           selected to cover a span of weather situations during the lock-
the amount varies considerably in time and by station. At           down phase. The selected years were different but do not
Waldhof, only very small changes are simulated. At Vrede-           represent in any sense an extreme situation. They were cho-
peel, NO2 is significantly reduced (by more than 10 µg m−3          sen from the time span 2015 to 2019, since for these years
on individual days), and PM2.5 shows only small reductions.         model data generated using the same advanced model set-
At San Rocco, both NO2 and PM2.5 are reduced by several             tings (model version and reanalysis data) are available. The
µg m−3 until the end of April. In May and June, lockdown            results show the concentration and the changes caused by the
effects on the concentrations get much smaller, also at Vre-        lockdown measures as they would have happened under dif-
depeel and San Rocco.                                               ferent meteorological conditions.
   O3 shows higher values despite the emission reductions              Figure 15, top, shows the NO2 concentration changes
until the middle of April at Vredepeel and San Rocco. This is       for 2020 relative to 2018 and 2016 caused by meteorolog-
because these stations are in VOC-limited areas at that time,       ical conditions, only, for the period between 16 March and

Atmos. Chem. Phys., 21, 13931–13971, 2021                                           https://doi.org/10.5194/acp-21-13931-2021
V. Matthias et al.: The role of emissions and meteorology during the COVID-19 lockdown 13947
30 April. No emission changes because of the lockdown
were assumed for this investigation. Meteorological condi-
tions in 2020 caused between 20 % and more than 30 % lower
NO2 concentrations in large areas of the north-eastern model
domain (the Netherlands, northern Germany, Denmark and
southern Sweden) compared to 2018, even without any lock-
down measures. On the other hand, in the western UK, Bel-
gium, northern France and the Czech Republic, meteorologi-
cal conditions led to 20 % to more than 30 % higher NO2 con-
centrations. The picture is similar when compared to 2016,
in particular in the western part of the model domain, but
the area with lower NO2 concentrations in 2020 compared to
2016 does not include the North Sea and Denmark.
Average ozone concentrations between 16 March and
30 April 2020 were relatively low in almost all of central
Europe when compared to a situation with meteorological
conditions as in 2018 and 2016 (see Fig. 15, middle). Dif-
ferences are on the order of 10 %–15 % in the northern part
of the model domain and between 2 % and 6 % in the south-
ern part. Only in few spots in northern Italy and southern
Switzerland, the meteorological situation in 2020 favoured
ozone formation compared to 2016 and 2018.
The picture is more mixed for PM2.5 , with considerably
lower concentrations in 2020 compared to 2016 and 2018,
particularly in northern Germany and Poland, i.e. in the
north-eastern part of the domain (Fig. 15, bottom). Relative
differences reach more than 50 % between 2020 and 2018
in the German Bight. Compared to 2018, PM2.5 concentra-
tions were also low in the western UK in 2020. In almost all
of France and in northern Italy, PM2.5 concentrations were
relatively high in 2020 compared to 2016 and 2018, and dif-
ferences again reach more than 50 % but with opposite sign.
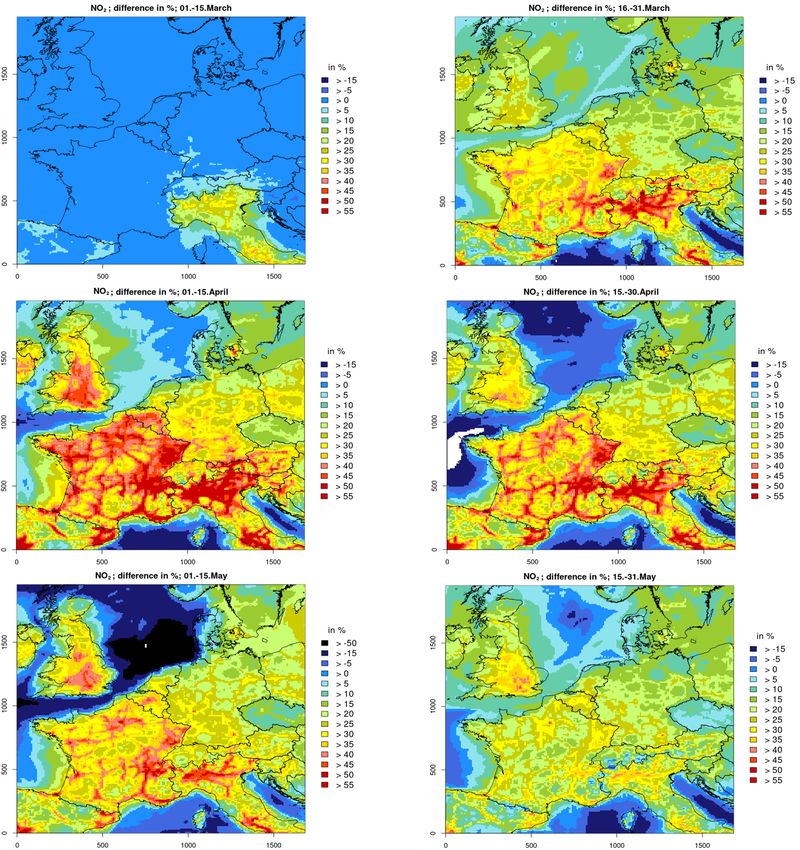
The meteorological situation also affects the concentration
changes caused by the lockdown, but this differs consider-
ably among the pollutants. Figure 16 shows the lockdown
emission reduction effects on the average concentrations for
the main lockdown period from 16 March to 30 April. In
most parts of central Europe the variation for NO2 is rather
small (plus/minus approx. 5 %). For ozone, on the other
hand, effects of the lockdown are quite different among the
three selected meteorological years. For 2020 meteorologi-
cal conditions, relatively large areas in northern central Eu-
rope show a slight increase in ozone (green and blue areas in
Fig. 16, middle row). These areas would have been smaller
with 2016 meteorological conditions and limited to the most
densely populated areas for 2018 meteorological conditions.
Lockdown effects on PM2.5 would have been more signifi-
cant under meteorological conditions of the years 2016 and
Figure 13. CMAQ results for PM2.5 concentrations in central Eu- 2018 in almost the entire model domain (Fig. 16, bottom
rope between 16 and 31 March 2020. (a) Concentrations without row). Particularly in northern Italy and south-eastern France,
lockdown measures (noCOV run). (b) Absolute concentration re- changes in PM2.5 caused by the lockdown could be more than
ductions due to lockdown measures (noCOV – COV run); positive 10 %, a value that was rarely reached during the real lock-
values denote reductions. (c) Relative concentration reductions due down in 2020.
to lockdown measures (noCOV – COV run); positive values denote
reductions.
https://doi.org/10.5194/acp-21-13931-2021 Atmos. Chem. Phys., 21, 13931–13971, 2021You can also read