Evaluation of development of Apple Inc. stock price time series
←
→
Page content transcription
If your browser does not render page correctly, please read the page content below
SHS Web of Conferences 132, 01012 (2022)                                 https://doi.org/10.1051/shsconf/202213201012
IES2021

      Evaluation of development of Apple Inc. stock
      price time series
      Jakub Horák1*, and Dominik Kaisler1
      1
        Institute of Technology and Business in České Budějovice, School of Expertness and Valuation,
      Okružní 517/10, 370 01 České Budějovice, Czech Republic

                      Abstract. The paper deals with the the development of a specific company´s
                      stock price time series. The aim of the paper is to use the time series method
                      for a detailed analysis and evaluation of the development of Apple Inc. stock
                      prices. Daily data from 2000 to 2020, daily data from the period of the
                      economic crisis between 2007 and 2009 and daily data from the Covid-19
                      pandemic period from March 2020 to the end of the same year are used. The
                      data, from the period of 2000 - 2020 show a gradual increase in Apple's stock
                      prices. The most common factor leading to the increase in stock prices is the
                      launch of a new product or service on the global market. On the contrary, the
                      reason for the decline in stock prices is customer dissatisfaction, the excess
                      of demand over supply, or the political situation. The analysis of time series
                      for the period of the economic crisis points to the fact that thanks to the
                      development, innovation and constant introduction of new products into the
                      market, the company was not significantly affected by the crisis and neither
                      were stock prices. Naturally, there were some fluctuations in prices, but at
                      the end of 2009, the company even reached the highest stock prices in its
                      history to date. . The analysis of time series during the global pandemic of
                      Covid-19 shows a steady rise in stock prices. Currently, the company sells
                      more and more products and introduces new services that help us work, study
                      or entertain ourselves in these difficult times, in the safety of our homes.
                      Keywords: Apple Inc., stock price, stock price development, time series,
                      investing
                      JEL codes: C22, B26

      1 Introduction
      Investing in traditional investment institutions, such as banks, is no longer attractive to investors
      due to the low return on investment [1, 2]. The stock market is now one of the most important
      components of the financial system [3]. Investing in stocks is becoming more and more popular
      for the society today. The desire to multiply one's funds in a relatively short period of time and
      achieve often above-average returns attracts almost all of us. In turn, companies that offer stocks
      receive funding for their own development. However, it is often a long haul, and it can take
      several decades for the money invested to recover. In some cases, the capital invested does not

      *
          Author’s contact information: horak@mail.vstecb.cz

© The Authors, published by EDP Sciences. This is an open access article distributed under the terms of the Creative Commons
Attribution License 4.0 (http://creativecommons.org/licenses/by/4.0/).
SHS Web of Conferences 132, 01012 (2022) https://doi.org/10.1051/shsconf/202213201012
IES2021
result in a profit at all but in a loss. Therefore, each step needs to be carefully considered and
the purchase of stocks must be carried out with due consideration.
Any investor entering the financial market wishes to be able to predict how many stocks
to buy and when. However, the number of stocks depends also on the value of the investor's
assets. The next important step for the subsequent valuation of the funds invested is a proper
analysis and evaluation of the historical development of stock prices and the company whose
stocks we want to buy. This includes its turnover, bringing new products to market or its
overall economic situation. There are many factors that affect the subsequent increase or
decrease in value. If we successfully predict the development of a company's stock price, the
future price could yield a significant profit [4]. This feeling and the ability to predict correctly
distinguishes successful investors from the unsuccessful ones.
Interest in stocks actually determines their value. Stock price develops on the basis of
supply and demand. As with any commodity on the market, the higher the demand for stock
and the lower the supply, the higher its price is. Supply and demand change depending on
various factors; therefore, stock price also changes over time. These factors can be predicted
and evaluated using several methods and data approaches. One of the most conclusive
statistical methods to examine the dynamics and development over time are the so-called
time series. Time series of stock price developments are crucial for assessing the factors that
influenced stock price developments and determined their performance in the past, as well as
for predicting their future development.
The objective of the article is to analyse and evaluate the historical development of Apple
Inc.'s stock prices on the basis of secondary data in the years 2000 - 2020, and to determine
in what time horizon, on what occasion, or as a result of what circumstances on the financial
market, the company's stocks reach the highest and the lowest prices.
In order to achieve the set objective, the following research questions are formulated:
1. What factors influenced Apple Inc.'s share prices in the years 2000 - 2020?
2. How did the COVID-19 pandemic affect Apple Inc. stock prices?
3. What was the development of Apple Inc. stock prices during the 2007-2009 economic
crisis?
2 Literature research
Apple Inc. is one of the best-known and richest companies in the world. As a result of its
phenomenal success, the value of Apple´s liquid assets at the end of fiscal year 2012 was $121
billion. In April 2013, the company committed to distribute up to $100 billion to shareholders
through stock buybacks and cash dividends until the end of calendar year 2015 [5].
Precisely because Apple Inc. is active in the financial market, the company must have
well-established financial management and decision support system. Khan et al. [2] argue
that knowledge-based decision support systems for financial management are an important
part of investment plans. They concluded that investors avoid investing in traditional
investment institutions, such as banks, due to the low return on investment.
Currently, the stock market is one of the main areas of investment. Predicting the price of
stocks is becoming a difficult task for day traders, investors and data scientists. These are
complex functions of a wide range of interracting factors that influence the dynamics of price
movements [6]. Politics, the social prospects, the company's sales and socio-economic factors
affect global perception of stocks, which is influenced by the balance of supply and demand
[7]. This is confirmed also by Gupta and Chen [8], who add that stock prices and financial
markets are often based on sentiment, which leads to research efforts to predict stock market
trends using public sentiment expressed on social networks, such as Facebook and Twitter.
Predictions can be made more effectively by considering price fluctuations and understanding
2SHS Web of Conferences 132, 01012 (2022) https://doi.org/10.1051/shsconf/202213201012
IES2021
people's mood [9]. However, Chaudhari and Ghorpade [10] believe that predicting stock return
is a significant problem in the financial sector, due to the non-linear fluctuations in the
company's return on investment in stocks. Inaba [11] analysed global market commodities for
37 developed and developing countries, stating that international stock price returns in
developed countries were higher than in developing countries. On the contrary, return on
investment of stocks grew faster in developing countries, due to time-varying factors. These
factors include not only the openness of international trade and finance, but also institutional
factors representing the development of information and communication technologies, the
protection of property rights and the transparency of information disclosure.
Time series of stock prices are crucial for the prediction of stock prices. Time series analysis
is a fundamental method for predicting stock prices and remains the most widely used research
method [12]. However, this method is not entirely accurate, as it does not include external
factors, such as news, events, etc., that may affect stock price developments [13]. Rajesh and
Gandy [14] focused on time series prediction, introducing the CashTagNN system, which uses
sentiment and subjectivity scores of tweet, including cashtags, to model stock market
movements, especially to predict opening stock prices. In this system, they used two machine
learning methods, namely feed-forward neural network and the deep convolutional neural
network. Ebadati and Mortazavi [15] also use the method of neural networks, applying the
hybrid method of genetic algorithm (GA) and artificial neural network (ANN) to develop a
method for predicting stock prices and time series. In the GA method, the output values are
further converted into the developed ANN algorithm to correct errors at the exact point. This
analysis suggests that GA and ANN can improve the accuracy with a fewer number of
iterations. Gandhmal and Kumar [16] introduce several techniques for predicting stock market
trends. The authors perform an analysis that describes the software tools used in documents that
also deal with price prediction. According to their research, the leading software tools include
JavaScript, Python and Matlab. Vochozka, Horak and Krulicky [17] also agree that the Matlab
system is the most frequently used software for making stock price predictions, and use the
neural network method for research. Horak and Krulicky [18] aim to compare the method of
exponential smoothing of time series and time series smoothing using neural networks as a tool
for predicting the future development of a company´s value. First, they analyse the dataset,
which is followed by generating neural networks, retaining five with the best characteristics.
Exponential time series smoothing is the next step, followed by obtaining predictions for 62
trading days, which is subseuently compared with the results of two retained neural networks.
3 Data and methods
3.1 Data
For time series research, individual data are obtained from the finance.yahoo.com website.
This page presents the historical development of Apple Inc.'s stock prices, specifically daily
data for the period of 2000 - 2020. The obtained data are processed in Microsoft´s Excel. The
dataset contains 5,283 rows. The next step is to edit the dataset and exclude irrelevant data,
such as opening prices or the lowest and highest stock prices. Only the columns containing
the date and the closing prices of stocks are kept in the dataset. The next step is the evaluation
and comparison of the obtained data.
3.2 Methods
The data are evaluated using the time series analysis. Time series analysis compares
comparable data, which are ordered by time. Using statistical methods, values such as
3SHS Web of Conferences 132, 01012 (2022) https://doi.org/10.1051/shsconf/202213201012
IES2021
median, mode, arithmetic mean, variance, variance range and maximum and minimum value
are calculated in Excel for each segment. The obtained data are evaluated both qualitatively
and quantitatively. The resulting values are also graphically illustrated. The information
obtained provides an analysis of the pace and fluctuations in stock prices and their causes.
Excessive fluctuations are analysed in more detail by looking for possible events that have
affected them. Finally, the development of time series during the COVID-19 pandemic are
examined and evaluated. This pandemic has been sweeping the world since March 2020. For
this period, separate charts and tables are created.
4 Results
The time series of Apple Inc.'s stock prices is introduced in the reference period (i.e. 2000-
2020), separately for the COVID-19 pandemic period (i.e. from March 2020 to the end of the
same year), and for the period of economic crisis (i.e. 2007-2009).
The curve of the stock prices development in 2000 - 2020 (see Figure 1) reached its
maximum value in December 2020 ($ 136.69). By contrast, the lowest value was recorded in
April 2003 ($ 0.23). At the beginning of 2000, stock prices stagnated, but then began to rise
gradually from 2004, and their rise did not stop until early the year 2008, when there was a
slight decline. In 2009–2012, the value rose slightly. The decline appeared again in 2013, but
the following two years brought an increase in stock prices. At the beginning of 2016, prices
fell again; however, in the same year, they also started to rise at a dizzying pace. This increase
did not stop until 2018, when there was a sharp decline until 2019. After that, however, stock
prices were growing again at a rapid pace, and a sharp decline occurred in 2020. Around the
middle of the same year, there was the largest and most notable increase in the period under
review, reaching the maximum value at the end of the year.
In the monitored periods, the basic statistical characteristics of the time series were
calculated – median, mode, arithmetic mean, variance and variance range. The average share
price is $ 9.19. The value that occurs most frequently between 2000 and 2020 is $ 0.35. The
calculated average stock price is $ 18.70. The variance is $ 565.48 and the difference between
the maximum and minimum value is $ 136.45.
160,000000
140,000000
120,000000
Stock price in USD
100,000000
80,000000
60,000000
40,000000
20,000000
0,000000
2000
2000
2001
2002
2003
2004
2005
2005
2006
2007
2008
2009
2010
2010
2011
2012
2013
2014
2015
2016
2016
2017
2018
2019
2020
Year
Fig. 1. Historical development of Apple Inc. stock price time series from 2000 to 2020 incl.
Source: Compiled by the authors on the basis of data from finance.yahoo.com
4SHS Web of Conferences 132, 01012 (2022) https://doi.org/10.1051/shsconf/202213201012
IES2021
The curve of the development of stock prices during the COVID-19 pandemic (see Figure
2) reached its peak in December 2020. The price was 136.69 USD. It reached its minimum
in March 2020 ($ 55.09). With the onset of the COVID-19 pandemic, stock prices fell first,
reaching the aforementioned minimum in March. At the beginning of April, the prices grew
gradually, without major and demonstrable declines, and the rise did not stop until the end of
July. Prices stagnated for a short period, but then there was a sharp rise, which lasted until
the early September. After that, prices fell for several days. Between mid-September and
early December, stock prices fluctuated rapidly and frequently, falling and rising again..
However, the fluctuations range was not large and always maintained the range of up to ten
dollars per stock. At the end of the year, stock prices rose slightly, achieving the maximum
before the New Year.
The median value for this period is $ 102.30. The most frequently recorded price is $
91.02. The average share price in this period is $ 98.46. The variance takes the value of $
492.03, and the variance range is $ 80.59.
160,000000 2020-12-30; 133,720001
140,000000
USD
in USD
120,000000
100,000000
pricein
Stockprice
80,000000
60,000000
Stock
40,000000
20,000000
0,000000
Fig. 2. Development of stock prices during the COVID-19 pandemic
Source: Compiled by the authors on the basis of data from finance.yahoo.com
The curve of the development of stock prices during the economic crisis from 2007 to 2009
(see Figure 3) peaked in December 2009 ($ 7.55). The minimum was recorded in January of
the same year, with the price being $ 2.79 per share. At the beginning of the crisis (i.e. from
2007), stock prices rose gradually until the beginning of August, when achieved their
maximum. In August, prices decreased slightly, but then rose again at a relatively high rate.
Their rise did not stop until November 2007, when there was a short but rather a sharp fall in
stock prices. Until the end of 2007, however, prices grew only. At the beginning of 2008, the
first major and longer fall in prices came, which lasted until March. However, in early March,
stock prices grew at a relatively rapid pace and did not stop until May. Then, in the period May-
June, prices stagnated and did not change significantly. During July, there was a slight decline
followed by a slight increase; in August, there was the largest and longest fall in stock prices in
the period under review; however, the prices did not yet reach their minimum. This fall did not
stop until October. In the period from November 2008 to March 2009, prices did not change
significantly. However, a significant event that occurred during this period was that in January
2009, share prices reached their minimum for the period under review. After that, however,
from April to the end of 2009, prices grew only, reaching their maximum in December.
The median value for this period is $ 4.86. The most frequently recorded value is $ 4.42.
The average stock price for the period under review is $ 4.96. The variance is $ 1.75 and the
difference between the maximum and minimum is $ 4.76.
5SHS Web of Conferences 132, 01012 (2022) https://doi.org/10.1051/shsconf/202213201012
IES2021
8,000000
2009-12-31; 7,526071
7,000000
6,000000
Stock price in USD
5,000000
4,000000
3,000000
2,000000
1,000000
0,000000
2007-01-03 2008-01-03 2009-01-03
Fig. 3. Development of stock prices during the economic crisis
Source: Compiled by the authors on the basis of data from finance.yahoo.com
5 Result discussion
Based on the obtained results, it is possible to answer the formulated research questions as follows:
1. What factors influenced Apple Inc.'s share prices in the years 2000 - 2020?
In early 2000, Apple Inc. was on the verge of bankruptcy and the price of their stocks fell to
less than a dollar per stock. For this reason, the company reached back to its co-founder Steve
Jobs and brought him back to the position of CEO. In a few years, Jobs managed to bring the
company back to limelight and make it profitable again. Jobs had to turn to the company´s biggest
competitor, Microsoft, to borrow $ 150 million to pay off debts and bills. The company introduced
iPod in 2001, but this small player did not mean a miraculous breakthrough. In 2004, Apple Inc.
introduced iTunes, putting much faith in it. iTunes slowly gained momentum, and thus the rise in
stock prices. It soon recorded 200 million downloaded songs and became very popular and well-
liked. In 2007, with the advent of the global economic crisis, Apple Inc. released the historically
first iPhone. For comparison, the first smart Android phones appeared on the market three years
later. The number of stocks purchased climbed to almost $ 24,000 in 2008. In 2009, the financial
crisis hit stock markets and Apple Inc. stocks lost up to 70% of their value. However, in 2010, the
company introduced new products (iPhone 4 and iPad) and the price of stocks grew to $ 40,000.
Even the death of Steve Jobs in 2011 did not caused a fall in stock prices; in contrast, the prices
grew slowly but steadily. In 2014, Apple Inc. introduced the first wearable electronics, Apple
iWatch. This watch became very popular and used all over the world. This resulted in another
growth in the company's stocks prices. In 2016, the turning point came again. The company faced
severe criticism for the removal of the 3.5 mm jack connector of the iPhone 7. Despite the
alternative offer of the historically first Airpods wireless headphones, stock prices started to fall.
In 2018, Apple sold 217 million iPhones, 43 million iPods, 8.2 million Macs and introduced the
new state-of-the-art iOS 12 operating system. Therefore, stock prices rose again. In 2019, stock
prices fell to the bottom. The main reason are the concerns about the trade war between China and
the USA. No one knew what the war would mean for the sale of Apple products in China, Apple
Inc.'s third largest market. In 2020, the global pandemic of COVID-19 started. In that year, the
latest and best-rated iPhone of all generations was released. At the same time, Apple Inc., for the
first time in three years, replaced the South Korean brand Samsung in the position of the world
leader in the sale of smartphones, thus beating its biggest rival. Also, for the first time in its history,
Apple Inc. reached a record value of $ 136.69 per stock. All key milestones are shown in Table 4.
6SHS Web of Conferences 132, 01012 (2022) https://doi.org/10.1051/shsconf/202213201012
IES2021
What was the development of stock prices during the economic crisis of 2007-2009 at
Apple Inc.? Between 2007 and 2009, there was a global economic crisis. While most
companies faced heavy losses, Apple Inc. showed an opposite trend. The main reason was
the release of its flagship in 2007, historically the first iPhone OS mobile phone. The
company's profits grew at an incredible pace and phone sales rose to 7.4 million sold devices.
However, in 2008, after the release of the second iPhone OS 2, the company faced
manufacturing problems due to high demand. The demand exceeded the supply and sales and
stock prices began to fall. Because of this, the company was forced to discount the previous
generation of the iPhone to $ 99. In addition, in the same year, the company warned against
a possible hacker attack. It pointed to a critical error in its cell phone software. The company
saw its stock prices rise again in 2009 with the launch of the Macbook, which contributed
significantly to the company's high sales, particularly $ 3.05 million. While worldwide laptop
sales stagnated during the crisis, Apple Inc. sales jumped by 35%.
How did the COVID-19 pandemic affect Apple Inc. stock prices? Although the world
economy and financial markets were rather stagnant during the COVID-19 pandemic, it is
surprising that Apple Inc.'s stock prices still grew. This was mainly due to the global
lockdown and a change in people's behaviour. Most of them had to start spending much more
time at home due to closed workplaces, schools and closure of other services. People began
to use the devices for news, consumption, entertainment, but above all for work and study.
Due to these factors, the demand for products increased, especially in the case of iPad tablets
and MacBook computers. This is evidenced by the fact that worldwide sales of these devices
increased by 18.6% to 38.6 million units sold.
Al Aradi and Hewahi [7] argue that stock prices are influenced by supply and demand. I
completely agree with this statement. Based on the results achieved, I can confirm that this
balance has a significant impact on stock prices. I further agree with the statement of Kaushali
and Chaudhary [12], who argue that the method of predicting stock prices using time series
analysis is one of the fundamental methods but not entirely accurate one. In my opinion, this
method is very effective, which can be evidenced by my research.
This research can serve as support for beginning investors, who can predict future
developments in Apple Inc.'s stock prices based on the results. In addition, it can serve as an
inspiring article.
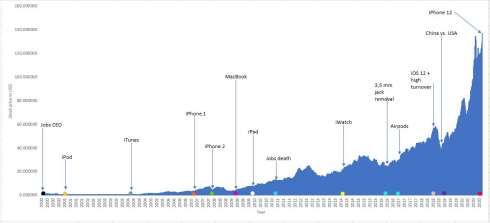
Fig. 4. Historical development of Apple Inc. stock price time series from 2000 to 2020 incl., with the
most important milestones
Source: Authors.
7SHS Web of Conferences 132, 01012 (2022) https://doi.org/10.1051/shsconf/202213201012
IES2021
Fig. 4 shows the milestones in the history of Apple Inc., (from left): Steve Jobs became
CEO, first iPod, origin iTunes, iPhone 1, iPhone 2, MacBook, iPad, Steve Job’s death,
iWatch, 3,5 mm jack removal, Airpods, iOS 12+ high, trade war between USA and China,
and iPhone 12.
6 Conclusion
The objective of the article was to use secondary data to analyze and evaluate the historical
development of stock prices of Apple Inc. from 2000 to 2020. Furthermore, it aimed to
specify in what time horizon, on what occasion, or as a result of what circumstances on the
financial market, the company's stocks reached the highest and the lowest prices. For the
period under review, the development of Apple Inc.'s stock prices was analysed and
quantitatively and qualitatively evaluated using time series analysis. The objective of the
article was thus achieved.
In the results chapter, the maximum and minimum stock prices, mode, median and
variance, the average price and the difference between the maximum and minimum value of
stock prices were calculated using statistical methods. Based on the data obtained, graphs
were created and presented especially for three specific periods: during the COVID-19
pandemic, for the economic crisis in 2007–2009, and the overall development of stock prices
from 2000 to 2020. The discussion of the results then described the factors that caused the
stock price fluctuations. I can conclude that stock prices are mainly affected by the following
factors: the launch of new products, product prices, the introduction of support programs and
accessories, customer reactions, external events and the overall operation of the company.
However, the above results raise the question of how long Apple Inc. will remain in the
forefront of the stock market? Will Apple announce a ground-breaking innovation in the
future that will raise stock prices to an astronomical amount? To what extent can the political
situation affect Apple Inc.'s stock prices? In order to answer these questions, further research
is needed. Further research could focus on the development of stocks from the establishment
of the company or its comparison with the competitors.
Acknowledgement
The article was prepared within the project SVV202109 “Scientific school” – Integration of
students and experts from practice in creative and scientific research activities of the School
of Expertness and Valuation.
References
1. R. Gottwald, Optimal portfolio of chosen stocks of the Prague stock exchange. Littera
Scripta, 7(1), 12-24 (2014)
2. U. Khan, F. Aadil, M. A. Ghazanfar, S. Khan, N. Metawa, K. Muhammad, I. Mehmood,
Y. Nam, A robust regression-based stock exchange forecasting and determination of
correlation between stock markets. Sustainability, 10(10) (2018)
3. Z. Yeze, W. Yiying, Stock price prediction based on information entropy and artificial
neural network. 2019 5th International Conference on Information Management (ICIM),
pp. 248-251 (2019)
4. S. Arivarasan, A. Kumaravel, Stock market price prediction by 6 datamining techniques
anad final decision by comparison. International Journal of Applies Engineering
Research, 9(22), 7173-7178 (2014)
8SHS Web of Conferences 132, 01012 (2022) https://doi.org/10.1051/shsconf/202213201012
IES2021
5. W. Lazonick, M. Mazzucato, Ö. Tulum, Apple's changing business model: What should
the world's richest company do with all those profits? Accounting Forum, 249-267
(2013)
6. P. Domanižová, F. Milichovský, K. Kuba, Business models, strategy and innovation in
the new world of digization. Littera Scripta, 13(1), 17-31 (2020)
7. M. Al Aradi, N. Hewahi, Prediction of stock price and direction using neural networks:
Datasets hybrid modeling approach. 2020 International Conference on Data Analytics
for Business and Industry: Way Towards a Sustainable Economy (ICDABI), pp. 1-6
(202l)
8. R. Gupta, M. Chen, Sentiment analysis for stock price prediction. 2020 IEEE Conference
on Multimedia Information Processing and Retrieval (MIPR), pp. 213-218 (2020)
9. M. Jaggi, P. Mandal, S. Narang, U. Naseem, M. Khushi, Text mining of stocktwits data
for predicting stock prices. Applied System Innovation, 4(1) (2021)
10. A. Chaudhari, P. Ghorpade, Forecasting a firm’s position based on Pitroski’s F-score
using ARIMA. 2020 International Conference on Data Analytics for Business and
Industry: Way Towards a Sustainable Economy (ICDABI), pp. 1-5 (2020)
11. K. I. Inaba, Information-driven stock return comovements across countries. Research in
International Business and Finance, 51 (2020)
12. R. Dias, P. Alexandre, P. Heliodoro, Contagion in the LAC financial markets: The
impact of stock crises of 2008 and 2010. Littera Scripta, 13(1), 32-45 (2020)
13. A. Kaushal, P. Chaudhary, News and events aware stock price forecasting technique.
In: 2017 International Conference on Big Data, IoT and Data Science (BID), pp. 8-13
(2017)
14. N. Rajesh, L. Gandy, CashTagNN: Exploiting the use of cashtags to predict stock market
prices using convolutional networks. Proceedings of the 2020 4th International
Conference on Algorithms, Computing and Systems, pp. 1-5 (2020)
15. O. M. E. Ebadati, M. T. Mortazavi, An efficient hybrid machine learning method for
time series stock market forecasting. Neural Network World, 41-55 (2018)
16. D. P. Gandhmal, K. Kumar, Systematic analysis and review of stock market prediction
techniques. Computer Science Review, 34 (2019)
17. M. Vochozka, J. Horak, T. Krulicky, Innovations in management forecast: Time
development of stock prices with neural networks. Marketing and Management of
Innovations, 2020(2), 324-339 (2020)
18. J. Horák, T. Krulický, Comparison of exponential time series alignment and time series
alignment using artificial neural networks by example of prediction of future
development of stock prices of a specific company. SHS Web of Conferences: Innovative
Economic Symposium 2018 – Milestones and Trends of World Economy, EDP Sciences
(2019)
9You can also read


