EVITTA: a web-based visualization and inference toolbox for transcriptome analysis
←
→
Page content transcription
If your browser does not render page correctly, please read the page content below
Published online 21 May 2021                                             Nucleic Acids Research, 2021, Vol. 49, Web Server issue W207–W215
                                                                                                            https://doi.org/10.1093/nar/gkab366

eVITTA: a web-based visualization and inference
toolbox for transcriptome analysis
Xuanjin Cheng1,2,3,† , Junran Yan1,2,4,† , Yongxing Liu1,2,3 , Jiahe Wang1,2,3 and
Stefan Taubert 1,2,3,4,*
1
 Centre for Molecular Medicine and Therapeutics, The University of British Columbia, Vancouver, British Columbia,
Canada, 2 British Columbia Children’s Hospital Research Institute, The University of British Columbia, Vancouver,
British Columbia, Canada, 3 Department of Medical Genetics, The University of British Columbia, Vancouver, British

                                                                                                                                                                  Downloaded from https://academic.oup.com/nar/article/49/W1/W207/6279840 by guest on 24 September 2021
Columbia, Canada and 4 Graduate Program for Cell and Developmental Biology, The University of British Columbia,
Vancouver, British Columbia, Canada

Received March 15, 2021; Revised April 12, 2021; Editorial Decision April 22, 2021; Accepted May 04, 2021

ABSTRACT                                                                                 GRAPHICAL ABSTRACT
Transcriptome profiling is essential for gene regu-
lation studies in development and disease. Current
web-based tools enable functional characterization
of transcriptome data, but most are restricted to ap-
plying gene-list-based methods to single datasets,
inefficient in leveraging up-to-date and species-
specific information, and limited in their visualiza-
tion options. Additionally, there is no systematic
way to explore data stored in the largest transcrip-
tome repository, NCBI GEO. To fill these gaps, we
have developed eVITTA (easy Visualization and In-
ference Toolbox for Transcriptome Analysis; https:
//tau.cmmt.ubc.ca/eVITTA/). eVITTA provides mod-
ules for analysis and exploration of studies pub-
lished in NCBI GEO (easyGEO), detailed molecular-
and systems-level functional profiling (easyGSEA),
and customizable comparisons among experimental
groups (easyVizR). We tested eVITTA on transcrip-
tomes of SARS-CoV-2 infected human nasopharyn-                                           INTRODUCTION
geal swab samples, and identified a downregulation                                       Transcriptome profiling is an essential technique to study
of olfactory signal transducers, in line with the clini-                                 gene regulation in development and disease (1). The emer-
cal presentation of anosmia in COVID-19 patients. We                                     gence of affordable high-throughput microarray and se-
also analyzed transcriptomes of Caenorhabditis el-                                       quencing technologies has resulted in the rapid expansion of
egans worms with disrupted S-adenosylmethionine                                          transcriptome experiments, which in turn greatly increased
metabolism, confirming activation of innate immune                                       the demand for robust analytical tools for data inter-
responses and feedback induction of one-carbon cy-                                       pretation. Effective transcriptome interpretation involves
cle genes. Collectively, eVITTA streamlines complex                                      three key aspects: drawing inference from published studies,
computational workflows into an accessible inter-                                        translating the data into meaningful biological knowledge,
                                                                                         and comparing multiple conditions to each other to discern
face, thus filling the gap of an end-to-end platform ca-
                                                                                         underlying regulatory changes.
pable of capturing both broad and granular changes                                          First, knowledge from past studies is essential for hy-
in human and model organism transcriptomes.                                              pothesis generation and data interpretation. The Gene Ex-
                                                                                         pression Omnibus (GEO) database, funded by the Na-

* To   whom correspondence should be addressed. Tel: +1 604 875 3860; Fax: +1 604 875 3819; Email: taubert@cmmt.ubc.ca
†
    The authors wish it to be known that, in their opinion, the first two authors should be regarded as joint First Authors.

C The Author(s) 2021. Published by Oxford University Press on behalf of Nucleic Acids Research.
This is an Open Access article distributed under the terms of the Creative Commons Attribution-NonCommercial License
(http://creativecommons.org/licenses/by-nc/4.0/), which permits non-commercial re-use, distribution, and reproduction in any medium, provided the original work
is properly cited. For commercial re-use, please contact journals.permissions@oup.com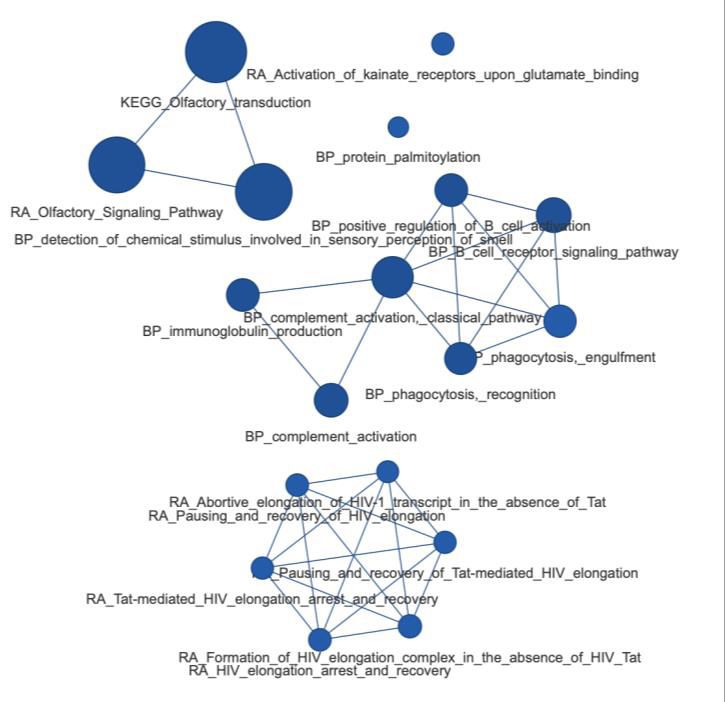
W208 Nucleic Acids Research, 2021, Vol. 49, Web Server issue

tional Center for Biotechnology Information (NCBI), is the        pares and contrasts multiple datasets via an integrated in-
largest public repository for transcriptome datasets (144         tersection analysis workflow. Above all, eVITTA’s interac-
751 data series, 4.2 million samples on 23 February 2021)         tive and user-friendly interface makes transcriptome analy-
(2,3). Despite the treasure trove of data in GEO, no tool yet     sis accessible for wet and dry lab biologists alike. The multi-
exists that can systematically extract and process such data      ple entry and exit points in the workflow also allow users to
for inferential use. Most web-based GEO data analysis tools       adapt one or more individual tool(s) into their own custom
are limited in functionality: some only provide access to mi-     analysis pipeline (Figure 1, Table 1).
croarray data without differential expression (DE) analy-            To test eVITTA and demonstrate its capabilities, we per-
sis (4), while others analyzing RNA-sequencing (RNA-seq)          formed two independent evaluation studies on published
data rely on their own processed data repositories, which         gene expression datasets: (i) transcriptomes of SARS-CoV-
tend to update slowly and often exclude datasets due to un-       2 infected human nasopharyngeal (NP) swab samples and
supported species or experiment type (5).                         (ii) transcriptomes of Caenorhabditis elegans worms defi-

                                                                                                                                    Downloaded from https://academic.oup.com/nar/article/49/W1/W207/6279840 by guest on 24 September 2021
   Second, uncovering mechanistic insights from gene ex-          cient in sams-1/MAT1A or sbp-1/SREBP. We were able to
pression data is central to all types of transcriptomic stud-     recapitulate original findings and also discovered additional
ies. Functional enrichment analysis (aka functional profil-       biological insights that were experimentally confirmed in
ing) is the primary technique for this purpose, and is com-       studies following the original profiling experiments, demon-
monly used to interpret gene lists derived from many omics        strating eVITTA’s effectiveness in transcriptome interpreta-
platforms (6). To date, a variety of web-based enrichment         tion.
analysis tools have been developed (7–14), but these are
sometimes suboptimal for interpreting transcriptome data.         MATERIALS AND METHODS
Surveys have shown that most tools are outdated in their
gene annotation (gene set, GS) databases, sometimes by            Implementation
several years, which can severely impact functional inter-        The eVITTA web server runs on Ubuntu Linux (18.04.5
pretation and follow-up experiments (15). When multiple           LTS) with 32 GB memory, 16-core CPUs and a 10TB
GS databases are analyzed together, most tools list results       hard drive with Apache (version 2.4.29, https://httpd.
separately in tables or simple graphs, which is ineffective       apache.org), R (version 4.0.2, https://www.r-project.org/),
in integrating the information (8–12). Some tools rely on         and R Shiny Server (version 1.5.14.948, https://rstudio.com/
literature-curated resources such as Gene Ontology (GO),          products/shiny/download-server/). eVITTA utilizes several
which are sometimes not precise enough to capture the             third-party tools, including GEOquery (24), edgeR (25),
functions of genes in the biological system of interest (8–12).   limma (26), plotly (https://plotly.com/r/), Tidyverse (27),
Approach-wise, gene-list-based overrepresentation analysis        fgsea (28), gprofiler2 (29), pathview (30), visNetwork
(ORA) remains predominant (7–13); alternative methods             (https://datastorm-open.github.io/visNetwork/), VennDia-
for transcriptomic studies, such as pre-ranked Gene Set En-       gram (31), UpsetR (32), RRHO (33) and others (Supple-
richment Analysis (GSEA) based on gene-set scoring (16),          mentary Table S1). eVITTA has been tested successfully
are not supported by most tools. The only tool support-           on several browsers, including Safari v13.1.2, Firefox v65.0,
ing GSEA to our knowledge (14) requires users to supply           and Chrome v86.0.4240.111. Detailed methods in Supple-
a separately generated rank file, setting a hurdle for non-       mentary Data Section 1.
bioinformaticians. Furthermore, most existing tools pro-
vide limited options for visualizing transcriptome patterns.
                                                                  easyGEO: An interface to access, analyze and visualize tran-
   Third, multiple dataset comparisons play a crucial role
                                                                  scriptome data from NCBI GEO
in interpreting multi-group experiments and in comparing
new results to published data. Despite the growth in de-          Inputs: The unique GEO identifier of an NCBI GEO series,
mand, no web-based tool exists yet to our knowledge that          which begins with ‘GSE’.
provides a complete pipeline for identifying and visualizing         Data processing: Gene expression data matrix and de-
intersections and disjoints among multiple transcriptome          sign matrix are retrieved automatically. If the count table
profiles. Tools exist for filtering gene lists (17) or plotting   in an RNA-seq study is specified as raw, genes expressed
certain types of visualizations such as Venn diagrams (18–        at a level less than 1 count per million (CPM) reads in at
20), UpSet plots (19,21), and heatmaps (22), but stringing        least five of the samples, or the minimum number of bi-
these modules into an inference workflow remains tedious.         ological repeats in each condition, whichever less, are ex-
The one tool that does provide a graphical workflow for           cluded from further analysis; if the count table in an RNA-
intersection analysis, to our knowledge, is only tailored to      seq experiment is normalized, or if the dataset is based on
pairwise comparisons, and does not provide interactive or         microarrays, a threshold of 1 is applied likewise to exclude
customizable visualizations (23).                                 barely expressed genes. Next, for RNA-seq datasets, raw
   To address these challenges in transcriptome analysis and      read counts are normalized using the trimmed mean of M-
interpretation, we have developed eVITTA (easy Visual-            values (TMM) in edgeR (25) to adjust samples for differ-
ization and Inference Toolbox for Transcriptome Analy-            ences in library size and Limma-voom (26) transformed us-
sis; https://tau.cmmt.ubc.ca/eVITTA/). It consists of three       ing the default parameters; for microarray and normalized
modules that can work together or as standalones: easy-           RNA-seq counts, Limma-voom (26) transformation is ap-
GEO accesses, analyzes, and visualizes transcriptome data         plied with the normalize = ‘quantile’ option. Then, a linear
in NCBI GEO; easyGSEA visually delineates gene expres-            model using weighted least squares for each gene is fitted
sion patterns by functional profiling; and easyVizR com-          with Limma-lmFit (26); batch effect, if any, is processed as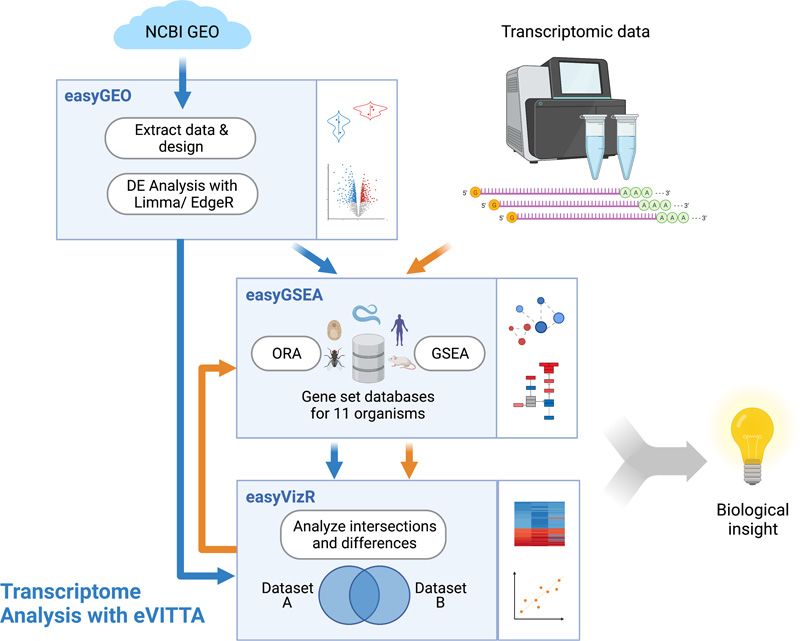
Nucleic Acids Research, 2021, Vol. 49, Web Server issue W209

                                                                                                                                                   Downloaded from https://academic.oup.com/nar/article/49/W1/W207/6279840 by guest on 24 September 2021
Figure 1. A transcriptome interpretation workflow using the eVITTA toolbox. DE: differential expression; GEO: Gene Expression Omnibus; GSE: Gene
Series Expression; GSEA: Gene Set Enrichment Analysis; RNK: ranked gene list; ORA: overrepresentation analysis.

Table 1. Overview of eVITTA tools
Tool                 Input                         Data processing               Output data                   Output visualizations
easyGEO              GEO accession number          DE analysis with edgeR        Gene expression, study        Volcano, heatmap, box, violin
                                                   and limma                     design, DE tables,
                                                                                 comma-separated

easyGSEA             RNK file, DE table, or        ORA or GSEA                   Enrichment table,             Bar, bubble, keyword,
                     gene list                                                   comma-separated               Manhattan, volcano; GSEA plot,
                                                                                                               density, box, violin; pathway
                                                                                                               maps; enrichment network,
                                                                                                               dendrogram, cluster
                                                                                                               bar/bubble/table

easyVizR             GSEA or DE results            Intersection analysis         Intersection table,           Venn, UpSet plot; heatmap, 2-D
                                                   based on user-filtered        comma-separated               & 3-D scatter; RRHO plot,
                                                   lists                                                       rank-rank scatter; volcano, bar;
                                                                                                               leading-edge network; word cloud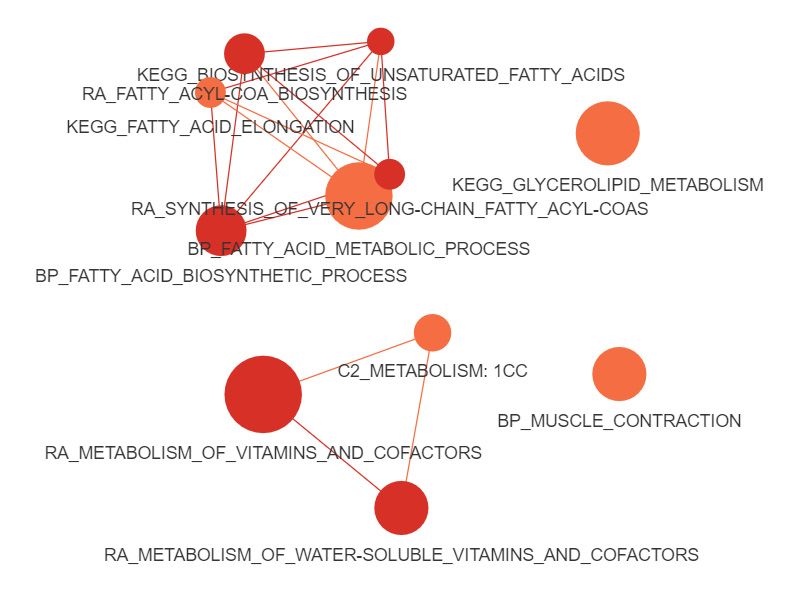
W210 Nucleic Acids Research, 2021, Vol. 49, Web Server issue

a factor in the design matrix to exclude sequencing artifacts.    EVALUATION
Lastly, eBayes (26) empirical Bayes smoothing of standard
                                                                  SARS-CoV-2 infected human nasopharyngeal transcrip-
errors is applied to assess for DE.
                                                                  tomes show deregulation of olfactory signal transducers
   Outputs: (a) Gene expression and study design tables (im-
portable into DE analyzers); (b) DE table (importable into        Since early 2020, the global spread of SARS-CoV-2 has
easyGSEA and easyVizR); and (c) visualizations (volcano,          led to concerted efforts to characterize its etiology in hu-
heatmap, box and violin) that highlight most significantly        man patients. To test the analytical pipeline of eVITTA,
altered genes and display expression changes of a single          we reanalyzed a published RNA-seq dataset (GSE152075
gene.                                                             (37)) of nasopharyngeal (NP) swabs from 430 SARS-CoV-
                                                                  2-infected individuals and 54 uninfected controls (for de-
                                                                  tailed steps, see Supplementary Data Section 2.1). First, us-
easyGSEA: functional profiling with integrative gene annota-      ing easyGEO, we retrieved the count data and design ma-

                                                                                                                                  Downloaded from https://academic.oup.com/nar/article/49/W1/W207/6279840 by guest on 24 September 2021
tion databases                                                    trix submitted by the authors, and performed DE analy-
                                                                  sis. In line with the original findings (37), we found that
Inputs: GSEA module: a ranked gene list (RNK) file or a
                                                                  SARS-CoV-2 infection induced an interferon-driven antivi-
DE table, comma- or tab-delimited. ORA module: list of
                                                                  ral response in the nasopharynx, upregulating genes en-
genes or proteins, delimited by newline, tab or whitespace.
                                                                  coding antiviral factors (e.g. IFIT1/2/3/6, RSAD2) and
   Data processing: To start, users select species of inter-
                                                                  chemokines (e.g. CXCL9/10/11) (Figure 2A). Next, to test
est and adjust choices of databases if needed (Supplemen-
                                                                  if eVITTA’s analytical capacity using combinatorial GS
tary Table S2); or, users upload GS libraries supplied in
                                                                  databases improves the sensitivity of finding molecular pat-
Gene Matrix Transposed format (*.gmt) for custom anal-
                                                                  terns, we performed GSEA using the default selection of
ysis. Gene identifiers, if specified as Other/Mixed, are au-
                                                                  biological process and pathway databases in easyGSEA.
tomatically converted into HUGO symbols. In the GSEA
                                                                  We found that olfactory transduction GSs were downregu-
module, rank tables are automatically calculated if input
                                                                  lated (Figure 2B, Supplementary Figure S2A, Supplemen-
is a DE table. Next, ORA or GSEA is performed (by de-
                                                                  tary Table S3). At the gene level, key olfactory transduc-
fault, min GS size = 15, max GS size = 200, permutation =
                                                                  ers, including G protein subunit alpha L (GNAL) (38) and
1000) and visualizations are automatically generated, each
                                                                  cyclic nucleotide-gated channel subunit alpha 4 (CNGA4)
customizable with its own plotting parameters.
                                                                  (39), showed reduced expression (Figure 2C, D, Supplemen-
   Outputs: (a) converted rank and DE tables (GSEA mod-
                                                                  tary Figure S2B). The observation of deregulated olfactory
ule); (b) enrichment table (importable into easyVizR); (c) re-
                                                                  signaling during SARS-CoV-2 infection agrees well with the
sults summary with interactive bar, bubble, keyword, Man-
                                                                  clinical presentation of anosmia in COVID-19 cases (40)
hattan and volcano plots; (d) individual GS’s statistics, and
                                                                  and with a recent report of transient olfactory dysfunc-
its distribution in the genome background (GSEA mod-
                                                                  tion in mice infected with SARS-CoV-2 (41). Together, this
ule) delineated with enrichment, density, box and violin
                                                                  demonstrates eVITTA’s capacity to capture both broad and
plots; (e) pathway maps (KEGG (34), Reactome (35) and
                                                                  granular patterns in gene expression, which facilitates the
Wikipathways (36)); and (f) enrichment network with clus-
                                                                  identification of biological insights.
tering dendrogram.

                                                                  S-adenosylmethionine (SAM) mediates innate immune re-
easyVizR: a systematic workflow for comparing regulatory          sponse and lipogenesis in C. elegans
patterns in multiple datasets
                                                                  To test eVITTA’s functional profiling capacity and com-
Inputs: Comma-delimited data table(s) containing identi-          putational reproducibility, we analyzed published C.
fiers, differential expression metric (e.g. log2 -transformed     elegans transcriptomes characterizing the response to S-
fold change, enrichment score), P-value (pval), and FDR           adenosylmethionine (SAM) deficiency. The universal
or adjusted P-value (padj).                                       methyl donor SAM is produced by SAM synthase (SAMS
   Data processing: For each selected dataset, filtered lists     in C. elegans; MAT in mammals) in the one-carbon cycle
of genes or GSs are generated from user-selected filters (de-     (1CC). We reanalyzed published microarray and RNA-seq
fault: pval < 0.05). From filtered lists, users may select an     data characterizing responses to sams-1 RNA interference
intersection of interest by defining set relationships (Supple-   (RNAi), which were previously analyzed by ORA (42) and
mentary Figure S1). The selected intersection is highlighted      used to validate the C. elegans functional database and
in Venn and Upset plots, and terms in the intersection are        annotation tool WormCat (43). We first compared three in-
used to generate interactive visualizations.                      dependent transcriptome analyses of sams-1 RNAi-treated
   Outputs: (a) filtered gene lists (importable into              worms, including two microarray datasets and one RNA-
easyGSEA or other ORA tools) and corresponding                    seq dataset (42,44) (Supplementary Table S4; detailed steps
expression tables; (b) Venn and UpSet plots; (c) heatmap          in Supplementary Data Section 2.2). Despite the difference
for terms in chosen intersection; (d) 2D and 3D scatter           of the RNA-seq study compared to the two microarrays in
plots, rank-rank hypergeometric overlap (RRHO) plot and           terms of experimental platform and upstream processing,
rank-rank scatter for correlation analysis (33); (e) volcano      enrichment analysis with eVITTA showed a substantial
and bar plot for single datasets; (f) leading-edge network        overlap (Figure 3A) and strong correlation in terms of
(for GSEA outputs); and (g) text enrichment word cloud            significantly regulated GSs (R2 = 0.95 and 0.87; Figure
for identifiers.                                                  3B, C), and also in terms of overall enrichment profiles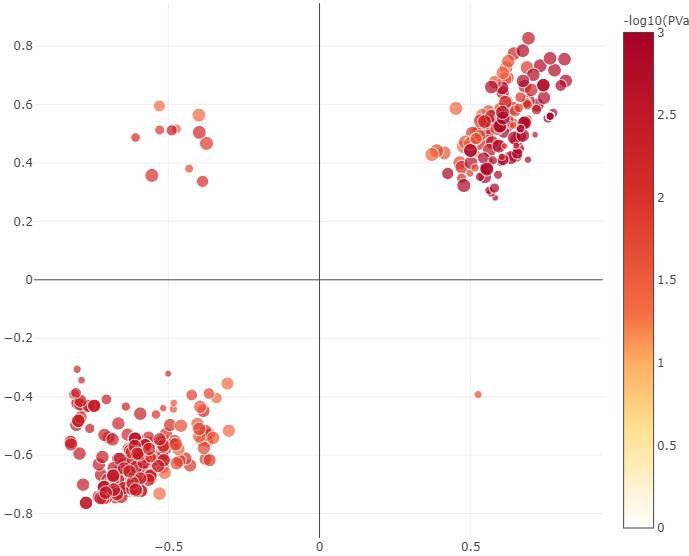
Nucleic Acids Research, 2021, Vol. 49, Web Server issue W211

A                                                          C

                                                                                                                                                                Downloaded from https://academic.oup.com/nar/article/49/W1/W207/6279840 by guest on 24 September 2021
B

                                                           D

Figure 2. Evaluation study on SARS-CoV-2 infected human nasopharyngeal transcriptomes (GEO repository: GSE152075). (A) The volcano plot high-
lights the 15 most upregulated (red) and 15 most downregulated (blue) genes by logFC in SARS-CoV-2 infected NP samples relative to uninfected indi-
viduals. (B) The graph shows the enrichment network of GSs deregulated by SARS-CoV-2 infection, including significantly (pval < 0.001, padj < 0.3)
downregulated olfactory transduction processes. Node denotes GS; node size reflects the number of leading-edge genes in each GS; blue, downregulation.
Edge reflects significant overlap of leading-edge genes as defined by a Jaccard Coefficient larger than or equal to 0.25. Detailed statistics are provided in
Supplementary Table S3. (C) The pathway map depicts gene expression changes of the KEGG olfactory transduction pathway in SARS-CoV-2 infected
NP samples. Blue, downregulation. Notable genes highlighted in red. (D) Violin plots show reduced expression of two key olfactory transducers, CNGA4
(logFC = -0.84, pval = 1.69E-01, padj = 4.88E-01) and GNAL (logFC = -1.65, pval = 1.30E−02, padj = 3.2E−01), in SARS-CoV-2 infected NP samples.
CPM, counts per million; ES, enrichment score; GEO, Gene Expression Omnibus; GS, gene set; KEGG, Kyoto Encyclopaedia of Genes and Genomes;
logFC, log2 -transformed fold change; NP, nasopharyngeal; padj, adjusted P-value; pval, P-value.

(rho = 0.77 and 0.72; Figure 3D, E). This suggests that the                      for the innate immune response against Gram-negative bac-
eVITTA pipeline is robust enough to handle comparisons                           teria (45,46); this may explain why the original study (44)
of studies with differences in upstream platforms and                            found sams-1 RNAi worms to be exquisitely susceptible to
processing.                                                                      infection by P. aeruginosa, a Gram-negative bacterium.
   In C. elegans, SAM deficiency induces immune responses                           Although sams-1 and sbp-1 RNAi affected the transcrip-
in the absence of pathogen infection, and a similar response                     tome in similar ways, a small set of GSs were upregulated
occurs upon depletion of the SAM-regulated lipid synthesis                       in sams-1 RNAi but downregulated in sbp-1 RNAi (Figure
regulator sbp-1/SREBP (42). We thus tested eVITTA’s effi-                        4C-E; Supplementary Table S5). Most of these GSs pertain
cacy to capture convergent and divergent regulations fol-                        to lipid metabolism, recapitulating published findings that
lowing sams-1 or sbp-1 RNAi. Consistent with previous                            lipogenesis is elevated by sams-1 deficiency but suppressed
findings (42,43), we confirmed a strong immune signature                         by sbp-1 deficiency (42,47). Interestingly, the 1CC also fol-
in both sams-1 and sbp-1 deficiency (Figure 4A-B). Interest-                     lows this pattern, not only confirming a known negative
ingly, eVITTA’s comprehensive GS databases allowed us to                         feedback loop from sbp-1 to the 1CC (42,47), but also in-
discover specific changes in one branch of innate immunity,                      dicating that SAM deficiency alone causes compensatory
Toll-like receptor (TLR) signaling (Figure 4B). Prior stud-                      induction of the 1CC, in line with a recent study (48). Over-
ies have shown that, in C. elegans, TLR signaling is required                    all, this exemplifies the utility of eVITTA in revealing both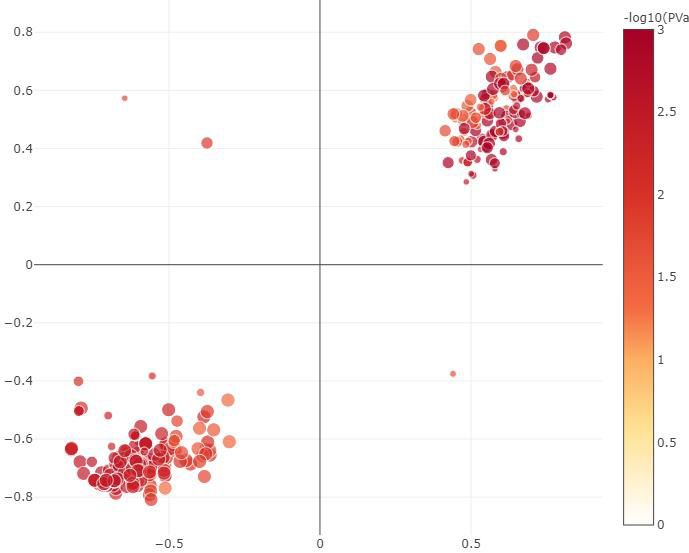
W212 Nucleic Acids Research, 2021, Vol. 49, Web Server issue

         A                                       B                                                  C

                                                                                                                                                              Downloaded from https://academic.oup.com/nar/article/49/W1/W207/6279840 by guest on 24 September 2021
                                                D                                                   E

Figure 3. Comparison of three different transcriptome profiles of C. elegans worms with perturbations in S-adenosylmethionine synthesis (sams-1/MAT1A
RNAi). The figure compares GSEA profiles of three independent experiments of sams-1 RNAi treated worms: dataset A – microarray from GEO accession
GSE70692; dataset B – microarray from GSE70693; and dataset C – RNA-seq from GSE121508. (A) The Venn diagram shows (in yellow) GSs that
are significantly changed (pval < 0.05, padj < 0.25) in all three sams-1 RNAi datasets. Each circle represents GSs that are significantly changed in the
corresponding dataset. easyVizR parameters: for datasets A−C, pval< 0.05, padj < 0.25, intersection = true. (B) The 2D scatter plot shows GSs that are
significantly regulated (pval< 0.05, padj < 0.25) in both datasets A and B. n = 320; correlation R2 = 0.95. X-axis: ES in dataset A; Y-axis: ES in dataset
B. (C) The 2D scatter plot shows GSs that are significantly regulated (pval< 0.05, padj < 0.25) in both datasets A and C. n = 359; correlation R2 = 0.87.
X-axis: ES in dataset A; Y-axis: ES in dataset C. (D) The rank scatter plot shows the Spearman correlation between unfiltered datasets A and B. X and Y
axes: ranks of −log10 -transformed P-values signed by ES (−log10 (pval)*sign(ES)) in datasets A and B, respectively. n = 912; rho = 0.77; pval< 2.2e−16.
(E) The rank scatter plot shows the Spearman correlation between unfiltered datasets A and C. X and Y axes: ranks of −log10 -transformed P-values signed
by ES (−log10 (pval)*sign(ES)) in datasets A and C, respectively. n = 961; rho = 0.72; pval< 2.2e−16. ES, enrichment score, also displayed as ‘Value’; GEO,
Gene Expression Omnibus; GS, gene set; GSEA, pre-ranked gene set enrichment analysis; intersection, selected parameters in easyVizR ‘3.2 Intersection
of Interest’; padj, adjusted P-value, also displayed as ‘FDR’; pval, P-value, also displayed as ‘PValue’; RA, Reactome Pathways; rho, Spearman’s rank
coefficient; RNA-seq, RNA sequencing.

convergent and differential patterns in multiple datasets at                    in expression, which other tools were unable to fully
high resolution.                                                                capture.
                                                                                   Although we developed eVITTA for transcriptome anal-
                                                                                ysis and interpretation, its tools can also be applied to
DISCUSSION                                                                      other omics studies. For instance, easyGSEA can function-
                                                                                ally characterize lists of genes or proteins generated from
Assembling a dedicated analytical pipeline to interpret tran-                   any omics platform, and easyVizR can handle any differ-
scriptomes is a complex task with many challenges. eVITTA                       ential expression data with statistical significance (https:
addresses these challenges by automating the query and                          //tau.cmmt.ubc.ca/eVITTA/#userguide).
analysis of NCBI GEO transcriptome data with a stan-                               Like all similar web servers, eVITTA has some limita-
dardized pipeline (easyGEO), performing functional pro-                         tions. easyGEO cannot handle datasets where count data
filing with 100+ monthly-updated, species-specific GS li-                       are missing; it also relies on user-supplied count data, which
braries (easyGSEA), and providing a workflow for sys-                           may be processed using different methods and thus can-
tematic comparison of expression patterns in multiple                           not be used for between-study comparisons. In addition,
datasets (easyVizR). As illustrated in the evaluation stud-                     it does not yet support datasets deposited in ArrayExpress
ies, eVITTA’s workflow and interactive visualizations en-                       or the European Nucleotide Archive (ENA). Future iter-
able efficient discovery of both broad and subtle changes                       ations of eVITTA may include access to these resources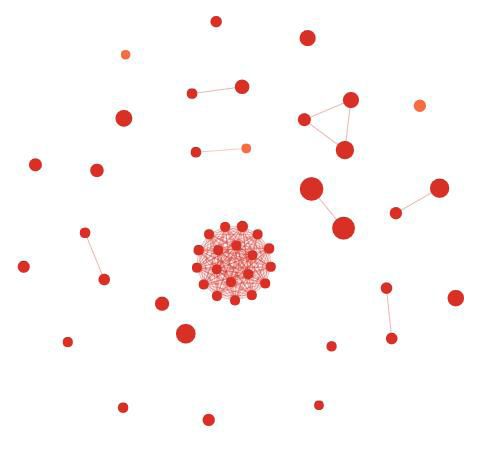
Nucleic Acids Research, 2021, Vol. 49, Web Server issue W213
A B C
Downloaded from https://academic.oup.com/nar/article/49/W1/W207/6279840 by guest on 24 September 2021
D E
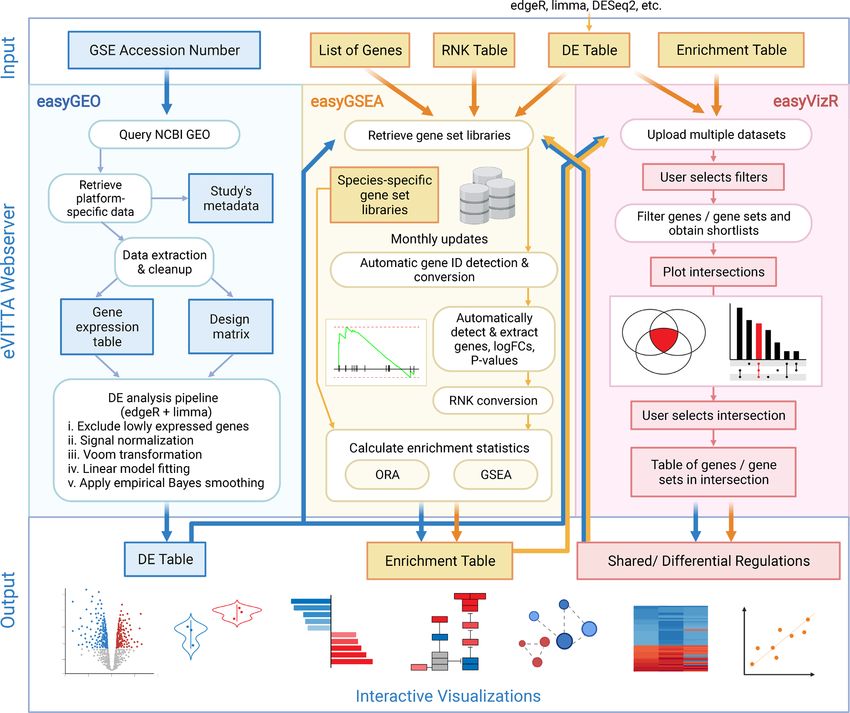
Figure 4. Evaluation study on C. elegans worms with perturbations in S-adenosylmethionine synthesis (sams-1/MAT1A RNAi) and lipogenesis (sbp-
1/SREBP RNAi). The figure compares GSEA profiles of sams-1 RNAi treated worms (datasets A−C in Figure 3) versus dataset D, microarray profile of
sbp-1 RNAi treated worms (GSE70692). (A) The Venn diagram shows (in yellow) GSs that are significantly upregulated (pval< 0.05, padj < 0.25, ES >
0) in all four datasets. Each circle represents GSs that are significantly upregulated in the corresponding dataset. easyVizR parameters: for datasets A−D,
pval< 0.05, padj < 0.25, sign = +, intersection = true. (B) The graph shows the enrichment network of 50 shared significantly upregulated GSs (from A).
Node denotes GS; node size reflects the number of leading-edge genes in each GS. Edge reflects significant overlap of leading-edge genes in dataset A, as
defined by a Jaccard coefficient larger than or equal to 0.25. (C) The 2-dimensional scatter plot shows the ESs of GSs that are significantly regulated (pval<
0.05, padj < 0.25) in both datasets A and D. n = 235; correlation R2 = 0.74. A set of GSs that are regulated in opposite directions is found in quadrant
four (bottom right); these mostly pertain to fatty acid biosynthesis. (D) The heatmap shows the 11 categories that are positively regulated in sams-1 RNAi
(pval< 0.05, padj < 0.25, ES > 0 in datasets A, B and C) and negatively regulated in sbp-1 RNAi (pval< 0.05, padj < 0.25, ES < 0 in dataset D). Cell colors
represent ES value, ordered by dataset A. Detailed statistics are provided in Supplementary Table S5. (E) The graph shows the enrichment network of 11
GSs from Figure 4D. Edges reflect significant overlap of leading-edge genes in dataset A; other parameters are as in B. 1CC, one-carbon cycle; GO, gene
ontology; BP, biological process; C2, WormCat Category 2; ES, enrichment score, also displayed as ‘Value’; GEO, Gene Expression Omnibus; GS, gene set;
GSEA, pre-ranked gene set enrichment analysis; Intersection, selected parameters in easyVizR ‘3.2 Intersection of Interest’; KEGG, Kyoto Encyclopaedia
of Genes and Genomes; padj, adjusted P-value, also displayed as ‘FDR’; pval, P-value, also displayed as ‘PValue’;RA, Reactome Pathways; RNA-seq,
RNA sequencing; TLR, Toll-like receptor.
and offer customizable DE analysis with limma (26), edgeR tween its three modules. Overall, eVITTA aims to both im-
(25) and DESeq2 (49). The GSEA method in easyGSEA prove existing pipelines for omics data analysis and to make
assumes genes in a GS change in one direction (either pre- transcriptome interpretation more accessible to the wider
dominantly up- or down-regulated); methods to evaluate research community.
GSs regardless of the direction are to be incorporated (50).
Future iterations of eVITTA may also adopt more effec-
tive weighing techniques in prioritizing GSs with high phe- DATA AVAILABILITY
notype relevance, especially in the context of other omics eVITTA is free and open to all users and there is no login
data such as ChIP-seq and genomic mutation data (51). In requirement (https://tau.cmmt.ubc.ca/eVITTA/). Its source
easyVizR, most modules rely on comparisons between fil- code is available in the GitHub repository (https://github.
tered gene lists; more options for unbiased comparisons, com/easygsea/eVITTA.git).
such as Spearman’s correlation heatmap, may be included
in the future. Future iterations of eVITTA may also ad-
dress challenges in comparing transcriptomes across species SUPPLEMENTARY DATA
(51,52). Lastly, future releases of eVITTA may provide a
more seamless user experience by providing direct links be- Supplementary Data are available at NAR Online.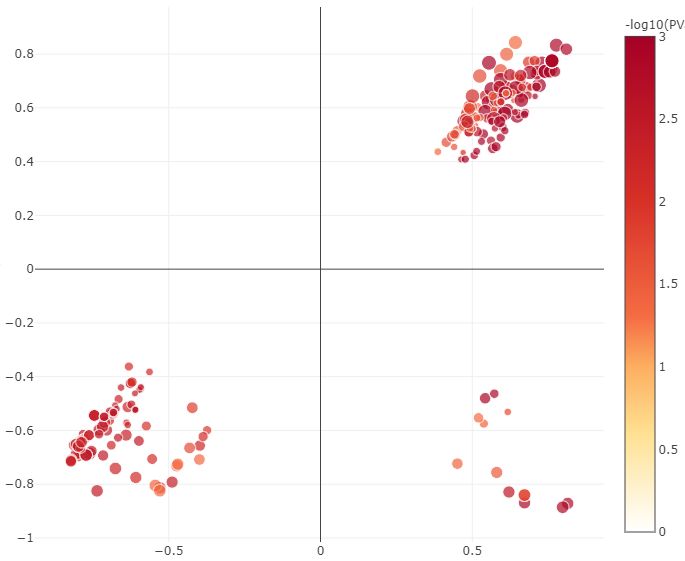
W214 Nucleic Acids Research, 2021, Vol. 49, Web Server issue

ACKNOWLEDGEMENTS                                                               12. Xie,C., Mao,X., Huang,J., Ding,Y., Wu,J., Dong,S., Kong,L.,
                                                                                   Gao,G., Li,C.-Y. and Wei,L. (2011) KOBAS 2.0: a web server for
We thank Dr T.F. Chan (The Chinese University of Hong                              annotation and identification of enriched pathways and diseases.
Kong, Shatin), Dr O. Fornes (The University of British                             Nucleic Acids Res., 39, W316–W322.
Columbia, Vancouver, BC), Dr D. Huang (Tianjin Medi-                           13. Mi,H., Ebert,D., Muruganujan,A., Mills,C., Albou,L.-P.,
                                                                                   Mushayamaha,T. and Thomas,P.D. (2020) PANTHER version 16: a
cal University, Tianjin), Dr H.S. Kwan (The Chinese Uni-                           revised family classification, tree-based classification tool, enhancer
versity of Hong Kong, Shatin), Dr M.J. Li (Tianjin Medi-                           regions and extensive API. Nucleic Acids Res., 49, D394–D403.
cal University, Tianjin), Dr S. Mostafavi (The University of                   14. Liao,Y., Wang,J., Jaehnig,E.J., Shi,Z. and Zhang,B. (2019)
British Columbia, Vancouver, BC), Dr W. Nong (The Chi-                             WebGestalt 2019: gene set analysis toolkit with revamped UIs and
nese University of Hong Kong, Shatin), Dr A.K. Walker                              APIs. Nucleic Acids Res., 47, W199–W205.
                                                                               15. Wadi,L., Meyer,M., Weiser,J., Stein,L.D. and Reimand,J. (2016)
(University of Massachusetts Medical School, Worcester,                            Impact of outdated gene annotations on pathway enrichment
MA), and Taubert lab members for critical comments on                              analysis. Nat. Methods, 13, 705–706.
the manuscript. Figure 1 and Graphical Abstract created                        16. Subramanian,A., Tamayo,P., Mootha,V.K., Mukherjee,S.,

                                                                                                                                                              Downloaded from https://academic.oup.com/nar/article/49/W1/W207/6279840 by guest on 24 September 2021
with BioRender.com, Toronto, Canada.                                               Ebert,B.L., Gillette,M.A., Paulovich,A., Pomeroy,S.L., Golub,T.R.,
                                                                                   Lander,E.S. et al. (2005) Gene set enrichment analysis: a
                                                                                   knowledge-based approach for interpreting genome-wide expression
FUNDING                                                                            profiles. Proc. Natl. Acad. Sci. U.S.A., 102, 15545–15550.
                                                                               17. Listopad,S.A. and Norden-Krichmar,T.M. (2019) A-Lister: a tool for
Canadian Institutes of Health Research (CIHR) [PJT-                                analysis of differentially expressed omics entities across multiple
153199, PJT-165988 to S.T.]; Natural Sciences and Engi-                            pairwise comparisons. BMC Bioinformatics, 20, 595.
neering Research Council of Canada (NSERC) [RGPIN-                             18. Lam,F., Lalansingh,C.M., Babaran,H.E., Wang,Z., Prokopec,S.D.,
                                                                                   Fox,N.S. and Boutros,P.C. (2016) VennDiagramWeb: a web
2018-05133 to S.T.]; Cancer Research Society (CRS) [22727                          application for the generation of highly customizable Venn and Euler
to S.T.]; J.Y. was supported partly by University of British                       diagrams. BMC Bioinformatics, 17, 401.
Columbia Edward Squires Memorial Fellowship; Y.L. was                          19. Khan,A. and Mathelier,A. (2017) Intervene: a tool for intersection
partly supported by BioTalent Canada. Funding for open                             and visualization of multiple gene or genomic region sets. BMC
                                                                                   Bioinformatics, 18, 287.
access charge: Canadian Institutes of Health Research                          20. Heberle,H., Meirelles,G.V., da Silva,F.R., Telles,G.P. and
(CIHR) [PJT-153199].                                                               Minghim,R. (2015) InteractiVenn: a web-based tool for the analysis
Conflict of interest statement. None declared.                                     of sets through Venn diagrams. BMC Bioinformatics, 16, 169.
                                                                               21. Lex,A., Gehlenborg,N., Strobelt,H., Vuillemot,R. and Pfister,H.
                                                                                   (2014) UpSet: visualization of Intersecting Sets. IEEE Trans. Vis.
REFERENCES                                                                         Comput. Graph., 20, 1983–1992.
 1. Wang,Z., Gerstein,M. and Snyder,M. (2009) RNA-Seq: a                       22. Rue-Albrecht,K., Marini,F., Soneson,C. and Lun,A.T.L. (2018) iSEE:
    revolutionary tool for transcriptomics. Nat. Rev. Genet., 10, 57–63.           Interactive SummarizedExperiment Explorer. F1000Research, 7, 741.
 2. Edgar,R., Domrachev,M. and Lash,A.E. (2002) Gene Expression                23. Seo,M., Yoon,J. and Park,T. (2015) GRACOMICS: software for
    Omnibus: NCBI gene expression and hybridization array data                     graphical comparison of multiple results with omics data. BMC
    repository. Nucleic Acids Res., 30, 207–210.                                   Genomics, 16, 256.
 3. Clough,E. and Barrett,T. (2016) The Gene Expression Omnibus                24. Davis,S. and Meltzer,P.S. (2007) GEOquery: a bridge between the
    database. Methods Mol. Biol. Clifton NJ, 1418, 93–110.                         Gene Expression Omnibus (GEO) and BioConductor.
 4. Dumas,J., Gargano,M.A. and Dancik,G.M. (2016) shinyGEO: a                      Bioinformatics, 23, 1846–1847.
    web-based application for analyzing gene expression omnibus                25. Robinson,M.D., McCarthy,D.J. and Smyth,G.K. (2010) edgeR: a
    datasets. Bioinforma. Oxf. Engl., 32, 3679–3681.                               Bioconductor package for differential expression analysis of digital
 5. Mahi,N.A., Najafabadi,M.F., Pilarczyk,M., Kouril,M. and                        gene expression data. Bioinformatics, 26, 139–140.
    Medvedovic,M. (2019) GREIN: an interactive web platform for                26. Ritchie,M.E., Phipson,B., Wu,D., Hu,Y., Law,C.W., Shi,W. and
    re-analyzing GEO RNA-seq data. Sci. Rep., 9, 7580.                             Smyth,G.K. (2015) limma powers differential expression analyses for
 6. Creixell,P., Reimand,J., Haider,S., Wu,G., Shibata,T., Vazquez,M.,             RNA-sequencing and microarray studies. Nucleic Acids Res., 43, e47.
    Mustonen,V., Gonzalez-Perez,A., Pearson,J., Sander,C. et al. (2015)        27. Wickham,H., Averick,M., Bryan,J., Chang,W., McGowan,L.D.,
    Pathway and network analysis of cancer genomes. Nat. Methods, 12,              François,R., Grolemund,G., Hayes,A., Henry,L., Hester,J. et al.
    615–621.                                                                       (2019) Welcome to the Tidyverse. J. Open Source Softw., 4, 1686.
 7. Zhou,Y., Zhou,B., Pache,L., Chang,M., Khodabakhshi,A.H.,                   28. Korotkevich,G., Sukhov,V. and Sergushichev,A. (2019) Fast gene set
    Tanaseichuk,O., Benner,C. and Chanda,S.K. (2019) Metascape                     enrichment analysis. bioRxiv doi: https://doi.org/10.1101/060012, 01
    provides a biologist-oriented resource for the analysis of systems-level       February 2021, preprint: not peer reviewed.
    datasets. Nat. Commun., 10, 1523.                                          29. Kolberg,L., Raudvere,U., Kuzmin,I., Vilo,J. and Peterson,H. (2020)
 8. Chen,E.Y., Tan,C.M., Kou,Y., Duan,Q., Wang,Z., Meirelles,G.V.,                 gprofiler2 – an R package for gene list functional enrichment analysis
    Clark,N.R. and Ma’ayan,A. (2013) Enrichr: interactive and                      and namespace conversion toolset g:Profiler. F1000Research, 9,
    collaborative HTML5 gene list enrichment analysis tool. BMC                    ELIXIR–709.
    Bioinformatics, 14, 128.                                                   30. Luo,W. and Brouwer,C. (2013) Pathview: an R/Bioconductor
 9. Huang,D.W., Sherman,B.T., Tan,Q., Collins,J.R., Alvord,W.G.,                   package for pathway-based data integration and visualization.
    Roayaei,J., Stephens,R., Baseler,M.W., Lane,H.C. and                           Bioinformatics, 29, 1830–1831.
    Lempicki,R.A. (2007) The DAVID gene functional classification tool:        31. Chen,H. and Boutros,P.C. (2011) VennDiagram: a package for the
    a novel biological module-centric algorithm to functionally analyze            generation of highly-customizable Venn and Euler diagrams in R.
    large gene lists. Genome Biol., 8, R183.                                       BMC Bioinformatics, 12, 35.
10. Raudvere,U., Kolberg,L., Kuzmin,I., Arak,T., Adler,P., Peterson,H.         32. Conway,J.R., Lex,A. and Gehlenborg,N. (2017) UpSetR: an R
    and Vilo,J. (2019) g:Profiler: a web server for functional enrichment          package for the visualization of intersecting sets and their properties.
    analysis and conversions of gene lists (2019 update). Nucleic Acids            Bioinforma. Oxf. Engl., 33, 2938–2940.
    Res., 47, W191–W198.                                                       33. Plaisier,S.B., Taschereau,R., Wong,J.A. and Graeber,T.G. (2010)
11. Alonso,R., Salavert,F., Garcia-Garcia,F., Carbonell-Caballero,J.,              Rank–rank hypergeometric overlap: identification of statistically
    Bleda,M., Garcia-Alonso,L., Sanchis-Juan,A., Perez-Gil,D.,                     significant overlap between gene-expression signatures. Nucleic Acids
    Marin-Garcia,P., Sanchez,R. et al. (2015) Babelomics 5.0: functional           Res., 38, e169.
    interpretation for new generations of genomic data. Nucleic Acids
    Res., 43, W117–W121.
Nucleic Acids Research, 2021, Vol. 49, Web Server issue W215
34. Kanehisa,M., Furumichi,M., Tanabe,M., Sato,Y. and Morishima,K. for annotation and visualization of Caenorhabditis elegans
(2017) KEGG: new perspectives on genomes, pathways, diseases and genome-scale data. Genetics, 214, 279–294.
drugs. Nucleic. Acids. Res., 45, D353–D361. 44. Ding,W., Higgins,D.P., Yadav,D.K., Godbole,A.A.,
35. Jassal,B., Matthews,L., Viteri,G., Gong,C., Lorente,P., Fabregat,A., Pukkila-Worley,R. and Walker,A.K. (2018) Stress-responsive and
Sidiropoulos,K., Cook,J., Gillespie,M., Haw,R. et al. (2020) The metabolic gene regulation are altered in low S-adenosylmethionine.
reactome pathway knowledgebase. Nucleic Acids Res., 48, PLoS Genet., 14, e1007812.
D498–D503. 45. Tenor,J.L. and Aballay,A. (2008) A conserved Toll-like receptor is
36. Martens,M., Ammar,A., Riutta,A., Waagmeester,A., Slenter,D.N., required for Caenorhabditis elegans innate immunity. EMBO Rep., 9,
Hanspers,K.A., Miller,R., Digles,D., Lopes,E.N., Ehrhart,F. et al. 103–109.
(2020) WikiPathways: connecting communities. Nucleic Acids Res., 46. Brandt,J.P. and Ringstad,N. (2015) Toll-like receptor signaling
49, D613–D621. promotes development and function of sensory neurons required for
37. Lieberman,N.A.P., Peddu,V., Xie,H., Shrestha,L., Huang,M.-L., a C. elegans pathogen-avoidance behavior. Curr. Biol. CB, 25,
Mears,M.C., Cajimat,M.N., Bente,D.A., Shi,P.-Y., Bovier,F. et al. 2228–2237.
(2020) In vivo antiviral host transcriptional response to SARS-CoV-2 47. Walker,A.K., Jacobs,R.L., Watts,J.L., Rottiers,V., Jiang,K.,
by viral load, sex, and age. PLoS Biol., 18, e3000849. Finnegan,D.M., Shioda,T., Hansen,M., Yang,F., Niebergall,L.J. et al.
Downloaded from https://academic.oup.com/nar/article/49/W1/W207/6279840 by guest on 24 September 2021
38. Jones,D.T. and Reed,R.R. (1989) Golf: an olfactory neuron (2011) A conserved SREBP-1/phosphatidylcholine feedback circuit
specific-G protein involved in odorant signal transduction. Science, regulates lipogenesis in metazoans. Cell, 147, 840–852.
244, 790–795. 48. Giese,G.E., Walker,M.D., Ponomarova,O., Zhang,H., Li,X.,
39. Trudeau,M.C. and Zagotta,W.N. (2003) Calcium/calmodulin Minevich,G. and Walhout,A.J. (2020) Caenorhabditis elegans
modulation of olfactory and rod cyclic nucleotide-gated ion channels. methionine/S-adenosylmethionine cycle activity is sensed and
J. Biol. Chem., 278, 18705–18708. adjusted by a nuclear hormone receptor. eLife, 9, e60259.
40. Mastrangelo,A., Bonato,M. and Cinque,P. (2021) Smell and taste 49. Love,M.I., Huber,W. and Anders,S. (2014) Moderated estimation of
disorders in COVID-19: from pathogenesis to clinical features and fold change and dispersion for RNA-seq data with DESeq2. Genome
outcomes. Neurosci. Lett., 748, 135694. Biol., 15, 550.
41. Ye,Q., Zhou,J., Yang,G., Li,R.-T., He,Q., Zhang,Y., Wu,S.-J., 50. Geistlinger,L., Csaba,G., Santarelli,M., Ramos,M., Schiffer,L.,
Chen,Q., Shi,J.-H., Zhang,R.-R. et al. (2020) SARS-CoV-2 infection Turaga,N., Law,C., Davis,S., Carey,V., Morgan,M. et al. (2020)
causes transient olfactory dysfunction in mice. bioRxiv doi: Toward a gold standard for benchmarking gene set enrichment
https://doi.org/10.1101/2020.11.10.376673, 10 November 2020, analysis. Brief. Bioinform., 22, 545–556.
preprint: not peer reviewed. 51. Paczkowska,M., Barenboim,J., Sintupisut,N., Fox,N.S., Zhu,H.,
42. Ding,W., Smulan,L.J., Hou,N.S., Taubert,S., Watts,J.L. and Abd-Rabbo,D., Mee,M.W., Boutros,P.C. and Reimand,J. (2020)
Walker,A.K. (2015) s-Adenosylmethionine levels govern innate Integrative pathway enrichment analysis of multivariate omics data.
immunity through distinct methylation-dependent pathways. Cell Nat. Commun., 11, 735.
Metab., 22, 633–645. 52. Fukushima,K. and Pollock,D.D. (2020) Amalgamated cross-species
43. Holdorf,A.D., Higgins,D.P., Hart,A.C., Boag,P.R., Pazour,G.J., transcriptomes reveal organ-specific propensity in gene expression
Walhout,A.J.M. and Walker,A.K. (2020) WormCat: an online tool evolution. Nat. Commun., 11, 4459.You can also read