2021 REAL-TIME ANALYSIS OF THE REVISIONS TO THE STRUCTURAL POSITION OF PUBLIC FINANCES - Banco de España
←
→
Page content transcription
If your browser does not render page correctly, please read the page content below
REAL-TIME ANALYSIS OF THE
REVISIONS TO THE STRUCTURAL                  2021
POSITION OF PUBLIC FINANCES

Documentos Ocasionales
N.º 2108

Pablo Burriel, Víctor González-Díez, Jorge
Martínez-Pagés and Enrique Moral-Benito
REAL-TIME ANALYSIS OF THE REVISIONS TO THE STRUCTURAL POSITION OF PUBLIC FINANCES
REAL-TIME ANALYSIS OF THE REVISIONS TO THE
STRUCTURAL POSITION OF PUBLIC FINANCES

Pablo Burriel, Víctor González-Díez, Jorge Martínez-Pagés
and Enrique Moral-Benito
BANCO DE ESPAÑA

Documentos Ocasionales. N.º 2108
March 2021
The Occasional Paper Series seeks to disseminate work conducted at the Banco de España, in the
performance of its functions, that may be of general interest.

The opinions and analyses in the Occasional Paper Series are the responsibility of the authors and, therefore,
do not necessarily coincide with those of the Banco de España or the Eurosystem.

The Banco de España disseminates its main reports and most of its publications via the Internet on its
website at: http://www.bde.es.

Reproduction for educational and non-commercial purposes is permitted provided that the source is
acknowledged.

© BANCO DE ESPAÑA, Madrid, 2021

ISSN: 1696-2230 (on-line edition)
Abstract

Estimating the role of the business cycle on the General Government budget balance plays
a key role on the real-time analysis of fiscal policy, especially under the Stability and Growth
Pact framework. This paper studies, for a group of EU countries and the United Kingdom,
the revisions in the structural balance estimated by the European Commission between
its first publication and the most recent figures. The results suggest that revisions were
negative (i.e. the budget balance measured ex-post is, on average, less favourable than
assessed in real time) and significant for the period prior to 2008, but relatively smaller for
later years. Overall, revisions are procyclical but negative on average. Furthermore, data
revisions (on public expenditure and revenues as well as GDP growth) are as important
as errors in estimating the unobservable potential GDP. According to these findings, the
structural efforts required by the EU framework were in general insufficient during the boom
up to 2008, since they were based on too optimistic estimates of the structural balances.
However, there is no evidence of similar real-time errors in the assessment of fiscal positions
during the crisis and the posterior recovery.

Keywords: public accounts, business cycle, real-time revisions.

JEL classification: H68, E32.
Resumen

La estimación de los efectos del ciclo económico sobre la capacidad de financiación de las
Administraciones Públicas desempeña un papel fundamental en el análisis de la política fiscal
en tiempo real, especialmente en el marco del Pacto de Estabilidad y Crecimiento (PEC).
Este artículo explora, para un conjunto de países de la UE y el Reino Unido, las revisiones
del saldo estructural estimado por la Comisión Europea entre su primera publicación y la
estimación actual. Los resultados sugieren que las revisiones son negativas y significativas
a lo largo del período anterior a 2008, pero relativamente menores a partir de entonces. Las
revisiones muestran un comportamiento procíclico, pero a la vez son negativas en media.
Asimismo, cambios en los datos publicados (gastos e ingresos públicos y crecimiento
del PIB) explican tanto o más que las revisiones en las estimaciones del PIB potencial.
De acuerdo con esta evidencia, las recomendaciones de política fiscal que emanaron del
PEC durante la expansión hasta 2008 estuvieron basadas en estimaciones excesivamente
optimistas del componente estructural del saldo fiscal, a la luz de las revisiones posteriores.
Sin embargo, durante la crisis y la posterior recuperación, dichas estimaciones no han
sufrido revisiones significativas.

Palabras clave: cuentas públicas, ciclo económico, revisiones en tiempo real.

Códigos JEL: H68, E32.
Contents

Abstract   5

Resumen      6

1   Introduction      8

2   Data and methodology        12

3   Decomposition of the revisions of the structural position   17

4   Fiscal policy implications   25

5   The Spanish case       29

6   Conclusions       34

References       35

Appendix     36
1       Introduction

                  In order to provide a proper evaluation of the fiscal position and the sustainability of public
                  finances it is essential to take into account the economy’s cyclical position and its effects
                  on public sector accounts. Increased (decreased) revenues and lower (higher) expenditures
                  during the cyclical upswing (downswing) can generate the illusion of a better (worse)
                  fiscal position compared to the true underlying situation. In fact, the positive correlation
                  between the public fiscal balance and the economy’s cyclical position (Chart 1) suggests
                  the presence of a strong cyclical component in fiscal positions which should not be taken
                  into account when assessing the fiscal position that determines the long run sustainability
                  of public finances.

                               How much of a public fiscal balance results from current cyclical position, and how
                  much results from fiscal policy per se? The cyclically adjusted balance is considered to be
                  a good indicator of the fiscal position. In particular, fiscal balances are adjusted for effects
                  related to the deviation between the levels of real gross domestic product and potential
                  output (known as output gap). However, subtracting the cyclical component of the budget
                  balance, calculated through the output gap, is not enough to reach an adequate assessment
                  of the fiscal position. The effect of other transitory factors should be subtracted as well.
                  Therefore, analysing the structural balance, which corrects for both the cyclical component
                  and the effect of non-recurrent elements (one-offs), is key to study the fiscal policy stance.
                  In sum, the structural balance can be obtained through a three-step process: (i) identification
                  and correction of one-offs; (ii) estimation of the cyclical component, multiplying the output
                  gap by the elasticity of the fiscal balance with respect to the economic cycle; (iii) subtraction
                  of the cyclical component calculated in (ii) from the fiscal balance corrected from one-offs
                  obtained in (i).1

                               Structural balances allow a better assessment of the fiscal position and thus fiscal
                  sustainability concerns. So, the comparison between the structural balance and a reference
                  point, such as the debt-stabilizing fiscal balance, shows to what extent the current fiscal
                  policy could be maintained without any government tax or public spending adjustment,
                  or the necessary fiscal effort in order to correct imbalances. In this sense, the structural
                  balance is the most accurate reference for fiscal policy, as it does include neither the effect
                  of the economic cycle nor the effect of non-recurrent elements, which are both temporary
                  and do not require any fiscal adjustment.

                               The EU fiscal rules framework and the initial Stability and Growth Pact (SGP) were
                  mainly focused on observed government balances. However, in the early 2000s, greater
                  emphasis was given to cyclically adjusted and structural measures, due, to a large extent,
                  to the controversy about public deficits in Germany and France exceeding the 3% of
                  GDP norm. Since then, the EU’s fiscal framework evolved towards the so-called second

                  1   See the Box 1.3 of Vademecum on the Stability and Growth Pact. 2019 Edition.

BANCO DE ESPAÑA       8   DOCUMENTO OCASIONAL N.º 2108
Chart 1
RELATIONSHIP BETWEEN GOVERNMENT TOTAL BALANCE AND THE CYCLICAL POSITION
8
6
Total balance (a) / GDP
4
2
0
-2
-4
R² = 0.4475
-6
-8
-10
-12
-15 -10 -5 0 5 10
Output Gap
SOURCE: European Commission.
NOTE: Greece and Ireland are excluded in order to avoid outliers.
a Net of non-recurrent elements.
generation fiscal rules, confirming the key role of structural balances in the Six-Pack and
Two-Pack reforms carried out at the beginning of 2010, together with other innovations,
such as the introduction of a net spending rule (see Eyraud et al., 2018).
In the SGP, the Medium Term Objective (MTO) works as a reference for the preventive
arm and it is defined in terms of structural balance. It is designed to allow automatic
stabilizers to act during booms as well as recessions, but without exceeding the limit of 3%
of GDP established by the Maastricht Treaty. Structural balances also play an important
role within the corrective arm of the pact, or excessive deficit procedure, since the required
annual fiscal adjustments to get the government deficit below the reference level of 3% of
GDP are defined in terms of changes in structural balances.
The structural balances’ adequacy to fulfil these objectives mainly depends on the
accuracy of the available data in real time, when decisions are taken, and not on revised
data which are published years later. In the case of large discrepancies, it could be argued
that real-time information about structural balances is too preliminary and thus more time is
required to measure accurately the real structural position of public finances. However, the
assessment of the situation of public finances needs to be done in real time. Therefore, a
detailed analysis of the ex-post revisions of real-time structural balance estimates is crucial
for a proper tracking and evaluation of fiscal policy.
The structural balance revisions can be decomposed into the revisions of the
total government balance (net of non-recurrent elements) and of the cyclical component.
Likewise, revisions of the latter can be due to revisions in real GDP and in potential GDP
BANCO DE ESPAÑA 9 DOCUMENTO OCASIONAL N.º 2108estimates.2 Therefore, identifying the relative contributions of all these elements to the total
revision, as well as their evolution over time, will allow to evaluate the suitability and stability
of real-time structural balance estimates as indicators of the current fiscal policy underlying
position and as long-term fiscal sustainability indices.
This paper dissects the revisions of structural balances estimated by the European
Commission in the context of the SGP framework between their first publication and the latest
data available for a set of 15 countries over the period 2003-2015. The results of the analysis
suggest that revisions are significant prior to the crisis (2003-2007), but relatively smaller
since then (2008-2015). In particular, the structural balance is revised downwards on
average by 0.55 pp of GDP during the whole period, but by 1.29 pp during the 2003-2007
boom and by only 0.09 pp afterwards. In line with previous analyses, we found that revisions
tend to be procyclical (in the sense of real-time errors in estimated structural balances
being correlated with the business cycle), but negative on average.3 However, contrary to
conventional wisdom, these revisions are only partially due to errors in real-time estimation
of unobservable variables, such as potential GDP. Indeed, both revisions in fiscal balances
and the strong procyclical pattern of revisions in real GDP growth are chiefly responsible for
the negative average real-time bias found. Fiscal data revisions are particularly notable in the
boom prior to the global financial crisis,4 but they seemed to have decreased significantly
later on. In turn, the growth of real GDP is typically revised upwards during booms and
downwards during recessions.
In terms of fiscal policy implications, the detailed analysis of the fiscal balances
across European countries suggests that the structural balance was clearly overestimated in
real time during the period before 2007, which implies a worse fiscal position than that initially
estimated in real time. This pattern accentuated the perception of the worsening in public
sector accounts during the following years and the magnitude of the required subsequent
correction, which was partially driven by the downward revision in structural balances with
respect to their initial real-time figures. However, in light of the smaller revisions observed for
the following years, the real-time assessment of fiscal positions in the aftermath of the global
financial crisis seems more appropriate, in particular given the dimension of the deterioration
of fiscal positions in some countries.
Finally, the Spanish case is analyzed in more detail, comparing the real-time series
with the current figures. Data broadly confirm the aforementioned results for the whole set
of countries. However, in Spain, the structural effort during the sovereign debt crisis (2011-
2013) was slightly greater to the one published in real time due to an underestimation of the
real GDP fall during those years.
2 evisions of the cyclical balance also include a component (residual) that includes variations in the GDP deflator and in
R
the elasticity of fiscal balance with respect to the cyclical position (see Appendix). The contribution of this residual to the
total revisions is, in general terms, close to zero.
3 he literature has mainly focused on the contribution of output gap revisions. See, for example, Kempkes (2014), Eyraud
T
et al. (2018) and Kangur et al. (2019) -for the average negative bias, and Hernández de Cos et al. (2016), Darvas et al.
(2018) and Coibion et al. (2018) -for the procyclicality or revisions.
4 As already found in González-Mínguez and Ulloa (2007).
BANCO DE ESPAÑA 10 DOCUMENTO OCASIONAL N.º 2108The remainder of the paper is organized as follows. Section 2 describes the data
and the methodology employed. Section 3 analyses the revisions of each of the public
sector balances, while section 4 describes the implications of such revisions for economic
policy recommendations. In section 5 we tackle the Spanish case. Finally, Section 6 provides
the main conclusions of the study.
BANCO DE ESPAÑA 11 DOCUMENTO OCASIONAL N.º 21082 Data and methodology
The database used was obtained from the publicly available information published by the
European Commission (EC), pertaining to 14 EU countries and the United Kingdom over
the period 2003-2019.5 Every Spring and Autumn, the European Commission Services
produce a new release with data and forecasts for a wide set of variables: GDP, output gap,
government fiscal balance (distinguishing between the cyclical component and the cyclically
adjusted balance), primary fiscal balance and structural balance. We collect information on
all releases since Spring 2000 until Autumn 2020. Thus, for each variable, country and year
(e.g., the structural balance of 2005 in the UK) we have a series of estimates of the same
variable, made at different points in time.
To avoid mixing forecast errors with data revisions, we ignore the former and focus
only on those years for which there is already an official estimate of fiscal and macroeconomic
data. The first official estimate of year t is released on Spring of t+1. This is what we call
real-time estimate.6 It includes not only observed data (e.g., GDP, fiscal balance), but also
the real-time estimates by the EC of non-observed variables, like the output gap or the
structural balance. We are interested here on revisions of these estimates of the structural
balance since the first real-time estimate at Spring of t+1. Then, the revision of the structural
balance is defined as the difference between the current estimate and the initial one, this is:
REVitSB = SB Lit − SB RT
it (1)
where REVitSB represents the structural balance revision of year t in country i, SB Lit is the
latest estimate of the structural balance for year t in country i, published in Autumn 2020,
and SB RT
it is the structural balance published in real time, i.e. the one published in Spring
of year t+1.7
As mentioned in the previous section, the European Commission estimates the
structural balance (SB) subtracting the cyclical balance (CB) and non-recurrent elements
(one-offs) from the fiscal balance. The cyclical balance is estimated multiplying the output
gap (estimated according to Havik et al., 2014) by the semi-elasticity of the budget balance
to the output gap. That semi-elasticity, in turn, is estimated weighing the corresponding
5 he EU countries are: Austria (AT), Belgium (BE), Germany (DE), Denmark (DK), Greece (EL), Spain (ES), Finland (FI),
T
France (FR), Ireland (IE), Italy (IT), Luxembourg (LU), Netherlands (NL), Portugal (PT) and Sweden (SE).
6 e are interested in revisions of real-time estimates of the structural balance because of their impact on real-time fiscal
W
policy recommendations. In the usual EC timetable, country recommendations for year t are made on the basis of
information up to Spring of t-1 and, thus, they are not based on data for year t but on forecasts. However, the impact
of this on the validity of our analysis is limited for two main reasons. First, forecasts for year t are conditional on data
available up to t-1, which is the information set that we consider. Second, recommendations are not based on purely
temporary factors, but on an assessment of the fiscal structural position of each country and the sustainability of its
public finances which typically do not change abruptly from one year to another. Thus, recommendations are largely
based on observed data, that we analyse, and less so on forecasts, that we do not analyse.
7 otice that revisions have different horizons, depending on the year. For example, the revision of 2003 data refers to the
N
difference between the current estimate for that year (in Autumn 2020) and the original estimate in Spring 2004, whereas
the revision of 2004 data is the difference between Autumn 2020 estimate and Spring 2005 estimate. Below, we show
evidence of how this affects revisions.
BANCO DE ESPAÑA 12 DOCUMENTO OCASIONAL N.º 2108semi-elasticities of each of the different sources of income (personal and business income
taxes, indirect taxes, social contributions and others) and expenditure (i.e. unemployment
benefits).8 Non-recurrent elements are changes in the budget balance with a significant size
(not lower than 0.1% of GDP), which are purely time-limited and non-recurrent. Examples of
non-recurrent elements include state-aid bailouts during the 2008-2012 crisis or revenues
derived from an exceptional tax amnesty. Because of its temporary nature, these kind of
measures do not affect the structural balance.9
Hereinafter, total balance will always be considered as corrected from non-recurrent
elements. Therefore, the structural balance is defined as the difference between the total
government balance (TB) and its cyclical component (CB):
SB kit = TB kit − CB kit (2)
All fiscal balances are typically presented as a percentage of GDP, to make them comparable
and easier to analyze. Hence, revisions should also be expressed as a percentage of GDP.
But then they will become affected by revisions in GDP itself. There are two effects
of GDP revisions here. First, as part of the output gap definition, revisions in GDP alter
the cyclical component of the fiscal deficit and therefore the structural balance. Second, as the
denominator in the ratio of fiscal balance to GDP, revisions in GDP alter the ratio without
any change in the numerator. We need to analyze the first effect, but we want to avoid the
second one.10 For that, we consider all fiscal variables expressed in national currency and
then divide them always by the latest estimate available of the GDP of the corresponding
year (Autumn 2020). In this way, GDP revisions that do not alter the output gap will not affect
our estimated revisions of fiscal balances to GDP. This also simplifies the analysis of the
decomposition of the structural balance revisions into their components.11,12
Structural balance revisions can be decomposed into revisions of total balance
(REVitTB ) and revisions of the cyclical balance CB
it , which are decomposed, in turn,
Y YPOT
into revisions of real GDP (REVkit ), revisions of real potential GDP it and a
residual that includes variations in the GDP deflator and the elasticity of total balance
with respect to the cyclical position of the economy.13 That is:
8 See Mourre et al. (2014).
9 he budget balance and the cyclically-adjusted balance are available for the whole sample, but the structural balance,
T
and consequently, non-recurrent elements, are not always available in AMECO. Hence, an assumption is needed in
those cases. For each country and year, when one-offs are not available in a given vintage, they are assumed to be
equal to the value in the closest previous vintage if available. Otherwise, they are assumed equal to zero.
10 or example, in the case of the UK, the total balance to GDP ratio for 2009 published in Spring 2010 was -11.5%.
F
The current estimate (Autumn 2020) of 2009 total balance to GDP ratio is -10.0% (+1.5pp revision). However, this
large positive revision does not reflect a much improved fiscal balance (the current estimate of 2009 public deficit in
UK, in monetary terms, is just 3% below the one estimated in Spring 2010), but a significant upward revision in the
denominator (nominal GDP was revised up by 11%, largely on account of the methodological change to ESA 2010,
carried out in 2014). At the same time, potential GDP was also revised up by 12%, meaning that the output gap and
the cyclical component barely changed.
11 See Appendix for further details.
12 In any case, the main results found here also apply when the analysis is done with the original fiscal to GDP ratios.
13 See Appendix.
BANCO DE ESPAÑA 13 DOCUMENTO OCASIONAL N.º 2108Chart 2
REVISIONS OF THE STRUCTURAL BALANCE AND ITS COMPONENTS PANEL A: MEAN (a)
1 STRUCTURAL BALANCE 2 TOTAL BALANCE (b)
1.6 1.6
1.4 1.4
1.2 1.2
1.0 1.0
0.8 0.8
0.6 0.6
0.4 0.4
0.2 0.2
0.0 0.0
Spr Spr Spr Spr Spr Spr Spr Spr Spr Spr Spr Spr Spr Spr Spr Spr Spr Spr Spr Spr Spr Spr Spr Spr Spr Spr Spr Spr Spr Spr
t+1 t+2 t+3 t+4 t+5 t+6 t+7 t+8 t+9 t+10 t+11 t+12 t+13 t+14 t+15 t+1 t+2 t+3 t+4 t+5 t+6 t+7 t+8 t+9 t+10 t+11 t+12 t+13 t+14 t+15
3 CYCLICAL BALANCE 4 REAL GDP
1.6 2.0
1.4 1.8
1.6
1.2
1.4
1.0 1.2
0.8 1.0
0.6 0.8
0.6
0.4
0.4
0.2 0.2
0.0 0.0
Spr Spr Spr Spr Spr Spr Spr Spr Spr Spr Spr Spr Spr Spr Spr Spr Spr Spr Spr Spr Spr Spr Spr Spr Spr Spr Spr Spr Spr Spr
t+1 t+2 t+3 t+4 t+5 t+6 t+7 t+8 t+9 t+10 t+11 t+12 t+13 t+14 t+15 t+1 t+2 t+3 t+4 t+5 t+6 t+7 t+8 t+9 t+10 t+11 t+12 t+13 t+14 t+15
5 POTENTIAL GDP 6 RESIDUAL (c)
2.0 1.6
1.8 1.4
1.6
1.2
1.4
1.2 1.0
1.0 0.8
0.8 0.6
0.6
0.4
0.4
0.2 0.2
0.0 0.0
Spr Spr Spr Spr Spr Spr Spr Spr Spr Spr Spr Spr Spr Spr Spr Spr Spr Spr Spr Spr Spr Spr Spr Spr Spr Spr Spr Spr Spr Spr
t+1 t+2 t+3 t+4 t+5 t+6 t+7 t+8 t+9 t+10 t+11 t+12 t+13 t+14 t+15 t+1 t+2 t+3 t+4 t+5 t+6 t+7 t+8 t+9 t+10 t+11 t+12 t+13 t+14 t+15
2003-05 2006-08 2009-11 2012-14 2015-17
SOURCE: Own calculations based on European Commission data.
a Mean absolute revision at different horizons, for all countries and group of years, expressed as a percentage of each year GDP estimated at Autumn
2020.
b Net of non-recurrent elements.
c Change in cyclical balance not explained by real GDP or potential GDP.
BANCO DE ESPAÑA 14 DOCUMENTO OCASIONAL N.º 2108Chart 2 (Con't)
REVISIONS OF THE STRUCTURAL BALANCE AND ITS COMPONENTS PANEL B: MEDIAN (a)
1 STRUCTURAL BALANCE 2 TOTAL BALANCE (b)
1.4 1.4
1.2 1.2
1.0 1.0
0.8 0.8
0.6 0.6
0.4 0.4
0.2 0.2
0.0 0.0
Spr Spr Spr Spr Spr Spr Spr Spr Spr Spr Spr Spr Spr Spr Spr Spr Spr Spr Spr Spr Spr Spr Spr Spr Spr Spr Spr Spr Spr Spr
t+1 t+2 t+3 t+4 t+5 t+6 t+7 t+8 t+9 t+10 t+11 t+12 t+13 t+14 t+15 t+1 t+2 t+3 t+4 t+5 t+6 t+7 t+8 t+9 t+10 t+11 t+12 t+13 t+14 t+15
3 CYCLICAL BALANCE 4 REAL GDP
1.4 1.6
1.2 1.4
1.2
1.0
1.0
0.8
0.8
0.6
0.6
0.4
0.4
0.2 0.2
0.0 0.0
Spr Spr Spr Spr Spr Spr Spr Spr Spr Spr Spr Spr Spr Spr Spr Spr Spr Spr Spr Spr Spr Spr Spr Spr Spr Spr Spr Spr Spr Spr
t+1 t+2 t+3 t+4 t+5 t+6 t+7 t+8 t+9 t+10 t+11 t+12 t+13 t+14 t+15 t+1 t+2 t+3 t+4 t+5 t+6 t+7 t+8 t+9 t+10 t+11 t+12 t+13 t+14 t+15
5 POTENCIAL GDP 6 RESIDUAL (c)
1.6 1.6
1.4 1.4
1.2 1.2
1.0 1.0
0.8 0.8
0.6 0.6
0.4 0.4
0.2 0.2
0.0 0.0
Spr Spr Spr Spr Spr Spr Spr Spr Spr Spr Spr Spr Spr Spr Spr Spr Spr Spr Spr Spr Spr Spr Spr Spr Spr Spr Spr Spr Spr Spr
t+1 t+2 t+3 t+4 t+5 t+6 t+7 t+8 t+9 t+10 t+11 t+12 t+13 t+14 t+15 t+1 t+2 t+3 t+4 t+5 t+6 t+7 t+8 t+9 t+10 t+11 t+12 t+13 t+14 t+15
2003-05 2006-08 2009-11 2012-14 2015-17
SOURCE: Own calculations based on European Commission data.
a Median absolute revision at different horizons, for all countries and group of years, expressed as a percentage of each year GDP estimated at
Autumn 2020.
b Net of non-recurrent elements.
c Change in cyclical balance not explained by real GDP or potential GDP.
BANCO DE ESPAÑA 15 DOCUMENTO OCASIONAL N.º 2108REVitSB = REVitTB − REVitCB (3)
POT
REVitCB = REVitY − REVitY + Residual itCB (4)
Where all revisions are expressed as a percentage of the current estimate of the GDP of the
corresponding year.
To have an idea of how large are the revisions of the real-time estimate of the
structural balance and their timing, Chart 2 shows the average size (in absolute terms) of
the revisions of each component in our sample, from the first real-time estimate (at Spring
of t+1) to different horizons. Specifically, the mean (Panel A) and the median (Panel B) for the
whole sample of countries and several 3-year periods are represented. As it can be seen,
revisions vary across years and there is still not enough history for the latter years. However,
the evidence indicates that the structural balance continues to be revised many years
after the first publication of data, although revisions tend to be larger in earlier years. Overall,
revisions close to or larger than 1% of GDP are not uncommon.
BANCO DE ESPAÑA 16 DOCUMENTO OCASIONAL N.º 21083 Decomposition of the revisions of the structural position
In analyzing the factors behind structural balance revisions, there is a trade-off. Since the
structural balance continues to be revised many years into the future, if we want to be relatively
sure that our current estimate is close to the final one, we can only analyze years that are far into
the past. This limits the size of the sample and makes results dependent on particular events that
may have happened in those years. If we want a larger sample, we must accept that our data will
continue to be revised (with possible effects on the results) in future years. Given the evidence
presented in Chart 2, we think a good compromise is to focus on years which have at least 5
years of data revisions. This means using the sample period 2003-2015.14
For those years and the whole sample of countries studied, the structural balance that
was initially published was revised downwards on average. The Panel A of Table 1 shows
that both the mean and median revisions for all the countries as a whole are negative. Specifically,
the average revision of the structural balance is -0.55 pp of GDP, and the median revision is -0.43
pp (column 1). To put it into context, these average revisions are of the same order of magnitude
than the annual structural effort required by the SGP under normal conditions, which is 0.50 pp
of GDP. This confirms previous results that real-time estimates of the structural balance tend
to be biased upwards, leading to an over-optimistic assessment of the fiscal position and the
sustainability of public finances in the EU countries.15
Nonetheless, as it is shown in the Panels B and C of Table 1, these downwards ex-
post revisions are mainly due to the period prior to the financial crisis of 2008. Specifically, the
corresponding mean (median) revision for the period 2003-2007 is -1.29 pp (-1.12 pp). On
the contrary, since 2008, the mean (median) revision was much smaller, -0.09pp (-0.21 pp). This
is also evident in the first panel of Chart 3.
Regarding the decomposition of the revisions, Table 1 (columns 2 and 3 of Panel A)
shows that they do not come only from the well-known uncertainty about the cyclical component
(output gap) in real-time, but also from the downward revisions of the initially-published total
government balance figures. Concretely, the mean (median) revisions of the total balance and
the cyclical balance are -0.27 pp (-0.12 pp) and 0.29 pp (0.31 pp), respectively. Both negative
revisions of the total balance and positive revisions of the cyclical balance contribute to a more
negative estimate of the structural balance.16
Revisions of the total balance were also much larger in the expansionary years prior
to the crisis of 2008 than in the period after. Specifically, the mean (median) revision during
2003-2007 is -0.48 pp (-0.15 pp), while it is -0.13 pp (-0.12 pp) from 2008 to 2015.17 18
14 otice that the sample refers to the years analysed, not to the dates at which data were published. We use all releases
N
available referring to the sample years selected.
15 See, for example, Kempkes (2014), Eyraud et al. (2018) and Kangur et al. (2019).
16 iven a fiscal balance, a higher cyclical balance implies that the structural component is lower, that is, a worse position
G
of the public finances in comparison with the one initially estimated.
17 See also upper-right panel of Chart 3.
18 imilar figures are found for the total balance without the correction of non-recurrent elements (see last column in
S
Table 1).
BANCO DE ESPAÑA 17 DOCUMENTO OCASIONAL N.º 2108Table 1
DESCRIPTIVE STATISTICS OF THE REVISIONS OF THE STRUCTURAL BALANCE AND ITS COMPONENTS (a)(b)
Revisions of: Memo item
GDPPOT
SB TB (c) CB GDP contr. Residual
contr. TB
(1) (2) (3) (4) (6)
(5)
PANEL A: 2003 - 2015
min -5.89 -5.32 -3.03 -3.14 -2.88 -1.20 -5.32
mean -0.55 -0.27 0.29 0.27 -0.09 -0.08 -0.35
p10 -1.91 -1.04 -0.64 -0.62 -1.30 -0.42 -1.53
p25 -1.14 -0.45 -0.16 -0.11 -0.63 -0.13 -0.50
p50 -0.43 -0.12 0.31 0.31 -0.10 -0.02 -0.08
PANEL B: 2003 - 2007
PANEL C: 2008 - 2015
SOURCE: Own calculations based on European Commission data.
a All variables are expressed as a ratio over the GDP estimated in Autumn 2020.
b For the mean and only for the mean: (1)=(2)-(3) and (3)=(4)-(5)+(6).
c Net of non-recurrent elements.
However, Chart 4 shows that this pattern is not general across countries, which explains
why the difference between subperiods almost disappears when calculated in terms
of the median. Downward revisions for the period before 2008 are particularly high in
Greece, Portugal, Belgium and Austria. They are smaller for the other countries, with
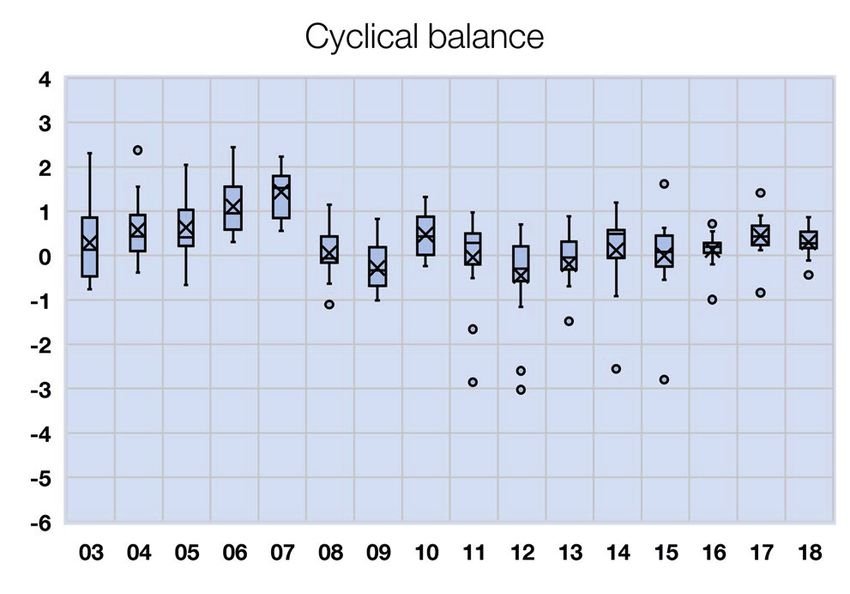
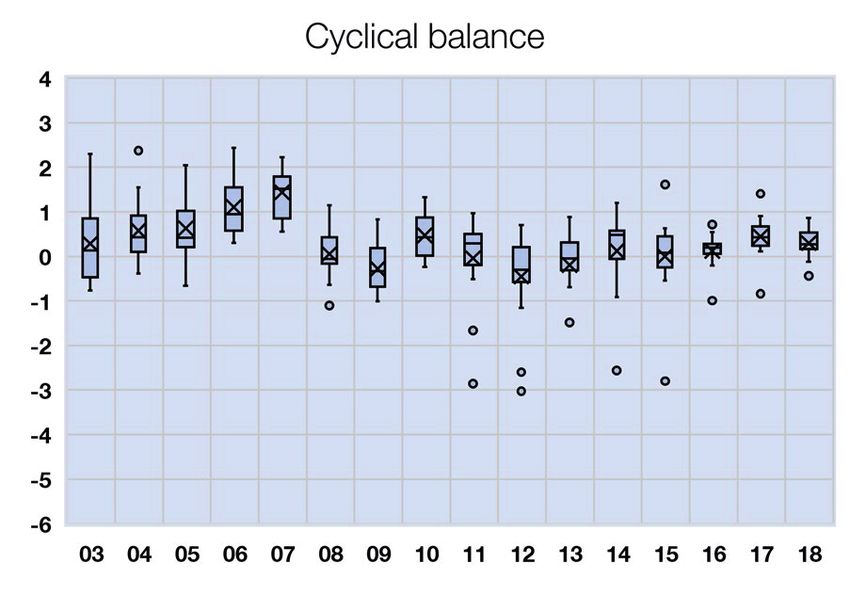
BANCO DE ESPAÑA 18 DOCUMENTO OCASIONAL N.º 2108Chart 3
DECOMPOSITION OF THE REVISIONS OF THE STRUCTURAL BALANCE BY YEAR
x MEAN - MAX / MIN QUARTILE OUTLIER
SOURCE: Own calculations based on European Commission data.
a Net of non-recurrent elements.
the exception of Luxembourg, where the balance is revised upwards. In the post-crisis
period, the revisions also tend to be negative, although the magnitude is clearly lower
than before.
Turning to the cyclical balance, its average revision is 0.29 pp of GDP upwards
and the median is 0.31 pp (see column 3 of Table 1), thus contributing to the overvaluation
of the position of public finances in real time. However, once again, revisions occur mainly
in the expansionary years prior to 2008. Concretely, the mean (median) revision of the
cyclical balance is 0.81 pp (0.74 pp) for the period 2003-2007 and -0.04 pp (0.07) for the period
2008-2015.19
The revisions of the estimated real-time cyclical balances suggest a strong
procyclical behavior, that translates also into structural balance revisions. Thus, the
cyclical (structural) balance tend to be revised upwards (downwards) during the years
19 See also lower panel of Chart 3.
BANCO DE ESPAÑA 19 DOCUMENTO OCASIONAL N.º 2108Chart 4
AVERAGE REVISION OF THE TOTAL GOVERNMENT BALANCE (a) BY SUB-PERIOD AND BY COUNTRY
2
1
0
-1
-2
-3
-4
Pool AT BE DE DK EL ES FI FR IE IT LU NL PT SE UK
2003-2007 2008-2015
SOURCE: Own calculations based on European Commission data.
a Net of non-recurrent elements.
Table 2
CORRELATIONS BETWEEN REVISIONS AND BUSINESS CYCLE (2003-2015)
Revisions of:
Structural
balance
Real GDP growth -0.345*** 0.048 0.542*** 0.448*** -0.043 0.016
SOURCE: Own calculations based on European Commission data.
NOTE: * pChart 5
IMPACT OF GDP GROWTH ON THE REVISION OF THE CYCLICAL BALANCE (2003-2015)
3
2
1
CB revision
0
-1
CB Rev = 0.076 + 0.195 GDP_growth
-2 (0.060) (0.022***)
-3 R² = 0.29
Obs: 194
-4
-10 -8 -6 -4 -2 0 2 4 6 8
Real-time real GDP growth
GDP GROWTH > 0 GDP GROWTH < 0
SOURCE: Own calculations based on European Commission data.
NOTE: * pChart 6
AVERAGE REVISION OF THE CYCLICAL BALANCE (2003-2015)
1 BY GDP GROWTH AND COUNTRY
2
1
0
-1
-2
-3
POOL AT BE DE DK EL ES FI FR IE IT LU NL PT SE UK
REAL GDP GROWTH < 0 REAL GDP GROWTH > 0
2 BY OUTPUT GAP AND COUNTRY
3
2
1
0
-1
-2
-3
POOL AT BE DE DK EL ES FI FR IE IT LU NL PT SE UK
OUTPUT GAP < 0 OUTPUT GAP > 0
SOURCE: Own calculations based on European Commission data.
beginning of expansions. Thus, the highest real-time errors in this variable happened around
turning points in the business cycle (i.e., 2007 and 2014 in our sample), which is consistent
with the fact that estimates of potential GDP rely heavily on expected future growth rates
and these are more difficult to predict precisely around turning points. As an illustration, the
correction in 2007 was particularly large. Chart 8 shows that, across countries, there is a
positive relationship between the fall in average real GDP growth after 2007 and the size of
the downward revision of the level of potential GDP in that year.
The real-time measurements of real GDP also suffer non-negligible revisions (see
upper-right panel of Chart 7). These are positively correlated with the business cycle.
In expansions, when real GDP is growing, it tends to be revised upwards, whereas in
contractions, when real GDP is falling, it tends to be revised downwards. As Chart 9
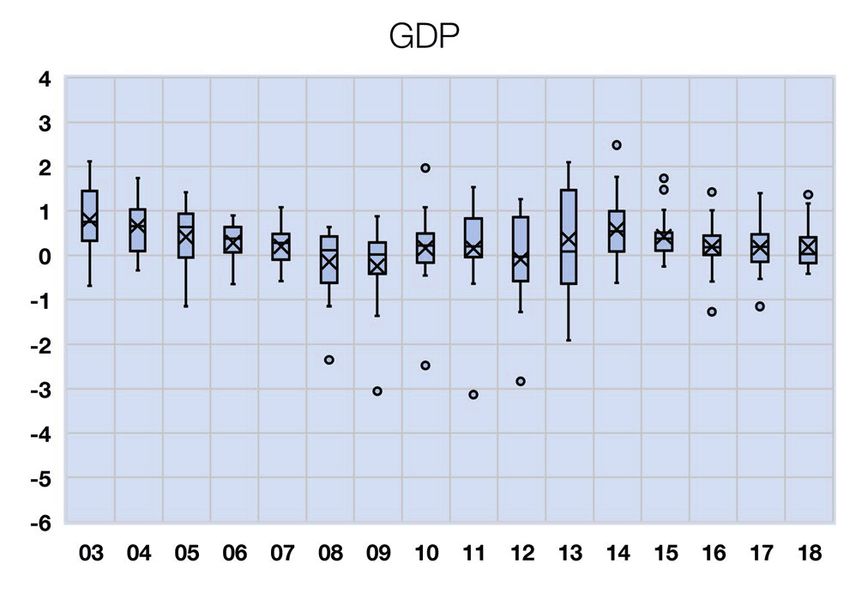
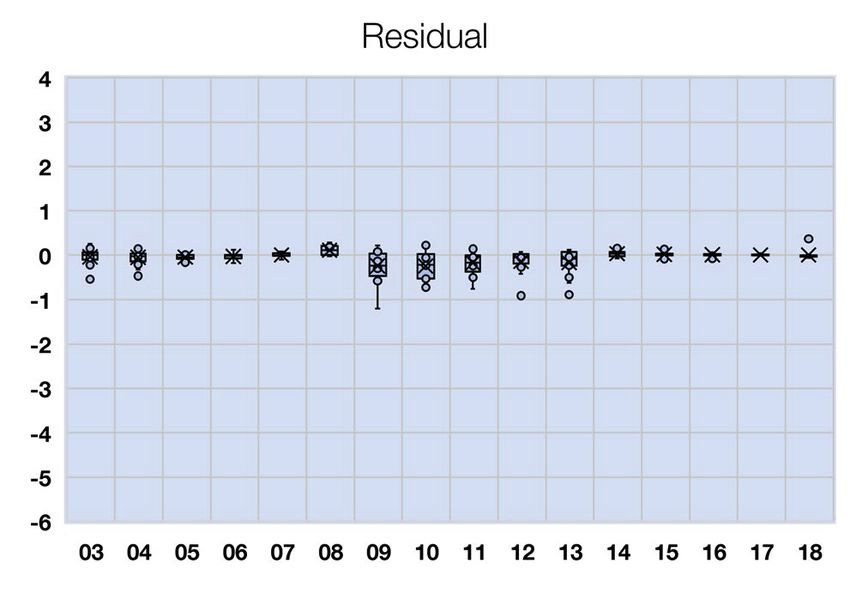
BANCO DE ESPAÑA 22 DOCUMENTO OCASIONAL N.º 2108Chart 7
DECOMPOSITION OF THE REVISIONS OF THE CYCLICAL BALANCE BY YEAR
x MEAN - MAX / MIN QUARTILE OUTLIER
SOURCE: Own calculations based on European Commission data.
shows, there is considerable country heterogeneity, but the underestimation of real GDP
expansions occurs in all countries in our sample except Greece. Since real GDP trends
upwards on average, this introduces a long term bias in real-time estimates of the cyclical
and structural balances (see Table 1).
To sum up, the negative average revision of real-time structural balances (which
means a worse fiscal position than initially estimated) is explained by a combination
of worse figures for total fiscal balances in some countries and upward revisions in
real GDP. To be more concrete, although both real GDP and potential GDP are revised
procyclically (upwards during expansions and downwards during contractions), potential
GDP revisions happened mainly around turning points and offset each other, showing
no systematic bias in the whole period considered (2003-2015). However, real GDP is
typically revised upwards when GDP is growing and since it grows in the long term this
means there is a positive average revision in the long term. These results are mainly
BANCO DE ESPAÑA 23 DOCUMENTO OCASIONAL N.º 2108Chart 8
REVISION OF THE 2007 POTENTIAL GDP AND AVERAGE CHANGE IN REAL GDP GROWTH BY COUNTRY
0
AT NL DE
BE
-1 SE
Revision of 2007 potential GDP (a)
PT FR
UK
-2
-3 FI IT
IE
-4 ES DK
-5 EL
-6
LU
-7
-9 -8 -7 -6 -5 -4 -3 -2 -1 0
Change in average GDP growth after 2007 (b)
SOURCE: Own calculations based on European Commission data.
a Current estimate of potential GDP in 2007 minus estimate in real-time (Spring 2008), in percentage of GDP.
b Average real GDP growth in 2008-15 minus average real GDP growth in 2003-07, in percentage.
Chart 9
AVERAGE REVISION OF REAL GDP BY INITIAL ESTIMATE OF REAL GDP GROWTH AND BY COUNTRY (2003-2015)
4
2
0
-2
-4
-6
POOL AT BE DE DK EL ES FI FR IE IT LU NL PT SE UK
REAL-TIME REAL GDP GROWTH < 0 REAL-TIME REAL GDP GROWTH > 0
SOURCE: Own calculations based on European Commission data.
driven by the expansionary years of 2003-2007. To the extent that this period can be
considered exceptional, these results should be taken with caution.
BANCO DE ESPAÑA 24 DOCUMENTO OCASIONAL N.º 21084 Fiscal policy implications
Public debt sustainability depends on the current level of debt and current and future values
of the fiscal balance. In the absence of new measures, the fiscal balance would tend towards
its structural level, as transitory factors (including the cyclical component) are expected to
cancel out and vanish in the long run. This is why the sustainability of public finances is
usually evaluated in terms of the structural balance. In this way, the Stability and Growth
Pact establishes a medium-term objective (MTO), for the structural balance of each country,
that guarantees debt sustainability. Deviations of the observed structural balance from the
aforementioned MTO determine whether fiscal policy needs to be adjusted, by introducing
measures either on the revenue or the expenditure side. On that basis, the European
Commission and the European Council issue recommendations that determine the design
of fiscal policy of member states.
Since these recommendations are made in real-time, they depend on real-time
estimates of structural balances. The existence of significant revisions implies that fiscal
policy recommendations which were considered as appropriate in real-time, may turn out to
be inappropriate later on when data and estimates are revised. The following is an overview
of the evolution of fiscal policy recommendations in EU countries from 2003 to 2019 through
the lens of the structural balance revisions.
Chart 10 plots the simple average, across the 15 countries analyzed, of the real-
time and latest estimates of the structural balance and its components. During the period
prior to the financial crisis of 2008 (2003-2007) real-time estimates of the structural balance were
generally close to zero (although not in every case). Therefore, overall, no fiscal consolidation
measures were considered necessary. Ex-post, those estimates were revised down by 1.3 pp
of GDP on average, oscillating from 0.0 pp in the case of Germany to -4.5 pp in Greece
(see Chart 11). Firstly, government deficits during the boom turned out to be significantly
greater afterwards in some countries (especially in Greece and Portugal). Secondly, the great
economic expansion during those years was underestimated in real time in the majority of
countries according to the posterior upward GDP revisions. Finally, as shown in Chart 8,
in those countries where growth was particularly high, the structural side of the expansion
was overestimated (potential growth) and the cyclical component of the expansion was
underestimated. Therefore, ex post, it can be said that the assessment of fiscal positions made
at the time was too optimistic, which prevented governments from adopting additional measures.
In Autumn 2008, when the financial crisis started to impact economic growth, the
latest estimate of the structural balance for 2007 in the 15 countries in our sample was close
to zero on average (-0.3% of GDP),21 with only five countries (Greece, UK, France, Portugal
and Italy) below -1.5%. Thus, theoretically, there was enough space for fiscal impulses to
offset negative economic developments. In fact, between 2008 and 2009 there was a fiscal
21 Slightly revised down from the 0.2% estimated in Spring 2008 (real-time estimate, in our definition).
BANCO DE ESPAÑA 25 DOCUMENTO OCASIONAL N.º 2108Chart 10
EVOLUTION OF THE STRUCTURAL BALANCE AND ITS COMPONENTS (SIMPLE AVERAGE OF 14 EU COUNTRIES PLUS UK)
1 STRUCTURAL BALANCE 2 TOTAL BALANCE (a)
1 1
0 0
-1 -1
-2 -2
-3 -3
-4 -4
-5 -5
-6 -6
-7 -7
03 04 05 06 07 08 09 10 11 12 13 14 15 16 17 18 19 03 04 05 06 07 08 09 10 11 12 13 14 15 16 17 18 19
3 CYCLICAL BALANCE 4 REAL GDP (b)
3 120
2
115
1
0 110
-1
105
-2
100
-3
-4 95
-5
90
-6
-7 85
03 04 05 06 07 08 09 10 11 12 13 14 15 16 17 18 19 03 04 05 06 07 08 09 10 11 12 13 14 15 16 17 18 19
5 POTENTIAL GDP (b) 6 OUTPUT GAP
120 6
115 4
110
2
105
0
100
-2
95
90 -4
85 -6
03 04 05 06 07 08 09 10 11 12 13 14 15 16 17 18 19 03 04 05 06 07 08 09 10 11 12 13 14 15 16 17 18 19
SPRING t+1 AUTUMN 2020
SOURCE: Own calculations based on European Commission data.
a Net of non-recurrent elements.
b Real GDP and potential GDP are rescaled to 100 = last estimate of 2010 real GDP.
BANCO DE ESPAÑA 26 DOCUMENTO OCASIONAL N.º 2108Chart 11
REVISION OF THE STRUCTURAL BALANCE BY COUNTRY
4
2
0
-2
-4
-6
POOL AT BE DE DK EL ES FI FR IE IT LU NL PT SE UK
2003-2007 2009-2013
SOURCE: Own calculations based on European Commission data.
impulse of around 3% of GDP on average, according to the current estimate of the change
in the structural balance in those years. This together with automatic stabilizers (for example,
lower revenues due to the fall in economic activity and spending rises due to unemployment
benefits), led to a 6 pp deterioration in the average total balance (see upper-right panel in
Chart 10).
In Spring 2010, the effects of the crisis, the approved stimulus and the new
estimates of structural balances revealed the sustainability problems of public finances in
some countries. On average, the 2009 structural balance was estimated at -4.3% of GDP
then, with five countries (Greece, Ireland, Spain, UK and Portugal) exceeding -7%. This led
to the implementation of important fiscal adjustment measures in countries such as Greece,
Spain, Ireland, Italy and Portugal. Overall, the structural deficit was reduced by 3 pp of GDP,
between 2010 and 2013, in our sample.
In this sense, it has been argued that the application of budgetary stability rules in
the EU, together with real-time unobservable measures, contributed to a more contractionary
fiscal policy than desirable during the sovereign debt crisis in the euro area (see for example
Fatas [2019] and Tooze [2019]). Decisions were influenced by many factors, including the
absence of a common fiscal policy for the EU as a whole that complicated the response
to a crisis with, as opposed to the later Covid19 crisis, very heterogeneous effects across
countries. While the discussion about the adequacy of the fiscal consolidation undertaken in
EU countries is beyond the scope of this paper, we just want to check whether errors in real-
time estimates contributed or not to a possibly excessive fiscal tightening in those years.
This would be correct if the estimated real-time structural balances were revised upwards
later on (indicating that fiscal positions were not as bad as initially considered). In this sense,
the evidence presented in Chart 11 is that revisions of 2009-2013 data were not significant,
in general. Of the five countries (Greece, Spain, Ireland, Italy and Portugal) that undertook an
BANCO DE ESPAÑA 27 DOCUMENTO OCASIONAL N.º 2108extraordinary fiscal tightening during those years, only the first two show an upward revision
in structural balances and this was of a relatively minor size (1% of GDP) compared to the
value of structural deficits in 2009 (14.6%, in Greece, and 8.7%, in Spain).22
After 2013, the pace of fiscal tightening moderated in our sample and revisions
of real-time data were minor, with the exception of the years 2017-2018. Those were years of
economic expansion and structural balances were again revised downwards. However, it is
too early to draw conclusions on these years, since, according to the evidence, there may
still be additional future revisions.
22 atas (2019) suggests that the absence of an upward revision of 2009-2013 structural balances is the result of
F
hysteresis effects. According to this, contractionary fiscal policy in those years would have led to a permanent
deterioration in output compared to what would have happened otherwise. Thus, lower potential GDP estimated in real
time would have being validated ex post only because of these hysteresis effects caused by excessively contractionary
fiscal policy. Ten years after the contractionary period, this hypothesis requires very strong hysteresis effects.
BANCO DE ESPAÑA 28 DOCUMENTO OCASIONAL N.º 21085 The Spanish case
In this section we analyze in detail the evolution of the Spanish public accounts in the last
two decades, comparing again the real-time information released in Spring of the year
immediately after (t+1) with the current available data for each year t (published in Autumn
2020). As in the previous Section, in Chart 12, the information provided in the biannual
European Commission economic forecasts is plotted for the total government balance
and its components (structural balance and cyclical balance), and the output gap and its
components (GDP and potential GDP).
Regarding the available information in real time, the high dynamism of the economy
and the tax bases during the years prior to the 2008 crisis led to a rise in public revenues and
to a correction of the financial needs of the public sector. Therefore, the Spanish economy
shifted from a fiscal balance in 2003-2004 to a fiscal surplus during the three years prior to
the crisis, which reached 2.2 pp of GDP in 2007. These figures were far from the fiscal deficit
limit of 3% set by the Stability and Growth Pact. At the same time, high real-time estimates of
potential GDP (influenced by the strong and sustained real growth of those years) made that
the cyclical expansion translated only into a modest improvement of the output gap, which
rose from -1.8% of GDP in 2003 to -0.4% in 2007. Consequently, the cyclical component of
the government fiscal balance remained negative (-0.7% of GDP in 2003 and -0.2% in 2007)
and all the observed fiscal surplus was considered structural. In the light of this evolution, at
the time, Spain was considered to have the necessary fiscal space to counteract the negative
impact on aggregate demand induced by the financial crisis.23
In fact, Spain’s first line of response to the financial crisis was similar to that of other
countries. Given that public finances in Spain were judged to be significantly robust at the
beginning of the crisis, the available resources were considered to be enough to carry out fiscal
stimulus measures. Hence, the government announced a set of stimulus packages aimed at
pushing demand up, complementing the European Central Bank’s (ECB) monetary policy. The
plan included, among other measures, a tax reimbursement of €400 per taxpayer and a fund
aimed at stimulating investment by the local authorities (State Fund for Local Public Investment),
which began to be used in the second quarter of 2009. It also included tax cuts (Personal
Income Tax and Corporate Tax, as well as the elimination of the property tax) and spending
measures to support specific industries (cars, tourism and SMEs). In addition, the deterioration
of the macroeconomic conditions, clearly reflected in the output gap reduction to -3.6% in 2009,
activated the automatic stabilizers (as demonstrated by the drop in the tax bases and the rise
in the unemployment benefits). This led to an increase in the cyclical deficit to 1.5%. Finally,
considering all these changes, the government fiscal balance laid at -10.3% of GDP in 2009.
In 2009, in view of the significant deterioration of public finances in the majority
of EU countries, the European Commission changed the emphasis of recommendations
23 egarding the public debt, it decreased by 22 percentage points between 2000 and 2007, when it reached 35.8 % of
R
GDP, one of the lowest levels then in the European Union.
BANCO DE ESPAÑA 29 DOCUMENTO OCASIONAL N.º 2108Chart 12
EVOLUTION OF THE STRUCTURAL BALANCE AND ITS COMPONENTS IN SPAIN
1 STRUCTURAL BALANCE 2 TOTAL BALANCE (a)
4 4
2 2
0 0
-2 -2
-4 -4
-6 -6
-8 -8
-10 -10
-12 -12
03 04 05 06 07 08 09 10 11 12 13 14 15 16 17 18 19 03 04 05 06 07 08 09 10 11 12 13 14 15 16 17 18 19
3 CYCLICAL BALANCE 4 REAL GDP (b)
4 115
2
110
0
105
-2
100
-4
95
-6
90
-8
-10 85
-12 80
03 04 05 06 07 08 09 10 11 12 13 14 15 16 17 18 19 03 04 05 06 07 08 09 10 11 12 13 14 15 16 17 18 19
5 POTENTIAL GDP (b) 6 OUTPUT GAP
110 6
4
105
2
100 0
-2
95
-4
90 -6
-8
85
-10
80 -12
03 04 05 06 07 08 09 10 11 12 13 14 15 16 17 18 19 03 04 05 06 07 08 09 10 11 12 13 14 15 16 17 18 19
AUTUM 2020 SPRING t+1
SOURCE: Own calculations based on European Commission data.
a Net of non-recurrent elements.
b Real GDP and potential GDP are rescaled to 100 = last estimate of 2010 real GDP.
for the forthcoming years, from stimulus to fiscal austerity, and launched Excessive Debt
Procedures in most countries. In the case of Spain, a correction of the excessive deficit
(that was expected to reach 11.2% of GDP) was requested for years 2010-2013. The 2009-
2013 Stability Program Update (SPU) of the Spanish Government already included several
adjustment measures, which were later incorporated into the 2010 Budget Law. Nonetheless,
BANCO DE ESPAÑA 30 DOCUMENTO OCASIONAL N.º 2108during the first semester of 2010, stimulus measures were still being applied.24 In May 2010
a turning point was reached when, after the acceptance of a sovereign rescue package
by Greece, austerity measures (Extraordinary Measures Plan) were implemented in Spain,
comprising public sector wage cuts and freezing of pensions. It was completed in 2011 with a
rise in taxes (in July the average VAT rate increased from 16 to 18% and in December marginal
rates of the personal income tax were raised), a tightening of the working conditions of civil
servants (including a wage freeze and a reduction in the number of public job openings), a
cut in spending affecting several government programmes, an extension of the co-payment
system for medicines, and a reduction in the renewable energy subsidies.25 In this context,
the Spanish government signalled its commitment to budgetary stability by including the
“golden rule” to maintain structural balance over the business cycle in the Constitution and
for all General Government subsectors.
In June 2012, the Eurogroup approved €100 bn in financial aid for the recapitalization
of Spanish banks, with Spain’s commitments under the program outlined in the Memorandum of
Understanding on Financial-Sector Policy Conditionality (MoU). The consequences of this
conditionality were the application of another austerity package in July 2012, including a
second increase in the VAT rate and the approval of a law of budgetary stability (Organic Law
2/2012) which implied a deeper control over the budgets at all levels of Public Administration,
including penalties for noncompliance.
Thus, the fiscal policy stance was notably contractionary in the years 2010-
2013, with an average annual improvement in the structural balance of 1.5 pp of GDP, as
measured in real-time. Therefore, despite the worsening of the economic cycle (the output
gap decreased from -3.6% in 2009 to -8.1% in 2013, resulting in an increase in the cyclical
deficit from 1.5% to 3.9% of GDP), the government fiscal deficit was reduced by 3.6 pp in
those years.
Since 2014, there was a significant improvement in the macroeconomic conditions.
The dynamism of economic activity contributed to narrow the output gap, which closed in
2017. Consequently, the cyclical balance reached the equilibrium at that time. Nonetheless,
in spite of this situation, the budget balance did not fall below the - 3% of GDP hurdle (as
requested by the Stability and Growth Pact) before the end of 2018. This was due to fiscal
policy being slightly expansionary during 2015 and 2016 and broadly neutral in the following
two years. It again turned slightly expansionary in 2019. This might be the result of the
consolidation fatigue arising after the years of contractive fiscal policies, which was signaled
already with the fiscal reforms introduced in 2015 and 2016. These introduced significant
tax cuts (Personal Income Tax, Corporate Tax and VAT) which worsened the structural
balance by almost 2 pp. In addition, since 2017 and specially in 2018 and 2019 government
24 hose measures included a new €5 bn fund for local investment (FEESL) that was announced in October 2009, a National
T
Rural Development Programme, and, in April 2010, a package of measures including an infrastructure plan (Extraordinary
Infrastructure Plan) and an additional economic stimulus plan (Spanish Plan to Boost the Economy and Employment).
25 partial privatisation of the airport group Aena and the National Lottery was also carried out, although these measures
A
are considered as non-recurrent elements and thus are not included in the current analysis.
BANCO DE ESPAÑA 31 DOCUMENTO OCASIONAL N.º 2108spending rose significantly. This increase was essentially aimed to improve pensions and
civil servants’ wages. As a consequence, there was no structural improvement at all during
the economic expansion of 2014-2019. At the end of this period, in 2019, the government
fiscal balance stood at -2.6% of GDP and the structural balance estimated by the European
Commission at -3.9%.
The light blue line in Chart 12 refers to the evolution of the previous variables
according to the latest released vintage (i.e. Autumn 2020). The comparison between the
current and the real-time data shows that, in the case of Spain, revisions of the total fiscal
balance are relatively minor, compared to what we found in Section 3 for some other countries
(see also Chart 4). Therefore, revisions mainly affect the cyclical balance. Revisions of this
component are particularly procyclical in Spain, with significant upward corrections of real-
time data in the expansionary years before 2008 and downward corrections in the years
2011-2013 (see also Chart 6).26
In the period 2003-2007, the upward revisions were mainly due to downward
revisions in potential GDP (-2.0 pp, on average, -3.9 pp, in 2007). However, real GDP
growth in the years prior to 2005 was also initially underestimated, contributing to
the underestimation of the cyclical component of the budget balance in those years.
Specifically, in May 2005, the change of base year in Spanish National Accounts implied
an upward revision of the whole GDP series, but also an upward revision of real GDP
growth in 2001-2004 (by 0.5 pp per year, on average). As a result of both elements,
the average output gap and cyclical balance in those years, rather than being slightly
negative, as deemed at the time, is now considered to have been positive (3.2 and
1.7 pp of GDP, respectively). Consequently, the finally-estimated structural balance
was significantly lower than it was thought during the boom and, as it was the case
in the majority of countries analyzed, the stance of the Spanish fiscal policy was not
contractionary enough during the years prior to 2008. This, in turn, conditioned the
behavior of fiscal policy during the following crisis, as we saw above.
Revisions for the years 2009-2010 are very small, indicating that the very weak
position of Spanish public finances at the time was correctly assessed in real-time and,
therefore, measurement problems cannot be blamed for the decision to start tightening
fiscal policy in 2010. Nonetheless, in 2011-2013 (a period of negative real GDP growth),
revisions of the structural fiscal balance were again procyclical, this time underestimating
the improvement achieved with the contractionary fiscal measures approved in those
years. Potential GDP has been revised up for 2011 and, especially, 2012 (by 1.6 pp
of GDP in the latter case). But real GDP revisions contributed again. In particular, in
September 2014, a new change in base year for the Spanish National Accounts resulted
once again in an upward revision of the whole series but, at the same time also in a
downward revision of real GDP growth in 2011-2012 (by more than 1 pp in cumulated
26 Data for the expansionary period that started in 2014 are still too recent to be analysed with confidence.
BANCO DE ESPAÑA 32 DOCUMENTO OCASIONAL N.º 2108terms). Thus, the real GDP fall between 2010 and 2013, that was previously estimated
at 2.7%, was revised up to 3.9%. Consequently, though data revisions do not change the
initial assessment that Spanish public finances needed a redress in 2009-2010, it is true that
structural efforts during the years 2011-2012 were somewhat underestimated at the time.
BANCO DE ESPAÑA 33 DOCUMENTO OCASIONAL N.º 21086 Conclusions
Our analysis suggests that, on average, real-time structural balance estimates by the
European Commission, for 14 EU countries plus the United Kingdom, and for the years
2003-2015, were optimistic. This real-time optimism in the fiscal position is mainly driven by
the expansionary period 2003-2007. Interestingly enough, the average optimism bias cannot
be simply explained by revisions in the unobserved output gap: revisions in fiscal variables
also play a role, particularly before 2008 and in some countries such as Greece. Also, we
find that procyclical revisions in the output gap are explained, at least partially, by revisions
in real data on GDP regardless of potential output estimates. Revisions are asymmetric, with
cumulated corrections in real-time data larger during expansions than during contractions,
which explains the negative average revision of structural balances over time.
In terms of the policy implications, our findings confirm that the fiscal policy that
was considered to be appropriate during the boom prior to the global financial crisis, and
in the first year of that crisis, finally turned out to be too expansionary, particularly in certain
countries. As a result, strong fiscal responses to the fall in domestic demand during 2009 led
to vulnerable positions for these countries. Then, they had to tighten their fiscal policy while
still being in a weak economic position, which contributed to delay the recovery. However,
our evidence does not point to this procyclical contractionary fiscal policy being the result
of inadequate assessment of structural positions in real time. Overall, we take this evidence
to confirm the importance of accumulating enough fiscal buffers during the expansionary
periods, especially because fiscal positions tend to be over-estimated in real time during
those periods.
Regarding the Spanish case, the results are generally in line with those obtained
for the whole pool of countries, although revisions of fiscal data are not particularly large in
Spain, whereas procyclical revisions of the cyclical balance are especially marked.
BANCO DE ESPAÑA 34 DOCUMENTO OCASIONAL N.º 2108You can also read