Expanding Scottish energy data - electricity demand
←
→
Page content transcription
If your browser does not render page correctly, please read the page content below
Expanding Scottish energy data – electricity demand Michael Kelly, Martin Georgiev & Calum Murray, Ricardo Energy & Environment February 2022 DOI: http://dx.doi.org/10.7488/era/2010 1 Executive summary 1.1 Aims and approach The Scottish Government has set ambitious targets to reduce greenhouse gas emissions by 75% by 2030 alongside overarching targets of reaching net-zero emissions by 2045. Achieving these targets will require a wholesale change to Scotland’s energy system. Scotland’s electricity sector has been significantly decarbonised through the growth in renewable generation. However, despite a high proportion of electricity generation coming directly from renewables (estimated at 98.6% in 20201), both heating and transportation remain heavily reliant on direct burning of fossil fuels. As set out in Scotland’s energy strategy2, the Scottish Government has set targets for the equivalent of 50% of the energy for electricity, heat and transport consumption in Scotland to come from renewable energy by 2030 (estimated at 25.4% in 20203). Access to high quality reliable data is essential in providing the evidence base to inform the development and implementation of effective energy policies and track progress. This report was commissioned to develop new and improved methodologies for collecting and assessing energy data in Scotland in three areas: Work package 1: Electricity use in properties – Development of a methodology to determine an annual time series of electricity use for heating and for non-heating purposes for electrically heated properties Work package 2: Electricity use for heat pumps – Development of a methodology to determine an annual time series of electricity use by heat pumps in properties Work package 3: Low-carbon energy use in transport – Development of a methodology to determine an annual time series of low-carbon transport energy 1 Source: Scottish Energy Statistics Hub (shinyapps.io) 2 Source: The future of energy in Scotland: Scottish energy strategy - gov.scot (www.gov.scot) 3 Source: Scottish Energy Statistics Hub (shinyapps.io) www.climatexchange.org.uk
Expanding Scottish energy data – electricity demand | Page 2 use in Scotland, capturing electricity consumption of electric vehicles (EVs), electrified rail, hydrogen and electric buses and biofuels. For each work package, the approach involved identifying the most appropriate sources of data available and producing a methodology to draw on this data to determine the time series information listed above. Data sources used for work packages 1 and 2 Home Analytics (HA): Dataset of over 2.7 million records, covering the Scottish housing stock. For this dataset, 57% of the information originates from Energy Performance Certificates (EPCs), while the remainder is modelled. This has been the primary dataset used for the modelling of domestic properties for this project and is used to produce present-day results regarding heat and electricity consumption in domestic electrically heated properties. Non-Domestic Analytics (NDA) Database: Dataset of over 226,000 non- domestic properties in Scotland. For this dataset, less than 15% of the properties contain data from non-domestic EPC records. The data for the remaining properties is modelled. This dataset has been used to produce present-day results regarding heat and electricity consumption in non-domestic electrically heated properties. Scottish House Condition Survey (SHCS): Results of this survey covering domestic properties are published annually. This survey is based on approximately 3,000 domestic properties. This dataset has been used to model the historical performance of domestic properties in Scotland. The most recently available data was for 2019, which was provided by the Scottish Government [1]. The key assumptions in the approach relate to: Estimates of how much (in degrees) and how long (in days) the external temperature is below a set temperature in each local authority area Estimates of how readily heat is lost from within a building to the outside when a temperature difference between the two exists. A heat loss coefficient can be assigned to different tiers based on the property type and their EPC rating The efficiency assigned to an average heat pump over a whole season (Seasonal Performance Factor). Key data sources used for work package 3 Anonymised MOT data: Data on annual mileages undertaken by motorcycles, cars and LGVs. UK Department for Transport statistics: Data on annual mileages for buses and HGVs. Department for Transport Vehicle Licensing Statistics: Data on the number of low-carbon vehicles registered in Scotland. Energy data provided by different rail organisations: Data on low-carbon energy use in the rail sector. 1.2 Findings Electricity use in electrically heated properties The annual heat demand in Gigawatt hours (GWh) for all domestic electrical heating across Scotland are presented in Figure 1-1 below. This includes heat technologies such as electric boilers, heat pumps, storage heaters and air heaters.4 Data from HA 4 Process heat (i.e. heat used in industrial processes) was not included as part of this analysis www.climatexchange.org.uk

Expanding Scottish energy data – electricity demand | Page 3

 was used to generate present-day results and was used in conjunction with data from
 the SHCS to generate historical results for the last ten years. This methodology is
 explained in further detail in Section 8.1.5.
 Figure 1-1: Annual heat demand for all domestic electrical heating

 9000 600000
 8000

 Number of properties
 500000
 7000
 Demand (GWh/ year)

 6000 400000
 5000
 300000
 4000
 3000 200000
 2000
 100000
 1000
 0 0
 2011 2012 2013 2014 2015 2016 2017 2018 2019 2020 2021
 Total Heat
 Total Electricity
 Number of Properties

 The modelling developed for this research illustrates that number of domestic properties
 in Scotland which are electrically heated is declining. Over the last decade, the overall
 energy efficiency of properties in Scotland has risen. Our analysis indicates that these
 two factors are contributing to an overall fall in electrical heat demand, as seen in Figure
 1-1. Further details on the modelling approach are set out in Sections 4.1.1 and 8.2.5.

 Domestic heat pump usage

 In contrast, the total heat demand supplied by domestic heat pumps is increasing, as
 visible in Figure 1-2.
 Figure 1-2: Demand from domestic heat pumps

 350 25000

 300
 20000
 Dmenad (GWh/ year)

 250
 Number of Heat Pumps

 200 15000

 150 10000
 100
 5000
 50

 0 0
 2011 2012 2013 2014 2015 2016 2017 2018 2019 2020 2021
 Heat Pumps- Electricity Input
 Heat Pumps- Heat Output
 Number of Heat Pumps

www.climatexchange.org.uk
Expanding Scottish energy data – electricity demand | Page 4

 For both Figure 1-1 and Figure 1-2, the linear trend shown for “number of properties”
 and ‘numbers of heat pumps’ is a result of them being derived through regression
 analysis of data provided by the SHCS.
 For domestic electrically heated properties, the non-heating electrical demand was also
 modelled. Figure 1-3 shows that non-heating electrical demand fell from 1126GWh in
 2011 to 558GWh in 2020. This is due to the total number of electrically heated
 properties falling, as well as the average electrical demand for domestic properties
 decreasing, from an average of 4200kWh in 2010 to 3600kWh in 2019 [2].

 Figure 1-3: Non-heating demand for electrically heated domestic properties

 1200.0 600000
 Electricity for non-heating appliances (GWh/

 1000.0 500000

 800.0 400000

 Number of Properties
 600.0 300000
 year)

 400.0 200000

 200.0 100000

 0.0 0
 2011 2012 2013 2014 2015 2016 2017 2018 2019 2020 2021
 Non-heating Electricity
 Number of Properties

 There is currently no equivalent to the SHCS for non-domestic properties. As a result, it
 was not possible to generate historical results of heat and electricity consumption of
 electrically heated non-domestic properties. Data from the NDA database was utilised to
 generate present-day figures for electrically heated properties. Values for heating
 demand, the resultant electricity demand and the non-heating demand for these non-
 domestic properties have been generated - see Table 1-1.

 Table 1-1: 2021 figures for non-domestic properties

 Other
 Year Heat Pump Electric Non-Heating Total
 Heating
 Electricity
 256 GWh 5,174 GWh 1,658 GWh 7,088 GWh
 consumed
 2021
 Heat
 767 GWh 5,174 GWh N/A 5,941 GWh
 generated

 Transport energy usage

 This study carried out a high-level analysis of the transport energy consumption from
 low-carbon road and rail transport. MOT data and Department for Transport statistics [9]

www.climatexchange.org.uk
Expanding Scottish energy data – electricity demand | Page 5 provided a source for the number of low-carbon Ultra Low Emission Vehicles (ULEVs)5 and their average mileages. Additionally, the average energy consumption across the vehicle types was obtained, which allowed the total energy consumption of each vehicle class to be calculated. Table 1-2 presents the number of low-carbon vehicles and their total energy consumption in 2020. Table 1-2: Road transport number of low-carbon vehicles and total energy consumption 2020 Cars Cars LGV LGV Motorcycles HGV Buses (BEV) (PHEV) (BEV) (PHEV) Number of 162 10,551 9,212 754 45 9 35 vehicles Total energy consumption 0.01 22.12 5.79 3.46 0.06 0.5 4.22 (GWh) All the electrified rail transport in Scotland was considered to be low carbon. Data about the annual energy consumption was directly obtained from Network Rail and the two local rail transport operators, Edinburgh Trams and Glasgow Subway. Table 1-3 presents the total energy consumption results. Table 1-3: Total energy consumption of low-carbon rail transport in Scotland 2016 2017 2018 2019 2020 Not available Network Rail 351 GWh 279 GWh Edinburgh Trams 4.18 GWh 5.50 GWh 5.70 GWh 5.66 GWh 4.23 GWh Glasgow Subway N/A N/A 6.84 GWh 6.73 GWh 5.77 GWh 1.3 Recommendations A number of opportunities have been identified to update the models, and improve the robustness of the data. These include: Close engagement with the Energy Saving Trust (which manages the HA and NDA dataset) to establish how frequently the datasets are updated and update the model accordingly to reflect changes in the building stock. Extending the need for an improved EPC record to an increasing number of domestic and non-domestic properties in Scotland would reduce the degree of modelled data used in HA and NDA Database. This would increase the accuracy and reliability of the data that the model draws on. This may come at a significant cost to implement, but it is recommended that the Scottish Government explores mechanisms to improve the reliability of recorded EPC data. It is recommended that the degree days and heat loss coefficient tiers are reviewed every five years. It is highly unlikely that changes in building stock will change the assumptions by a significant margin over short timescales. Installation of heat pumps is set to become more common, and the efficiency of heat pumps is likely to increase. We recommend that the Scottish Government liaises with the two major network operators in Scotland (Scottish Power Energy Networks and Scottish & Southern Electricity Networks) which are likely to be well placed to provide information on the number of heat pumps connected to the network. In addition, it may be worth exploring with the Microgeneration 5 Ultra Low Emission Vehicles (ULEVs) are defined as vehicles with reported tailpipe CO2 emissions of less than 75 g/km www.climatexchange.org.uk
Expanding Scottish energy data – electricity demand | Page 6 Certification Scheme (MCS) whether it is able to provide reliable and updated data on heat pump installation numbers and efficiencies. More data is required on the heat demand and energy efficiency of non-domestic properties. This may be achieved over time as the NDA Database is updated with non-domestic EPC records. www.climatexchange.org.uk
Expanding Scottish energy data – electricity demand | Page 7

 Contents

 1 Executive summary.............................................................................. 1
 1.1 Aims and approach ......................................................................................................... 1
 1.2 Findings ........................................................................................................................... 2
 1.3 Recommendations .......................................................................................................... 5

 2 Introduction........................................................................................... 8
 2.1 Project context ................................................................................................................ 8
 2.2 Requirements of the project ........................................................................................... 8

 3 Data sources & approach .................................................................... 9
 3.1 Electrically heated properties ......................................................................................... 9
 3.2 Low-carbon transport .................................................................................................... 18

 4 Key findings ........................................................................................ 21
 4.1 Electricity demand......................................................................................................... 21
 4.2 Low-carbon transport .................................................................................................... 36

 5 Key considerations for future datasets .............................................. 40
 5.1 Data for domestic properties ........................................................................................ 40
 5.2 Data for non-domestic properties ................................................................................. 41
 5.3 Data for low-carbon transport ....................................................................................... 42

 6 Findings and conclusions .................................................................. 42
 6.2 Recommendations ........................................................................................................ 44

 7 References ......................................................................................... 45

 8 Appendices......................................................................................... 48
 Appendix 1: Data sources........................................................................................................ 48
 Appendix 2: Methodology development .................................................................................. 49

www.climatexchange.org.uk
Expanding Scottish energy data – electricity demand | Page 8 2 Introduction 2.1 Project context The Scottish Government has set ambitious targets for reducing greenhouse gas (GHG) emissions in Scotland by 75% by 2030 alongside overarching targets of reaching net- zero emissions by 2045. Achieving these targets will require a wholesale change to Scotland’s energy system. Scotland’s electricity sector has been significantly decarbonised through the growth in renewable generation. It was estimated that in 2020, the equivalent of 98.6% of Scotland’s gross electricity consumption was from renewable sources of energy [3]. Despite a high proportion of electricity generation coming directly from renewables, both heating and transportation is heavily reliant on direct burning of fossil fuels. The Scottish Government has set targets for the equivalent of 50% of the energy for electricity, heat and transport consumption in Scotland to come from renewable energy by 2030. Having access to high quality reliable data is essential in providing the evidence base to inform the development and implementation of effective energy policies and track progress. Ricardo Energy & Environment (Ricardo) was commissioned by ClimateXChange on behalf of the Scottish Government to develop new and improved methodologies for collecting and assessing energy data in Scotland. This will enable an improved detailed understanding of energy data across Scotland, relating to electricity demand, heat pump demand and transport energy demand. The methodologies are designed to be repeatable by the Scottish Government and can be developed further when more energy data becomes publicly available, which will enable a stronger evidence base. The opportunities for improved data collection are detailed as part of this project. This report provides the results of the exercise undertaken which will enable the Scottish Government to track how Scotland’s energy performance is changing by using the new and improved methodologies, as well as improving them further when more data becomes readily available. 2.2 Requirements of the project The project provides methodologies to estimate the energy consumption in three key areas: Work package 1: Electricity use in properties - An annual time series of electricity use for heating and for non-heating purposes for electrically heated properties Work package 2: Electricity use for heat pumps - An annual time series of electricity use by heat pumps in properties Work package 3: Low-carbon energy use in transport - An annual time series of low-carbon transport energy use in Scotland Due to the similarities and crossovers between work packages 1 and 2, a single proposed methodology that addresses both aspects has been developed. www.climatexchange.org.uk
Expanding Scottish energy data – electricity demand | Page 9 3 Data sources & approach The project sought to develop methodologies for collecting and assessing energy data that can be repeated by the Scottish Government in future years. To achieve this, energy data was collected from various sources and processed in excel to produce datasets to track the energy consumptions in the building and transport sectors in Scotland. The project approach was split into two main sub-tasks, which were carried out in parallel: Identification and collection of energy data Methodological development to derive estimates of electricity consumption in domestic and non-domestic buildings alongside low-carbon transport energy use The following sections discuss the data sources collected for the analysis and the methodology developed to answer the key project questions for each subtask. 3.1 Electrically heated properties The aim of work package 1 was to develop a repeatable methodology to estimate the electricity use for heating and non-heating purposes for electrically heated properties, where the primary heating fuel is electricity. The aim of work package 2 was to estimate the electricity consumption of heat pumps in both domestic and non-domestic buildings. This section explains the methodology developed to answer the key project questions for work packages 1 and 2. 3.1.1 Data sources for electrically heated properties The first step was to identify existing data sources that can provide information about electricity demand data with sufficient granularity. Data sources that were selected for the analysis are as follows: Table 3-1: List of data sources considered to estimate the electricity use in electrically heated properties Data sources reviewed Relevance to the project Home Analytics (HA) HA is a software package developed by the Energy Saving Trust (EST) for the Scottish Government. It provides information on a wide range of variables pertaining to the Scottish housing stock. It draws on a variety of data sources, predominantly the domestic Energy Performance Certificate (EPC) database as well as other datasets such as the Home Energy Efficiency Database (HEED) and Warmer Homes Scotland (WHS) data. The dataset contains information on approximately 2.7 million domestic properties. Approximately 57% of the data is based on recorded domestic EPC data, with the remainder of the information being modelled. EPCs are certificates which are required whenever a property is built, sold, or rented. An EPC contains information about the property’s estimated energy demand and energy efficiency which is estimated using the SAP methodology. A property is assigned an energy efficiency rating from A (most efficient) to G (least efficient) and is valid for 10 years. Information on the energy use and efficiency of the building from existing EPC records is the most useful information within HA. www.climatexchange.org.uk
Expanding Scottish energy data – electricity demand | Page 10

 Data sources reviewed Relevance to the project

 The variables that have been obtained from HA and used in this
 project are detailed in Table 3-2

 Non-Domestic Analytics NDA is a dataset developed by the EST. The dataset covers
 Database (NDA) non-domestic properties in Scotland.
 This dataset contains information on over 226,000 non-domestic
 properties in Scotland. Similarly, to HA, it contains information
 on a wide range of property characteristics and the estimated
 energy consumption / efficiency of these properties. Less than
 15% of the non-domestic properties in Scotland have non-
 domestic EPCs available. As a result, NDA has a large
 percentage of data (85%) that is modelled. This results in a less
 accurate dataset than HA. However, it provides a detailed
 overview of non-domestic Scottish properties, and as a result, it
 has been used as the primary source of information for non-
 domestic properties in this project. Recorded non-domestic EPC
 records in their low numbers are skewed towards urban areas
 which indicates that energy performance data in urban areas is
 based on measured data collected onsite. In contrast, there is
 less measured data in rural areas, and as a result, the non-
 domestic EPC records are not representative of the non-
 domestic portfolio. This resulted in the NDA dataset being
 implemented which uses statistical modelling to reduce this
 skew and create a more representative dataset of Scotland’s
 non-domestic property portfolio.

 Scottish House Condition The SHCS is a survey that is conducted annually by the Scottish
 Survey Data (SHCS) Government and contains data on a wide range of housing
 related topics. It contains information on variables such as
 property type, property age, SAP band, main fuel type and main
 heating technology type as well as others. The survey is based
 on a small sample size, approximately 3,000 properties, and is
 scaled up to be representative of Scotland as a whole. A
 representative sample from the SHCS was provided to the
 Ricardo project team with historical results. This has allowed
 historical figures to be calculated for domestic Scottish
 properties by using the results at the present time in HA as the
 baseline to track backwards.

 National Energy Efficiency The Department for Business, Energy & Industrial Strategy
 Data Framework (NEED) (BEIS) publish this dataset annually. It reports on average and
 total gas / electricity consumption for different domestic and non-
 domestic property types. The majority of the data used to
 calculate these figures is from meter-data, with the remainder
 coming from other sources such as the Ordnance Survey and
 Ofgem. The relevant information from this dataset for this project
 is the average electricity consumption for different types of
 domestic and non-domestic properties. This information was
 used to estimate electricity consumption for non-heating
 purposes.

 As discussed in Table 3-1, both HA and NDA have a significant amount of data that is
 modelled, that could not be obtained from existing datasets. The modelling process
 adopted in HA and NDA involved the use of multinomial logistic regression models.
 These models use a variety of address-level predictors such as property type, age,

www.climatexchange.org.uk
Expanding Scottish energy data – electricity demand | Page 11 tenure, urban/rural classification, Index of Multiple Deprivation (IMD) decile and number of habitable rooms. They also use area-level indicators, known as “neighbourhood measures”, to estimate a variable based on measured variables of nearby properties. A weighting is applied to these measures, based on the proportion of known records in the area. A postcode with 90% known records would be more influential than one which only had 10% known records. The variables from HA and NDA that have been used in this project are detailed in Table 3-2 and Table 3-3. Table 3-2: Variables from HA that have been utilised in the development of the model Field Name Description Local authority (LA) This is the local authority area that each property resides within Property type The property type of each domestic building, the categories are: Detached house Semi-detached house Mid-terraced house End terraced house Small block of flats / property converted into flats – This property could be within a low-rise block or be a flat within a house that has been converted. Flat in mixed use building- This is a flat that is within a building that also contains non-domestic units, such as a flat above a shop. Block of flats- This is a flat within a block, not the entirety of the block. Large block of flats- This is a flat within a large tower block. Total floor area An estimate of the property’s floor area, used to calculate the Heat Transfer estimate (m2) Coefficient for each property type Main fuel type The primary fuel type used to heat the property. For the purpose of this project, this was filtered to focus on electrically heated properties Standard The energy efficiency band of the property. This includes bands: Assessment Procedure rating A-B band C D E F-G Unknown Heat demand An estimate of the property’s annual total heat demand estimate (kWh/year) Main heating The is the main heating technology used for each building type, these technology include: Air heater Boiler Heat Pump Room heater Other Confidence This is a number between 0-1, which indicates the level of accuracy of the estimate modelled results for each variable. www.climatexchange.org.uk
Expanding Scottish energy data – electricity demand | Page 12 Table 3-3: Variables from NDA that have been utilised in the development of the model Field Name Description Local authority (LA) This is the local authority area that each property resides within Property Type The property type of each non-domestic building, the categories are: Restaurants and Cafes Retail and Financial Services- A property serving as a shop/ financial service such as a bank General Industrial, Storage or Distribution- Properties such as warehouses and depots Offices and Workshops- Properties included in this category are offices and small-scale manufacturing premises Hotels Residential Institutions and Spaces- Properties in this category include care homes, hospitals, and prisons General Assembly- Properties such as factories Non-residential Institutions- Properties within this category include museums, libraries, and law courts Other- Any non-domestic property that can not be categorised into the classifications discussed above Total floor area An estimate of the property’s floor area, used to calculate the Heat Transfer estimate (m2) Coefficient for each property type Main fuel type The primary fuel type used to heat the property. For the purpose of this project, this was filtered to focus on electrically heated properties Space heating An estimate of the property’s annual space heating demand demand estimate (kWh/year) Water heating An estimate of the property’s annual water heating demand. For non- demand estimate domestic properties, space and water heating were split out as separate (kWh/year) variables, in HA they are combined into one variable. Main heating The is the main heating technology used for each building type, these technology include: Air heater Boiler Heat Pump Room heater Other HA was selected as the primary data source for carrying out the analysis of the domestic properties in Scotland at the present time, which is supplemented by the SHCS which provides historical trends. It is important to note that HA and the SHCS provide a similar set of data, however they arrive at it via different methods. Table 3-4 provides a comparison between the two data sets to highlight key differentiating points. www.climatexchange.org.uk
Expanding Scottish energy data – electricity demand | Page 13 Table 3-4: Comparison between HA and the SHCS Differentiating point Description Sample size HA is based on EPCs which cover 57% of the housing stock, data for the remaining properties is modelled. SHCS is based on a small sample size- approximately of 3000 domestic properties and the results are extrapolated. Accuracy of the sample data HA is based on EPCs that could be old, skewed towards new builds and rental property SHCS is based on annually updated sample that is representative of the country. Representativeness of the total HA covers all domestic properties in Scotland. number of buildings SHCS looks at occupied dwellings and excludes long term unoccupied and second homes, thus providing a more accurate representation. Geographical representation HA contains information on the exact address of each property and can be split by local authority. SHCS only provides data based on urban/ rural split. Building characteristics HA provides detailed information about EPC rating, energy consumption and detailed building characteristics. SHCS provides information on limited building characteristics and EPC bands. Ease of updating the tool SHCS is updated annually, these figures can be input into the tool on an annual basis to easily update the model on a regular basis. HA is a dataset provided by an outside contractor; it is not necessarily updated annually. Out of the two datasets, HA is far more granular, with much greater detail regarding property location and property characteristics. However, the data in HA is skewed, due to its dependency on EPC certificates. Properties in urban areas, new-builds and rental properties are all more likely to have had EPCs issued than the average property. These property types are likely to be being overrepresented in the dataset. The SHCS is arguably more representative, however the main disadvantage of this survey is the small sample size. Due to the small sample size, made smaller when filtering for only electrically heated properties, year-on-year results for specific property types could fluctuate significantly, likely more than they do in reality. A benefit of the SHCS, in comparison to HA, is that it excludes unoccupied properties and second homes. As HA does not exclude these properties, there is a risk that using this dataset could lead to energy consumption being overestimated. Due to the significant variation between the methodologies used to compile the datasets, the figures generated by each dataset are different. A major difference identified during the completion of this project is that the SHCS identifies approximately 275,000 electrically heated domestic properties in Scotland, whereas HA contains approximately 360,000 such properties. The discrepancy in the raw figures that are input into the model will lead to a discrepancy in the results generated regarding heat and electricity consumption. As a result of the higher granularity of HA this dataset is used as the www.climatexchange.org.uk
Expanding Scottish energy data – electricity demand | Page 14 primary source of data for the model to estimate the energy consumption at the present time, while the SHCS was used to generate historical trends which creates the annual time series. However, a second model was also provided to the Scottish Government that uses data input from the SHCS to allow the flexibility to interchange between both datasets as the main inputs in the model. The results of this secondary model are discussed in detail in Section 4.1. 3.1.2 Methodology development Estimating electricity consumption to meet the building heating requirements depends on two factors: Total heating demand of the property: A property’s space and water heating requirements are dependent on factors such as the type and size of the building, floor area, the energy efficiency of the building and the location Heating technology installed: The efficiency of different electric heating technologies varies depending on the technology installed in the building Our approach to calculating the total heating demand and the corresponding electricity demand for heating purposes of a property involved carrying out the following steps and calculations: Calculating heating degree days: This is the measure of how much (in degrees) and how long (in days) the external temperature is below a set temperature [4]. Degree days are commonly used in calculations relating to estimating the energy consumption required to meet the heating requirements of the building type. To estimate this, the hourly outside temperature was collected from Met Office stations across every local authority area in Scotland. Using a sensible base temperature of 15.5°C, the difference between the indoor and outdoor temperature can be estimated hourly and summed to predict the total degree days for the year. The base temperature of a building is the outside temperature below which the building requires heating. It is calculated as the difference between the desired internal temperature, and the internal gains from other non-heating system sources such as occupants and appliances. In the UK, a typical desired internal temperature is 19°C, and it is assumed that internal gains make up 3.5°C. Therefore 15.5°C is the conventional base temperature for the UK [5]. Calculating heat transfer coefficient: Heat transfer coefficient of a building determines the rate of heat transfer between the building envelope when a temperature difference exists between the indoor and outdoor temperatures. The heat transfer coefficient was estimated using variables in HA and NDA such as the average heat demand and SAP rating of each property type alongside the average floor area for each property. This allowed heat transfer coefficient numbers to be assigned to different tiers, which is the assignment of an estimated average heat loss coefficient value to each property type. Calculating total heat demand: The total annual heat demand for each property type was calculated by using a combination of the degree days for each local authority and the appropriate heat transfer coefficient from the different tiers which varies for different property types. Efficiency of electric heating technology: The efficiency of electric heating technologies varies across all technology types. For example, standard resistance heaters convert one kWh of electricity into one kWh of heat. This means that fulfilling a significant heating demand requires an equally significant amount of electricity consumption. In contrast, heat pumps have a higher conversion rate which varies across the different seasons. The Coefficient of www.climatexchange.org.uk
Expanding Scottish energy data – electricity demand | Page 15 Performance (COP) is the ratio of heat energy delivered compared to the amount of electrical energy that is required. There are two methods to measure the COP of a heat pump. The first is instantaneous COP, which is the heat pumps efficiency at a specific period in time. The instantaneous COP will vary across the seasons, with a lower COP in the winter months. This is because as the input temperature reduces in the winter months, the heat pump has to work harder to extract heat from it and has to draw more electrical energy from the grid to heat the property up to the desired temperature. The second method of measuring COP is Seasonal COP (also known as the Seasonal Performance Factor (SPF)). SPF represents the average COP of a heat pump over the full heating season. This project focused on estimating a sensible SPF in order to estimate electricity consumed by a heat pump throughout the year. Calculating total electricity consumption: Using the total heat demand estimated above for each property type in the dataset along with the efficiency of the electric heating technology (standard electric heaters or heat pumps) results in the estimation of the corresponding electricity consumption required in the building. The total heat demand divided by the efficiency of the electric heating technology generates the electric consumption, which is imported from the grid. This was estimated on a property-by-property basis using the assumptions of heat loss coefficient from the different tiers and subsequently added together to predict a national electricity consumption number. Generating heat transfer coefficients for each SAP band and property type was not possible for non-domestic properties. The lower quality data available for non-domestic properties resulted in the heat transfer coefficients that were generated for the non- domestic SAP band tiers being unrealistic. This is described in more detail in Appendix 2. The methodology deployed above is further illustrated in the flowchart diagram below for an individual property. In addition to the above, data provided by representatives of the SHCS tracks how the number of electrically heated properties has changed, split by property type, SAP band and heating technology over the years. The heat and electricity demand calculated for the present-day situation was extrapolated using the historical trends presented by the SHCS to generate annual time series figures. This methodology is explained in greater detail in Appendix 8.2.5. Equivalent SHCS data for non-domestic properties was not available and therefore, generation of historical trends for non-domestic properties was not possible. www.climatexchange.org.uk
Figure 3-1: Flowchart showing the methodology deployed to estimate total electricity consumption in electrically heated properties for individual properties

www.climatexchange.org.uk
A SPF was estimated using information provided from the Domestic Annual Heat Pump
 System Efficiency (DAHPSE) Estimator website [6]. The website contains information on
 typical domestic heat pump efficiencies for different heat pump manufacturers and how
 this varies with dwelling heat loss, design flow temperature and the presence of weather
 compensation.
 Figure 3-2 below shows an example of the spread in heat pump efficiency with respect
 to the dwelling design heat loss when the design temperature and weather
 compensation variables are varied. The results show a typical spread in heat pump
 efficiency from 2.5 to 3.5. For this reason, an average SPF of 3 was deemed to be a
 reasonable assumption to make for different heat pump technology types.
 Figure 3-2: Domestic Annual Heat Pump Efficiency estimations for different heat pump types

 In order to generate annual time series estimations of electricity consumption, the
 change in the SPF over time needs to be taken into account. Historical SPFs are
 provided in Table 3-5.
 Table 3-5: Results of a phase 1 and phase 2 trial conducted by the EST from 2009 to 2012 into
 estimations of heat pump efficiency [7]

 Year of study Sample of ASHPs SPF Range

 2009 – 10 22 1.2 – 2.2

 2011 – 12 17 2.0 – 3.7

 An average SPF in 2010 was determined from the EST results. Using an average SPF
 of 3 for the year 2021, the SPF was extrapolated for the years in between 2010 and
 2021. This allows historical average heat pump efficiencies to be accounted for in the
 analysis; however, this does not provide a clear picture of how heat pump efficiency
 numbers have changed over the years as the data that records this information is not

www.climatexchange.org.uk
Expanding Scottish energy data – electricity demand | Page 18 readily available. Despite the limited data available on historical heat pump efficiencies, the numbers provided in Table 3-5 are deemed sufficient for this project. 3.2 Low-carbon transport Transport is a major contributor to GHG emissions in Scotland. In 2019, 37% of the total emissions in the country were generated by the transport sector, and 69% of the transport emissions came from road vehicles [8]. Electrification and transition to sustainable fuels like hydrogen has the potential to bring about a major cut in these emissions. In this work we aimed to quantify the energy use of low-carbon vehicles, which were split into the following categories: Motorcycles Cars Light goods vehicles (LGV) Heavy goods vehicles (HGV) Buses and coaches Rail transport (trains, trams and underground). Additionally, this analysis presents historic data for the energy consumption of these vehicle categories and will allow future figures to be tracked on an annual basis. 3.2.1 Data sources for the transport analysis Table 3-6 presents the data sources used in the transport analysis. Table 3-6: Data sources for the transport analysis Data sources reviewed Relevance to the project Department for Transport Statistics on number of low-carbon vehicles registered in Vehicle Licensing Statistics Scotland across different classes of road transport ranging from motorcycles to buses and HGVs. This was provided from Transport Scotland on request to the Department for Transport to extract Scottish figures from statistics which are published at the UK level. UK Department for Typical annual mileages for buses and HGV [9] [10] [11]. Transport statistics Anonymised MOT data Dataset that allows the annual mileages to be extracted for motorcycles, cars and LGVs [12]. Network Rail Total energy consumption data of the electrified rail infrastructure in Scotland was provided on request. Edinburgh Trams Total energy consumption for traction from the operations of Edinburgh Trams. Provided on request. Glasgow Subway Total energy consumption for traction from the operations of Glasgow Subway. Provided on request. ScotRail Total energy consumption of electrified rail along with total distance for all train journeys travelled broken down over a calendar year. www.climatexchange.org.uk
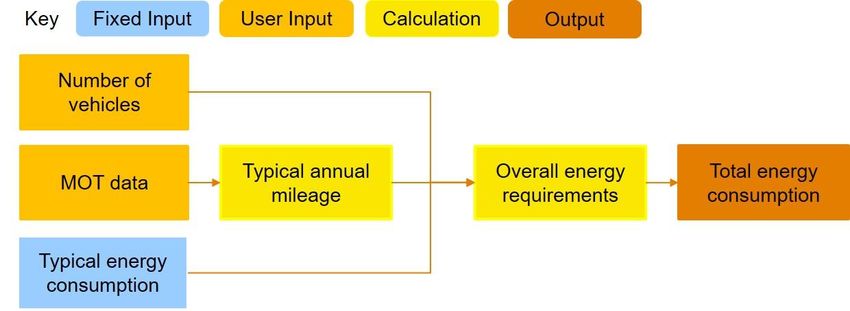
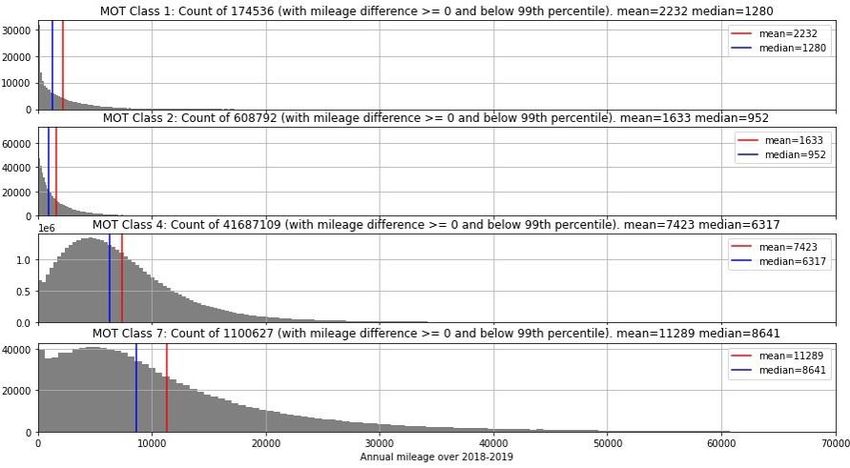
Expanding Scottish energy data – electricity demand | Page 19 3.2.2 Methodology In this section, we present the different methodologies we adopted for road and rail transport. Road transport The data available on low-carbon road vehicle numbers provides annual time series for registered low-carbon vehicles from 2010 until present day. This data is publicly available and can be updated on a regular basis. To establish the annual mileages for motorcycles, cars and LGVs, publicly available anonymised MOT data was used. The MOT data provides information about the vehicle class and mileage plus a unique identifier which allows the difference in mileage between two MOTs for each individual vehicle to be calculated. The vehicle classes in the MOT data are as follows: Cat 1 - small motorcycles Cat 2 - motorcycles Cat 3 - three-wheelers Cat 4 - cars Cat 5 – Private passenger vans Cat 7 – LGV Three-wheelers (Cat 3) were not included in the analysis as they do not appear in the statistics for low-carbon vehicles, and they represent a very small proportion of all vehicles (7,246 out of more than 40 million MOT entries). Private passenger vans (Cat 5) were also excluded in the analysis as there is no corresponding category in the low-carbon vehicle statistics. A script was developed in Python to extract the anonymised MOT data, perform data quality check to remove invalid data, and to develop a process for estimating annual mileages for each classification of vehicle. Using each vehicle’s identifier, the difference in odometer readings was calculated between 2020 and 2019, which allowed the average annual mileage for each vehicle class to be calculated. To arrive at the average mileage for motorcycles, an average of the results for small motorcycles (Cat 1) and motorcycles (Cat 2) was taken. Recognising that this year was an outlier due to the COVID-19 pandemic and the average mileage is lower than typical, a further iteration of the analysis was run for the difference in odometer readings between 2019 and 2018 to populate annual mileages in the historic analysis. For HGVs, buses and coaches we used UK Department for Transport statistics to obtain average annual mileages. The data provides total number of vehicles in Scotland plus total annual vehicle miles, from which the average mileage was calculated. Typical energy consumption for the different classes of vehicles and types of propulsion were established based on average values or energy consumption of the dominant vehicles in each class. For electric vehicles (battery and fuel cell) the values are presented in watt hour per mile (Wh/mile) accounting for efficiency penalties and are subsequently multiplied by the number of vehicles in each class and their typical annual mileage to arrive at the total energy demand. It should be noted that as the characteristics of vehicles change, the energy consumption figures should be updated. It was assumed that all HGVs, buses and coaches are electric, as the available data does not provide a breakdown by storage system. There are a small number of hydrogen www.climatexchange.org.uk
Expanding Scottish energy data – electricity demand | Page 20

 buses in Scotland that are excluded by this analysis, however, provisions have been
 made in our calculation tool to input hydrogen HGVs, buses and coaches once more
 detailed statistics become available. The hydrogen calculations use the same energy
 requirements, but they also account for the larger efficiency penalty that arises from the
 fuel cell system. Data was requested on biofuel uptake in Scotland from Transport
 Scotland, but this information isn’t currently available.
 The analysis of plug-in hybrid electric vehicles was built upon utility factors of the electric
 motors and energy consumption figures from electric vehicles. Firstly, the utility factor,
 which is the proportion of distance covered using the electric motor, was estimated for
 plug-in hybrids. The figures under test conditions suggest that the electric propulsion
 system has a significant contribution, with average utility factors of between 60% and
 70%. However, large scale studies found that the actual utility factor of plug-in hybrids is
 significantly lower – between 20% and 37% [13]. This is typically due to overreliance on
 the internal combustion engine (ICE) and infrequent charging. These figures are
 corroborated by another study that found similar results [14] . Therefore, this analysis
 uses a utility factor of 30% that is representative of real-world performance rather than
 utility factors under test conditions (note that a representative value was selected rather
 than a calculated average, so an expected level of uncertainty is reflected).
 In terms of energy consumption figures we identified significant variation between the
 most popular models of PHEV, however, to a large extent they are comparable with
 battery electric vehicles. Therefore, the same energy consumption figure would be used
 for the PHEV analysis. The total energy consumption was found by multiplying the utility
 factor by the energy consumption, which are then multiplied by the average annual
 mileage and the number of PHEVs.
 It should be noted that mild hybrids6 were excluded from this analysis as all the energy
 delivered by the electric propulsion system was charged using the vehicle’s ICE. The
 benefits in this type of vehicle result from charging occurring during times when the ICE
 is working around optimal efficiency, which offsets usage of the ICE at start-stop traffic
 for example. As a result, the actual reduction in fuel consumption is difficult to quantify
 as no large-scale real-world studies could be obtained.
 Range extender7 electric vehicles, which form about 1% of the total number cars and
 LGVs, were included in the analysis of BEVs. This segment is dominated by the BMW i3
 (86%), which is a small city car with a large capacity battery and, therefore, it is expected
 that its usage pattern will be similar to BEVs [15]. Again, provisions have been made to
 separate out the analysis of range extender vehicles should their overall proportion
 become larger and more reliable figures for their utility factors become available.
 The category of “Other vehicles” presented in the Department for Transport data covers
 vehicles like forklifts, waste collection vehicles, ambulances, etc. and the total number of
 vehicles in this category represents 0.7% of the total low-carbon vehicles in Scotland.
 There is no available data that provides a breakdown by type and there is no available
 method to accurately estimate the annual mileages and energy consumption across the
 category. Therefore, “Other vehicles” was excluded from the analysis. Figure 3-3
 presents a flow chart that depicts the steps in this analysis.

 6
 Mild hybrids are vehicles which only charge the battery by using the internal combustion engine (and
 in some cases regenerative breaking). These vehicles have no option to charge by plugging into
 electric charger. Typically these vehicles use the electric powertrain mostly in conjunction with the
 internal combustion engine to achieve efficiency gains.
 7
 Range extender EVs use the electric power train for propulsion and have the option to plug in. They
 are also equipped with an internal combustion engine that can be used purely for battery charging
 when necessary.

www.climatexchange.org.uk
Expanding Scottish energy data – electricity demand | Page 21

 Figure 3-3: Road transport analysis methodology flow chart

 Rail transport
 The analysis of the energy consumption from low-carbon rail transport in Scotland was
 conducted using three sources of data – total energy consumption from Network Rail,
 Edinburgh Trams and Strathclyde Passenger Transport Authority data into the Glasgow
 Subway. The data sources are not publicly available and need to be requested annually
 from the respective organisations for up-to-date figures.
 The data from Network Rail covers the traction demand from all of the electrified
 railways in the country and, therefore, it covers all of the rail operators.
 The data provided by ScotRail provides total traction demand data along with train
 journeys in miles for all trains that are owned by ScotRail, therefore covering the majority
 of all rail journeys in Scotland.
 Edinburgh Trams and Glasgow Subway are the two other rail transport networks
 operating in Scotland. The breakdown of the energy consumption data, showing energy
 demand at half-hourly intervals for each substation, was obtained for both rail networks.
 It was not possible to obtain total mileages of electrified rail journeys for the whole of
 Scotland. Only total mileages were obtained from ScotRail, which is the largest train
 operating company in Scotland. Data on the small train operators’ total mileage was not
 available when requested after speaking to Network Rail.

 4 Key findings
 4.1 Electricity demand
 The accompanying spreadsheet tool calculates heating consumption figures for both
 domestic and non-domestic properties. In addition, we calculated the non-heating
 electricity demand in electrically heated properties.

 4.1.1 Electricity usage in electrically heated domestic properties

 Data from HA has been utilised to generate heat demand figures for 2021. The non-
 heating electrical demand has been calculated using data from the NEED-UK database.
 There are approximately 360,000 electrically heated domestic properties in Scotland,

www.climatexchange.org.uk
Expanding Scottish energy data – electricity demand | Page 22

 based on the data in HA, and an overview of the electricity consumption figures for 2021
 is presented in Table 4-1.
 Table 4-1: Total domestic heat and electricity consumption in electrically heated properties for 2021

 Year Heat Pump Other Non- Total
 Electric Heating
 Heating
 2021 Electricity 101 GWh 4,503 GWh 558 GWh 5,169 GWh
 consumed
 Heat 302 GWh 4,503 GWh N/A 4,805 GWh
 generated
 The heat demand has been separated into the heat demand from heat pumps and the
 heat demand from other electrical heating technologies. A more in-depth view of the
 heat demand for 2021 is available in Error! Reference source not found. below by
 property type and SAP band.
 Table 4-2: Total domestic heat demand for 2021, split by property type and SAP band

 Heat A-B C D E F-G Total
 Demand
 Total (GWh/
 year)
 Detached 31 GWh 81 GWh 230 GWh 263 GWh 383 GWh 988 GWh
 house
 Semi- 12 GWh 70 GWh 247 GWh 250 GWh 199 GWh 778 GWh
 detached
 house
 Block of 15 GWh 143 GWh 252 GWh 162 GWh 85 GWh 657 GWh
 flats
 Small block 10 GWh 93 GWh 219 GWh 186 GWh 136 GWh 644 GWh
 of
 flats/dwelli
 ng
 converted
 into flats
 Mid- 5 GWh 47 GWh 176 GWh 175 GWh 109 GWh 512 GWh
 terraced
 house
 Flat in 16 GWh 93 GWh 140 GWh 125 GWh 89 GWh 463 GWh
 mixed use
 building
 Large block 36 GWh 153 GWh 120 GWh 48 GWh 31 GWh 388 GWh
 of flats
 End- 5 GWh 29 GWh 117 GWh 125 GWh 100 GWh 376 GWh
 terraced
 house
 Total 130 GWh 709 GWh 1,501 GWh 1,334 GWh 1,132 GWh

 Approximately 83% of the heat demand generated by Scottish properties at present is
 from properties within Band D, Band E or Band F-G (see details of the breakdown in
 Table 4-3).
 Table 4-3: Percentage of 2021 heat demand from properties within each SAP band

 SAP Band A-B C D E F-G
 Percentage of Total Heat 3% 15% 31% 28% 24%
 Demand

www.climatexchange.org.uk
Expanding Scottish energy data – electricity demand | Page 23

 Percentage of Total Properties 6% 25% 33% 21% 15%

 Unsurprisingly, the larger property types such as detached houses and semi-detached
 houses, seen in Table 4-4, constitute the largest share of the heat demand (combined
 demand is 37% of the total) for 2021, despite accounting for only 24% of the number of
 properties.
 Table 4-4: Percentage of heat demand for 2021 for each property type

 Property Type Percentage of Heat Demand
 Detached house 21%

 Semi-detached house 16%

 Block of flats 14%

 Small block of flats/dwelling converted 13%
 in to flats

 Mid-terraced house 11%

 Flat in mixed use building 10%

 Large block of flats 8%

 End-terraced house 8%

 The average annual heat demand for each of these property types is displayed in Figure
 4-1. The average heat demand for all electrically heated property types is approximately
 13,300 kWh from the estimations undertaken in HA.
 Figure 4-1: Average heat demand for different domestic property types

 25000
 Average Heat Demand (kWh/ year)

 20000

 15000

 10000

 5000

 0
 Mid-terraced house
 Detached house

 Semi-detached house

 End-terraced house

 Average

 Small block of flats/dwelling

 Flat in mixed use building

 Block of flats

 Large block of flats
 converted in to flats

 Figure 4-1 highlights that detached houses and semi-detached houses have the largest
 heat demands on average. Inversely, smaller properties, in large blocks of flats, have the

www.climatexchange.org.uk
Expanding Scottish energy data – electricity demand | Page 24

 smallest heat demands. Table 4-5 highlights that, generally, electrically heated
 properties in Scotland tend to be less efficient than the average domestic property. As a
 result, the average heat demand for electrically heated properties is likely to be greater
 than the overall average demand.
 Table 4-5: Percentage of domestic properties in each SAP band- using electricity/ other fuel for
 heating

 SAP Band A-B C D E F-G
 Electricity 6% 25% 33% 21% 15%
 All Fuels 8% 37% 36% 13% 6%

 Figure 4-2 displays the average heat demand for each domestic SAP band, based on
 the data provided in HA.
 Figure 4-2: Average heat demand for properties within each SAP band

 25000
 Average Heat Demand (kWh/ year)

 20000

 15000

 10000

 5000

 0
 A-B C D Average E F-G

 Data from the SHCS has been used, in conjunction with the HA database, to generate
 historical heat and electrical consumption figures.

 Table 4-6 shows an example of these historic figures for 2011.
 The data from the SHCS provides different SAP bands and different property types to
 the data in HA. As discussed in Section 3 (further detail in Appendix 2)., HA was
 deemed to be the more reliable data set, so SHCS figures were used to extract the
 general trend for number of properties under each type and SAP band and applied to
 data from HA.
 Similarly to Table 4-2, the heat demand for 2011 has been split up by property type and
 SAP band, shown in Table 4-7.

www.climatexchange.org.uk
Expanding Scottish energy data – electricity demand | Page 25

 Table 4-6: Total domestic heat and electricity consumption in electrically heated properties for 2011

 Year Energy Heat Pump Other Electric Non-Heating Total
 source Heating
 2011 Electricity 94 GWh 7,073 GWh 1,126 GWh 8,239 GWh
 consumed
 Heat 40 GWh 7,073 GWh N/A 7,167 GWh
 generated

 Table 4-7: Total heat demand in Scotland for 2011, split by property type and SAP band

 2011 C Plus D E, F, G
 Detached 8 GWh 207 GWh 1,175 GWh
 Semi-detached 35 GWh 386 GWh 766 GWh
 Terraced 37 GWh 702 GWh 702 GWh
 Tenement 557 GWh 682 GWh 1,108 GWh
 Other flats 201 GWh 318 GWh 283 GWh
 Total 838 GWh 2,295 GWh 4,034 GWh

 According to the model used, the number of electrically heated properties has
 decreased from approximately 516,000 properties in 2011 to approximately 360,000 in
 2021. This equates to a total reduction of 40%, with an average of 3% each year. This
 modelling process involved applying the relative year-on-year changes in the number of
 electrically heated properties recorded in the SHCS to the present-day number of
 electrically heated properties in HA. This is necessary as a result of a large discrepancy
 between the number of electrically heated properties in HA and the SHCS. Using raw
 SHCS data to produce the historical results alongside input from HA for the present day
 would result in a very large, and unrealistic, increase in the number of electrically heated
 properties from 2019 (SHCS) to 2021 (HA). A separate model has been developed that
 fits a linear regression to the raw SHCS data instead (details are set out in Section 4.1.5
 and explained further in Section 8.2.5) that does not utilise this scaling-up approach.
 There is significant variation in the year-on-year change in the number of electrically
 heated properties in the raw SHCS data. This ranges from a decrease of approximately
 48,000 properties from 2017-2018, to an increase of approximately 26,000 from 2016-
 2017. Linear regression has been used to generate an overall trend for the number of
 electrically heated properties from the data which records considerable year-on-year
 fluctuations.

 The decline in heat demand resulting from the reduced numbers of electrically heated
 properties and increased heat efficiency of domestic properties is presented in Figure
 4-3.

www.climatexchange.org.uk
You can also read