Federal Involvement in Ocean-Based Research and Development - January 31, 2022
←
→
Page content transcription
If your browser does not render page correctly, please read the page content below
Federal Involvement in Ocean-Based Research
and Development

January 31, 2022

                             Congressional Research Service
                              https://crsreports.congress.gov
                                                     R47021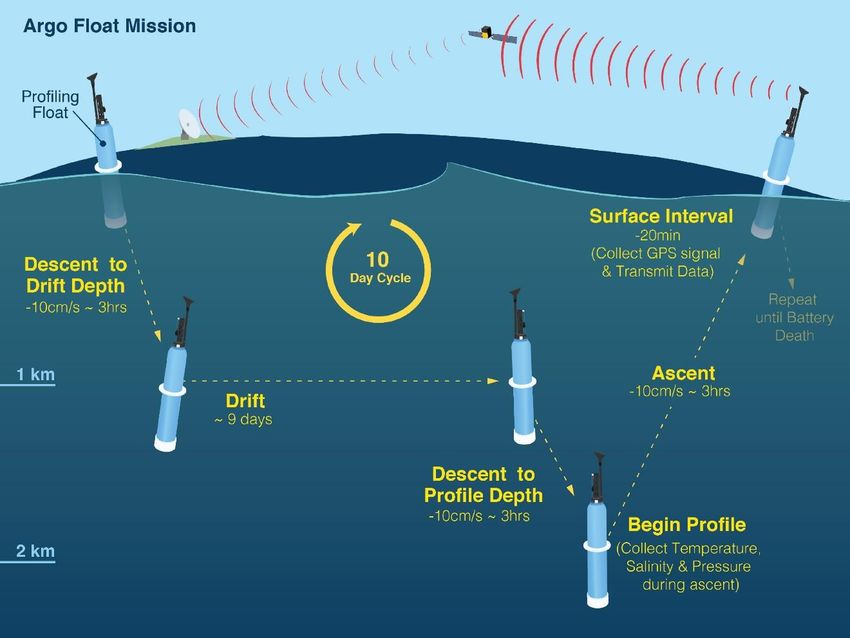
SUMMARY

                                                                                                      R47021
Federal Involvement in Ocean-Based Research
                                                                                                      January 31, 2022
and Development                                                                                       Caitlin Keating-Bitonti
Multiple federal departments and agencies conduct ocean-based research and monitoring and/or          Analyst in Natural
technological development. The interpretation of oceanographic data collected and studied by          Resources Policy
these federal departments and agencies—and the academic, commercial, nonprofit research the
federal government helps support—provide information to domestic policymakers, including
Members of Congress, on relevant societal issues and needs that extend beyond coastal
communities and island states, such as climate change and characterization of the deep-sea for
geohazard prediction, environmental protection, and natural resource management.

The federal government generally is involved in ocean-based research, monitoring, and technological development to
increase knowledge and understanding of the ocean. International interests also frame federal ocean work, as the ocean
supports global trade and recreation. The federal departments and agencies involved in ocean-based research, monitoring, and
technological development include the National Oceanic and Atmospheric Administration, the National Aeronautics and
Space Administration, the U.S. Geological Survey, the Bureau of Ocean Energy Management, the National Science
Foundation, and the Office of Naval Research of the Department of the Navy, among others.

Federal ocean data collection efforts are varied and make use of many different types of tools and technology. The federal
government uses satellites, deployed instruments (e.g., buoys, floats), stationary monitoring (e.g., tide gauges), ship-based
equipment (e.g., multibeam sonar sensors), and sampling (e.g., sediment corers) of targeted site locations, among other
approaches. Technology such as autonomous underwater vehicles, launched from land or ships, has the capability to collect
and automatically send large volumes of data to nearby shore facilities or back to the vessel. In addition, remote or human-
operated vehicles and human technical divers can be used for exploration (including data collection and sampling) and
visualization of the ocean. Some departments and agencies also fund extramural research, such as through grants for projects
where nonfederal entities carry out various types of ocean-based research and analysis efforts.

Congress may be interested in the potential of federal ocean-based research to inform the nation’s evolving understanding of
the physical ocean and its resources. Some scientists and environmental and climate advocates argue that continuous,
systematic ocean observations (e.g., temperature, salinity) may help identify climate impacts that contribute to ocean change
(e.g., warming, sea ice melt) and, in turn, may affect society. Additionally, some experts note that using scientific knowledge
of the ocean’s current state to inform federal policy has both economic and environmental benefits. For example, federally
collected and monitored ocean-based weather, climate, and physical Earth (i.e., seismic) data are used for early warning alerts
for severe events (e.g., hurricanes, tsunamis) headed for the United States and its territories. At the same time, ocean-based
research can be costly and time consuming, and some may question the relative priority of individual efforts, compared to
both other ocean-based efforts and other federal activities.

Congressional Research Service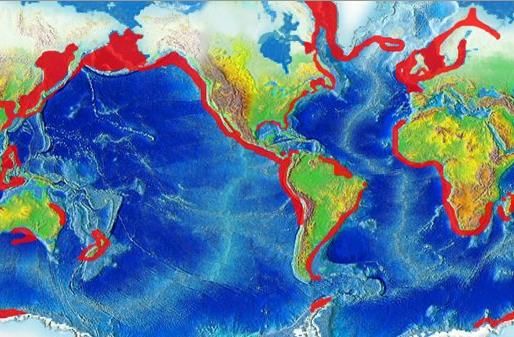
Federal Involvement in Ocean-Based Research and Development
Contents
Introduction ..................................................................................................................................... 1
Federal Ocean Research Infrastructure and Equipment .................................................................. 2
National Oceanic and Atmospheric Administration .................................................................. 2
National Aeronautics and Space Administration ....................................................................... 5
United States Geological Survey............................................................................................... 7
Bureau of Ocean Energy Management ..................................................................................... 7
National Science Foundation .................................................................................................... 8
Office of Naval Research ........................................................................................................ 10
Oceanographic Data ...................................................................................................................... 10
Ocean Data Trends and Climate Change................................................................................. 14
Selected Issues for Congress ......................................................................................................... 15
Ocean Data and Research Needs Related to Climate Change ................................................. 16
Applications for Deep-Sea Exploration and Bathymetric Data .............................................. 18
Deep-Sea Geologic Hazards ............................................................................................. 18
Environmental Protection of the Deep Sea ....................................................................... 19
Deep-Sea Natural Resources............................................................................................. 20
Figures
Figure 1. NOAA Argo Profiling Float 10-Day Data Collection Cycle............................................ 5
Figure 2. Major Areas of Coastal Upwelling................................................................................. 13
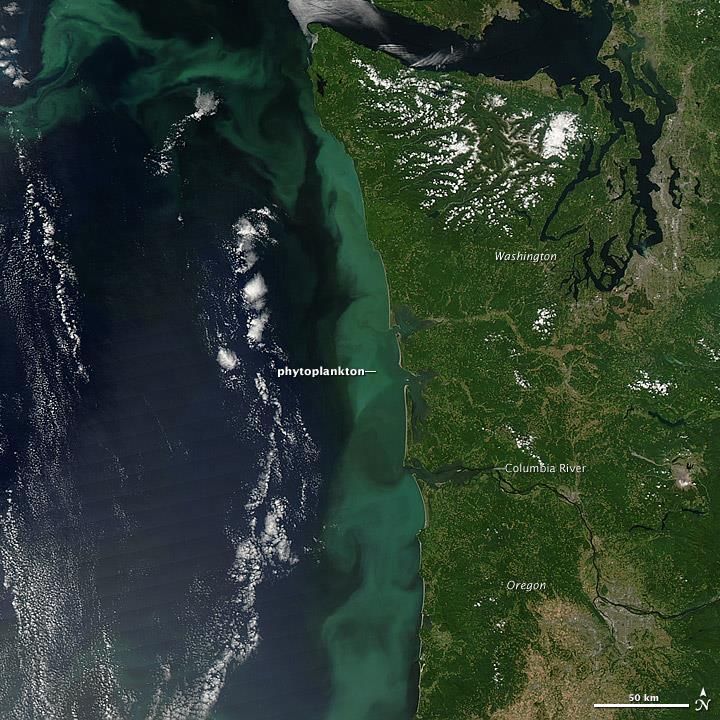
Figure A-1. Phytoplankton Bloom off the Washington Coast ....................................................... 26
Tables
Table 1. Selected Physical Oceanographic Variables ..................................................................... 11
Table 2. Selected Biogeochemical Oceanographic Variables ........................................................ 13
Table 3. Congressional Appropriations Applied to NOAA Argo Program .................................... 17
Appendixes
Appendix A. Background on Selected Physical Oceanographic Variables ................................... 22
Appendix B. Background on Selected Biogeochemical Oceanographic Variables ....................... 28
Contacts
Author Information........................................................................................................................ 29
Congressional Research ServiceFederal Involvement in Ocean-Based Research and Development Introduction The Atlantic, Indian, Pacific, Arctic, and Southern Oceans (collectively, the global ocean) are interconnected and comprise 71% of Earth’s surface. The global ocean provides societal resources (e.g., coastal protection, storage of carbon) and affects various economic sectors (e.g., fisheries, marine transportation). For example, the ocean influences Earth’s weather and so can affect things such as the amount of snowpack and spring melt, the strength and intensity of hurricanes making landfall, and seasonal crop yields. The ocean is also a major component of the global climate system, as it absorbs, retains, and transports heat, water, and carbon. Scientists estimate with high confidence that the global ocean has absorbed more than 90% of the atmosphere’s human-induced excess heat; since the 1980s, it has very likely absorbed between 20% and 30% of total anthropogenic (human-related) carbon dioxide (CO2) emissions.1 Climate change impacts on the ocean (e.g., warming) have affected marine fisheries, the marine tourism and recreation sector, and global food security.2 Many view the continued observation and monitoring of the global ocean as important tools for assessing natural resources and related ecosystems in the face of these impacts. Selected federal departments and agencies pursuing mission-based, long-term data collection and monitoring of the ocean include the Department of Commerce’s National Oceanic and Atmospheric Administration (NOAA); the National Aeronautics and Space Administration (NASA); the Department of the Interior’s United States Geological Survey (USGS) and Bureau of Ocean Energy Management (BOEM); and the Department of the Navy’s (DON’s) Office of Naval Research (ONR). The National Science Foundation (NSF) is an independent agency that provides grant funding for short-term ocean research projects that investigate specific hypotheses and research questions. The NSF also supports research infrastructure (e.g., research facilities, vessels, equipment and instruments, and other resources). Oceanographic data collected and studied by these federal departments and agencies—and the academic, commercial, and nonprofit research the federal government helps support—provide information to domestic policymakers, including Members of Congress. Congressional interest in federal ocean data collection and research is multifold and includes issues related to authorizing and funding specific ocean research activities and performing oversight on the implementation of federal ocean research. Congressional funding for federal departments and agencies that conduct ocean-based research allows for the continued monitoring of the ocean and the development of novel technologies to do so. In turn, Congress may use the data and knowledge gained by these federal departments and agencies to inform legislation and oversight. Ocean research may provide other benefits, such as supporting ocean-based private- sector economic activities innovation and protecting sensitive marine habitats and their wildlife. At the same time, the collection and monitoring of ocean data by the federal government can be time consuming and costly, and some may question the relative priority of individual efforts, compared to both other ocean-based efforts and other federal activities. This report provides an overview of the U.S. federal government’s efforts to collect ocean-based data through observations and monitoring and to conduct and support federal and U.S-based extramural ocean-based scientific research. It also discusses selected federal grant making efforts 1 Intergovernmental Panel on Climate Change (IPCC), “Summary for Policymakers,” in The Ocean and Cryosphere in a Changing Climate: A Special Report of the Intergovernmental Panel on Climate Change, eds. Hans-Otto Pörtner et al., 2019, p. 9. Hereinafter referred to as IPCC, Ocean and Cryosphere. 2 National Oceanic and Atmospheric Administration (NOAA) Fisheries, “Understanding Our Changing Climates,” at https://www.fisheries.noaa.gov/insight/understanding-our-changing-climate. Congressional Research Service 1
Federal Involvement in Ocean-Based Research and Development

for these purposes. The report further explores the how ocean-based data may illuminate the
impacts of climate change (e.g., data collected through NOAA’s Argo Program) and how
interagency collaboration and research on the seafloor and its environments may inform federal
policy on deep-sea geohazards and natural resources.

Federal Ocean Research Infrastructure
and Equipment
Research infrastructure contributes to the U.S. leadership role in ocean science. Federal research
infrastructure and equipment used to collect and monitor ocean data form the basis for much
ocean research. The analysis of these data has the potential to elucidate threats (anthropogenic
and natural) to the ocean and its changing nature, contribute to marine resource (offshore energy)
exploitation, maximize commercial fisheries yields, and provide warnings for marine geohazard
and storm events. The information gained from these analyses may inform federal policy on the
protection of the ocean, economic sectors that depend on marine resources, and coastal
communities.
Federal departments and agencies have established programs and projects to collect ocean data,
using federal and nonfederal assets for observations. These data are collected through various
equipment, such as satellites (NOAA, NASA, USGS); ships (NOAA, USGS, BOEM, ONR);
aircraft (NOAA, NASA); and various deployed objects, such as buoys and floats (NOAA). In
addition, federal agencies may use ocean data collected by international, regional, and private-
sector partnerships and integrate these data into federal databases; for example, the European
Organisation for the Exploitation of Meteorological Satellites’ polar satellite system contributes
to NOAA’s Joint Polar System.3 Stationary coastal equipment, such as tide and water-quality
gauges (USGS), collect and monitor local oceanographic data. Ship-based equipment allows for
detailed mapping (e.g., multibeam sonar sensors);4 exploration (e.g., human technical divers);
visualization (e.g., remote or human operated vehicles); and sampling (e.g., nets, tows, grab
samplers, sediment corers) of targeted site locations. Autonomous underwater vehicles (AUVs),
routinely launched from ships, collect and automatically send large volumes of data to a nearby
shore facility or back to the vessel.
Ocean data collection generally requires investment in time and resources. Lack of federal
funding support can halt ongoing data collection. The below sections provide examples of
individual U.S. federal department and agency ocean research efforts. The sections below do not
provide an exhaustive list of all the departments and agencies and their respective programs that
conduct ocean-based research.

National Oceanic and Atmospheric Administration
NOAA’s mission includes to better understand the natural world (ocean, climate, space, and
weather), help protect its resources, and monitor global weather and climate. To study the ocean,
NOAA uses satellites, ships, remotely operated vehicles (ROVs), AUVs, aircraft, and other
smaller deployed instruments (e.g., buoys). NOAA is structured in six line offices that cover

3 European Organisation for the Exploitation of Meteorological Satellites, “Metop Series,” at https://www.eumetsat.int/
our-satellites/metop-series.
4 A multibeam sonar sends out simultaneous sonar beams (sound waves) in a fan-shaped pattern to collect seafloor

information surrounding the ship. For more information, see the Seafloor Bathymetry section in Appendix A.

Congressional Research Service                                                                                        2
Federal Involvement in Ocean-Based Research and Development
various aspects of the natural world.5 Four of NOAA’s six line offices are applicable to this
report: National Environmental Satellite, Data and Information Service (NESDIS); Office of
Marine and Aviation Operations (OMAO); National Ocean Service (NOS); and Office of Oceanic
and Atmospheric Research (OAR). The line offices and their program offices described below are
not an exhaustive list of all ocean research carried out by NOAA but rather an illustration of the
variety of research conducted.
NESDIS manages the nation’s operational environmental satellites and makes the environmental
data collected by these satellites accessible to sources for research purposes and to enhance the
nation’s economy and security.6 Selected NOAA satellites (i.e., NOAA-20, Suomi National Polar-
Orbiting Partnership, and Jason-3) are discussed in greater detail in the “National Aeronautics and
Space Administration, below.”7
OMAO operates specialized aircraft and ships and oversees small boat and underwater activities
(including human technical diving) that help achieve NOAA’s environmental and scientific
missions. It operates 15 ships, including the Okeanos Explorer; four manned aircraft; and several
unmanned aircraft systems.8
NOS leads NOAA’s navigation and charting efforts and coordinates a federal interagency
program dedicated to coastal and ocean observations and research. NOS’s U.S. Integrated Ocean
Observing System (IOOS) provides support, funding, guidance, and advice for tracking,
predicting, managing, and adapting to environmental changes in the ocean, coastal system, and
Great Lakes.9 In addition to managing some federal ocean data and modeling systems, IOOS
integrates certain nonfederal information into these systems, which can inform decisionmaking on
coastal monitoring, coastal and ocean development, and changes in the Arctic.10
OAR conducts various aspects of ocean research across at least four offices.
The Office of Ocean Exploration and Research is the only federal organization
dedicated to exploring the deep ocean.11 NOAA’s Okeanos Explorer is outfitted
with the necessary technology to map the seafloor during research expeditions.12
NOAA uses other infrastructure, such as aircraft equipped with remote sensing
technology and submersible ROVs, to map the depth and shape of the seafloor,
complementing multibeam sonar data. This office also funds non-NOAA, U.S.-
5 NOAA, “NOAA Line Offices,” at https://www.corporateservices.noaa.gov/public/lineoffices.html.
6 NOAA, “Our Mission,” at https://www.nesdis.noaa.gov/about/our-mission.
7 NOAA, “Currently Flying,” at https://www.nesdis.noaa.gov/current-satellite-missions/currently-flying.
8 NOAA, “Fleet,” at https://www.omao.noaa.gov/find/fleet.
9 The Integrated Coastal and Ocean Observation System Act of 2009 (49 U.S.C. §§3601 et seq.) established the U.S.
Integrated Ocean Observing System. Prior to the passing of the 2009 act, no coordinated approach to coastal and ocean
observing existed; instead, nonuniform data was collected by multiple federal, tribal, state, and local agencies.
Integrated Ocean Observing System, “Senate Passing ICOOS Reauthorization,” at http://www.ioosassociation.org/
senate-passing-icoos-reauthorization-2016; NOAA, “IOOS by the Numbers,” at https://ioos.noaa.gov/about/ioos-by-
the-numbers/.
10 NOAA, “Societal Benefits,” at https://ioos.noaa.gov/about/societal-benefits/.
11 NOAA, “About NOAA Ocean Exploration,” at https://oceanexplorer.noaa.gov/about/welcome.html.
12 While the mission equipment onboard Okeanos Explorer is operated by NOAA’s Office of Ocean Exploration and
Research within OAR, the ship is managed by NOAA’s OMAO. NOAA, “NOAA Ship Okeanos Explorer: Meet the
Team,” at https://oceanexplorer.noaa.gov/okeanos/explorers/explorers.html.
Congressional Research Service 3Federal Involvement in Ocean-Based Research and Development
based researchers conducting ocean exploration to better document and
understand U.S. waters.13
The Climate Program Office manages a competitive grant program to fund high-
priority climate science research on Earth’s climate system, including its
atmosphere, ocean, land, and ice components. These grants support activities
related to climate observations; Earth system science; climate and societal
interactions; and modeling, analysis, predictions, and projections. Research
results funded by these grants aim to enable scientists to quantify the amount of
heat and CO2 uptake by the global ocean, to estimate rates of sea level rise, and to
provide adaptation tools for fisheries threatened by warming ocean waters,
among other findings.
The Ocean Acidification Program coordinates research and activities to better
understand the ocean’s chemistry; how it is changing; its rate of change; how
change varies regionally; and how marine life (e.g., coral reefs), people, and the
economy (e.g., the marine tourism and recreation sectors) are impacted. This
program also provides funds for extramural research and ensures data collected
by funded projects are archived and accessible for future research use.14
The objective of the Global Ocean Monitoring and Observing Program (GOMO),
funded under OAR’s Sustained Ocean Observing and Monitoring (SOOM),15 is
to conduct continuous, in situ observations for ocean-based research, monitoring,
and prediction. The GOMO supports more than 1 million oceanographic
observations per day,16 through various activities such as the Global Ocean
Carbon Network and the Argo Program, among others. The Global Ocean Carbon
Network aims to help researchers better understand the ocean’s role in the global
carbon cycle, including how the ocean absorbs atmospheric CO2 and distributes
carbon throughout the global ocean. The Argo Program is composed of nearly
4,000 Argo Profiling Floats (Figure 1). These floats drift with currents across the
global ocean, capturing over time a near-global record of ocean temperature,
salinity, dissolved oxygen, and pH data.17 The Agro Program is international,
with participation and program funding from over 25 countries; NOAA maintains
about half of the global fleet.18
13
NOAA, “Federal Funding Opportunity,” at https://oceanexplorer.noaa.gov/about/funding-opps/welcome.html.
14 NOAA, “Data Collection and Management,” at https://oceanacidification.noaa.gov/WhatWeDo/Data.aspx.
15 NOAA’s Sustained Ocean Observations and Monitoring (SOOM) Program, Project Activity (PPA) is a funding line
in NOAA’s budget. GOMO is the NOAA program that receives the initial allocation of the SOOM PPA; but SOOM is
not GOMO’s sole funding source. GOMO may use SOOM funds to support other programs which contribute to the
overall priorities set by GOMO. Email correspondence with NOAA, Congressional Affairs Specialist, Office of
Legislative and Intergovernmental Affairs, December 13, 2021.
16 NOAA, “Global Ocean Monitoring and Observing,” at https://globalocean.noaa.gov/About-Us.
17. NOAA, “NOAA Updates Sea Surface Temperature Dataset,” at https://www.ncei.noaa.gov/news/noaa-updates-sea-
surface-temperature-dataset.
18 NOAA, “Argo Program Achieves Milestone with Two Million Ocean Measurements,” at https://research.noaa.gov/
article/ArtMID/587/ArticleID/2398/Argo-Program-Achieves-Milestone-with-Two-Million-Ocean-Measurements.
Congressional Research Service 4Federal Involvement in Ocean-Based Research and Development
Figure 1. NOAA Argo Profiling Float 10-Day Data Collection Cycle
Source: National Oceanic and Atmospheric Administration (NOAA), “The Argo Program,” at
https://globalocean.noaa.gov/Research/Argo-Program.
Notes: At the end of the 10-day cycle, Argo floats transmit data to satellites from which it is collected and
processed for public use. Abbreviations included in the figure include kilometers = km, centimeters per second =
cm/s, minutes = min, and hours = hrs.
National Aeronautics and Space Administration
NASA studies the Earth, including its ocean and climate, the sun, and the solar system and
beyond. In the 1960s, NASA began launching satellites to monitor Earth’s weather. NASA has
since expanded the types of Earth-observing data it collects with satellites to study Earth’s
climate system.
NASA’s Earth Science Division plans, develops, and operates missions that support the science
of Earth’s atmosphere, land cover and vegetation, ocean currents and upper-ocean life, and
continental and sea ice.19 The bulleted list below is not an exhaustive list of all ocean research
missions carried out by NASA but describes selected satellites that support NASA’s Earth
observing missions and supply ocean data to researchers.
Aqua. This satellite’s mission is to collect information about Earth’s global water
cycle, including sea surface temperature (SST) and ocean color. The satellite has
19 NASA, “NASA Earth Science Division Mission,” October 18, 2021, at https://svs.gsfc.nasa.gov/30065.
Congressional Research Service 5Federal Involvement in Ocean-Based Research and Development
four operating instruments that collect and transmit high-quality data to inform
weather forecasts, carbon management, coastal management, disaster
management, and water management.20
OCO-2. This satellite is the first satellite to collect space-based measurements of
atmospheric CO2.21 These measurements help identify areas that are natural CO2
sinks, such as the ocean.
Terra. This satellite is equipped with five instruments that are capable of
comparing different aspects of Earth over time, including SST and ocean color.22
Jason-3. This NASA and NOAA partnership satellite is equipped with
technology to collect detailed sea level measurements (altimetry) to gain insight
into ocean circulation and climate change.23
Sentinel-6. This NASA and NOAA partnership satellite is equipped with
technology capable of collecting sea level measurements within 1 centimeter of
precision.24
GRACE-FO. This satellite broadly tracks Earth’s water, including ice sheets and
glaciers, and sea level changes due water additions to the ocean.25
ICESat-2. This satellite measures Earth’s ice coverage within 4 millimeters of
precision using its only onboard instrument, the Advanced Topographic Laser
Altimeter System.26
Landsat 8 and 9. These satellites are a collaboration between NASA and USGS
that primarily collect data on Earth’s land surface (i.e., not the ocean) but also
provide information on shallow coastal seafloor bathymetry.27
Suomi National Polar-Orbiting Partnership (NPP). This satellite was
developed by NASA for NOAA’s Joint Polar Satellite System to provide data for
weather forecasts and extreme storm events. Suomi NPP carries five research
instruments to monitor the climate system (e.g., ocean color) while collecting the
operational requirements for weather forecasting (e.g., SST), demonstrating the
multifunctional nature of satellite technology.28
NOAA-20. This satellite, Suomi NPP’s successor and also built by NASA for
NOAA’s Joint Polar Satellite System, collects data on SST and ocean color.29
20 NASA, “Aqua Earth-Observing Satellite Mission,” at https://aqua.nasa.gov/.
21 NASA, “Quick Facts,” at https://ocov2.jpl.nasa.gov/mission/quick-facts/.
22 NASA, “Terra Instruments,” at https://terra.nasa.gov/about/terra-instruments.
23 NASA, “Jason-3,” at https://www.jpl.nasa.gov/missions/jason-3.
24
NASA, “Sentinel-6 Mission Overview,” at https://www.nasa.gov/sentinel-6/overview.
25 NASA, “Mission,” at https://gracefo.jpl.nasa.gov/mission/overview/.
26 Anna Heiney, “ICESat-2 Successfully Launched on Final Flight of Delta II Rocket,” NASA ICESat-2 blog,
September 15, 2018, at https://blogs.nasa.gov/icesat2/.
27 NASA, “Landsat 8 Mission Details,” at https://landsat.gsfc.nasa.gov/satellites/landsat-8/landsat-8-mission-details/.
For more information, see CRS Report R46560, Landsat 9 and the Future of the Sustainable Land Imaging Program,
by Anna E. Normand.
28 NASA, “NPP Mission Overview,” at https://www.nasa.gov/mission_pages/NPP/mission_overview/index.html. For
more information on NOAA’s polar-orbiting weather satellites, see CRS Report R44335, Minding the Data Gap:
NOAA’s Polar-Orbiting Weather Satellites and Strategies for Data Continuity, by Peter Folger.
29 NOAA, Joint Polar Satellite System, “Mission and Instruments,” at https://www.jpss.noaa.gov/
Congressional Research Service 6Federal Involvement in Ocean-Based Research and Development
United States Geological Survey
The USGS is a scientific agency within the Department of the Interior (DOI).30 USGS scientists
monitor, analyze, and predict the current and evolving dynamics of the Earth. A core USGS
mission is mapping, which includes coastal maps generated from bathymetric surveys; 31
generally, NOAA is the primary federal source for ocean bathymetric data. The USGS also
collects, monitors, and analyzes natural resources data, including for resources found in the
ocean, such as sand and gravel for construction and minerals required for emerging
technologies.32
At least three selected USGS programs are engaged in ocean-based research.
The Coastal/Marine Hazards and Resources Program, within the Natural Hazards
Mission Area, collects and manages data, such as information about gas hydrates,
hydrothermal vent deposits, and rare Earth minerals.33 This program also
supports other ocean science topics, such as mapping the extent of the continental
shelf; studying factors related to sea level rise; and conducting research on ocean
ecosystems, including benthic ecosystems (i.e., organisms living on or in seafloor
sediments).
The Groundwater and Streamflow Information Program, within the Water
Resources Mission, deploys, operates, and retrieves sensors for coastal storm
events, including tide gauges and other water sensors (see Table 1 and Table 2).
The Coastal/Marine Hazards and Resources Program augments data collection
and other activities associated with storm events as needed.34
The Climate Research and Development Program, within the Ecosystems
Mission Area, supports monitoring of the Arctic, sea ice, and sea level rise. This
program also collects and analyzes deep-sea sediments to reconstruct changes in
past climate and oceanographic conditions.
Bureau of Ocean Energy Management
BOEM, an agency within DOI, manages the development of the nation’s energy and mineral
resources on the outer continental shelf (OCS), which includes submerged lands, subsoil, and
seabeds under U.S. jurisdiction.35 BOEM conducts geological and geophysical (G&G) surveys to
mission_and_instruments.html.
30 For more background on the USGS, see CRS In Focus IF11433, The U.S. Geological Survey (USGS): FY2021
Appropriations Process and Background, by Anna E. Normand.
31 U.S. Geological Survey (USGS), “Sea Floor Mapping Group,” at https://www.usgs.gov/centers/whcmsc/science/sea-
floor-mapping-group?qt-science_center_objects=0#qt-science_center_objects.
32 USGS, “Ocean Resources,” at https://www.usgs.gov/centers/whcmsc/science/ocean-resources; USGS, “Celebrate
June as Oceans Month,” June 2, 2016, at https://www.usgs.gov/news/featured-story/celebrate-june-oceans-month.
33 USGS, “Coastal and Marine Hazards and Resources Program,” at https://www.usgs.gov/natural-hazards/coastal-
marine-hazards-and-resources/science/ocean-resources.
34 USGS funding for these activities primarily comes from reimbursable partners (typically the Federal Emergency
Management Agency) as storm events occur. Email correspondence with USGS, Congressional Liaison, Congressional
Liaison Office, on January 7, 2022.
35 The Outer Continental Shelf Lands Act of 1953 (43 U.S.C. §§1331-1356b) defines the outer continental shelf (OCS)
as all federally controlled submerged lands, subsoil, and seabed. The OCS generally begins 3 nautical miles
(international nautical mile = 6,076.1 feet) off the coastline and extends for at least 200 nautical miles to the edge of the
exclusive economic zone, or farther if the continental shelf extends beyond 200 nautical miles. For more information,
Congressional Research Service 7Federal Involvement in Ocean-Based Research and Development
obtain data on oil and gas reserves located on the OCS, identify sites for offshore renewable
energy structures, and locate marine mineral resources.36
BOEM conducts two types of G&G surveys: deep penetration airgun surveys and high-resolution
geophysical (HRG) surveys to characterize the subsurface of the seafloor (i.e., different layers of
rock beneath the seafloor).37 Deep penetration airgun surveys are also used for oil and gas
exploration. HRG surveys can be used for oil and gas exploration, siting for renewable energy
structures, and sand and gravel identification. HRG equipment can include multibeam sonars,
sidescan sonars, and sub-bottom profilers. These surveys typically operate at higher frequencies
and image smaller structures at higher levels of detail as compared with airgun surveys.
BOEM has four programs, among other activities, that involve ocean-based studies and the
management of related scientific research and data.
The Conventional Energy Program, among other activities, conducts assessments
of the oil and gas resource potential on the OCS, including G&G surveys to
obtain data useful for oil and gas exploration, inventories of oil and gas reserves,
and economic evaluations.
The Renewable Energy Program, among other activities, funds and manages
scientific research related to renewable energy projects on the OCS (e.g.,
potential environmental and ecological stressors during the construction and
operation of offshore renewable energy facilities).
The Environmental Program funds and manages relevant environmental studies
including, but not limited to, physical oceanography, protected species,
economics, and cultural resources.
The Marine Minerals Program, among other activities, conducts environmental
studies and assessments, performs resource evaluation studies, and contributes
data for bathymetric maps.38 Initiatives include the National Offshore Critical
Mineral Inventory, the National Offshore Sand Inventory, and the Marine
Minerals Information System (with information on OCS sand and gravel
resources).
National Science Foundation
NSF promotes the progress of science by funding extramural research, largely through grants
awarded in support of academic research.39 The types of data collected, and the modes of data
collection and observation, depend on the awarded research project. Funding duration for NSF
grants generally ranges from one to five years, with an average of three years for research
grants.40
see CRS Report RL33404, Offshore Oil and Gas Development: Legal Framework, by Adam Vann.
36 Bureau of Ocean Energy Management (BOEM), “Fact Sheet: Geological and Geophysical (G&G) Surveys,” at
https://www.boem.gov/sites/default/files/about-boem/BOEM-Regions/Atlantic-Region/GandG-Overview.pdf.
37 Bureau of Ocean Energy Management (BOEM), “Fact Sheet: Geological and Geophysical (G&G) Surveys,” at
https://www.boem.gov/sites/default/files/about-boem/BOEM-Regions/Atlantic-Region/GandG-Overview.pdf.
38 Bathymetric maps give the ocean’s depth relative to sea level and show the three-dimensional features of the seafloor
(similar to topographic maps). NOAA, “What Is Bathymetry,” at https://oceanservice.noaa.gov/facts/bathymetry.html.
39 For more information on the National Science Foundation (NSF), see CRS Report R46753, The National Science
Foundation: An Overview, by Laurie A. Harris.
40 NSF, Merit Review Process: Fiscal Year 2019 Digest, December 2020, pp. 7, 20, https://www.nsf.gov/nsb/
Congressional Research Service 8Federal Involvement in Ocean-Based Research and Development The Division of Ocean Sciences (OCE) within the NSF Directorate for Geosciences, provides funding support to advance understanding of all aspects of the global ocean (including human interactions),41 and gives the nation’s academic community the opportunity to obtain funds to work towards advancing this understanding through competitive grants. Aspects of ocean research may also be supported by other NSF Directorates (e.g., Directorate for Biological Sciences, Directorate for Mathematical and Physical Sciences). In general, about 30% of OCE’s funding each year goes to new research grants, with the remaining 70% supporting grants made in previous years and research infrastructure.42 Also within NSF’s Directorate for Geosciences is the Office of Polar Programs (OPP), which includes research funding for scientists supported by NSF and by other U.S. departments and agencies studying the polar regions, including the Southern and Arctic Oceans. OPP leverages both interagency and international partnerships. Both OCE and OPP support the U.S. Global Change Research Program (USGCRP),43 including infrastructure programs that focus on observing today’s changing ocean while better understanding past climate events to inform future climate change. For FY2022, the USGCRP established five research themes, including the Ocean’s Role in Climate Change.44 NSF is part of the University-National Oceanographic Laboratory System (UNOLS),45 which provides a forum for the research and education community and the federal government to work cooperatively on oceanographic research while coordinating a federally supported Academic Research Fleet (ARF).46 For example, the R/V Sikuliaq is a research vessel owned by the NSF and operated by the College of Fisheries and Ocean Sciences at the University of Alaska Fairbanks, specializing in polar-focused ocean research. OCE also oversees the Regional Class Research Vessel (RCRV) project, which is currently funding the construction of three ships for inclusion in the ARF to support the needs of researchers in coastal zones.47 The transition of these three new ships from construction to operations is estimated for Fall 2022.48 NSF also provides support to the International Ocean Discovery Program (IODP), an international marine research collaboration that uses research platforms to drill and recover seafloor sediments that can be used to study the dynamics of the sub-seafloor and the past 200 publications/2020/merit_review/FY-2019/nsb202038.pdf. 41 NSF, “About the Division of Ocean Sciences (OCE),” at https://www.nsf.gov/geo/oce/about.jsp. 42 NSF, “FY 2022 NSF Budget Response to Congress—Geosciences,” p. GEO-11, at https://www.nsf.gov/about/ budget/fy2022/pdf/49_fy2022.pdf. Hereinafter referred to as “FY2022 NSF GEO Budget Response.” 43 The U.S. Global Change Research Program (USGCRP) was mandated by Congress in the Global Change Research Act of 1990 (P.L. 101-606) to coordinate federal research and investments across 13 departments and agencies to advance understanding of the changing Earth system. USGCRP, “About USGCRP,” at https://www.globalchange.gov/ about. 44 FY2022 NSF GEO Budget Response, p. GEO-10. 45 University-National Oceanographic Laboratory System (UNOLS), “UNOLS Charter,” at https://www.unols.org/ sites/default/files/UNOLS_Charter_2019.pdf. 46 ARF vessels support the needs of all federal oceanographic research stakeholders, particularly NSF, NOAA, and ONR. NSF, “FY 2022 NSF Budget Response to Congress—Major Research Equipment and Facilities Construction,” p. MREFC-35, at https://www.nsf.gov/about/budget/fy2022/pdf/58f_fy2022.pdf. 47 Regional Class Research Vessels (RCRV) was designed to support the eight high-priority science questions identified in the 2015 National Academies report on sea change. The National Academies, “Sea Change: 2015-2025 Decadal Survey of Ocean Sciences,” 2015, at http://www.nap.edu/read/21655/chapter /1. 48 The total appropriated RCRV funds are $358.97 million, which is $16.03 million below the authorized total project cost of $356 million. NSF, “FY 2022 NSF Budget Response to Congress—Major Research Equipment and Facilities Construction,” p. MREFC-35, at https://www.nsf.gov/about/budget/fy2022/pdf/58f_fy2022.pdf. Congressional Research Service 9
Federal Involvement in Ocean-Based Research and Development

million years of Earth’s history.49 Seafloor sediments can be used to reconstruct the extent of sea
ice during past glaciation events. The sediments also reflect past changes in deep-sea circulation
patterns, which help distribute and sequester (or bury) atmospheric CO2 in the deep sea.

Office of Naval Research
ONR within the DON aims to provide science- and technology-based solutions for current and
future naval challenges. ONR oversees the execution of the science and technology (S&T)
portion of DON’s overall research and development account. ONR addresses a wide range of
potential S&T issues of interest to the Navy. A portion of those issues are ocean-based, including
ocean engineering, maritime sensing, undersea and remote sensing system development, ocean
acoustics, Arctic changes, and physical oceanography monitoring.
ONR and NSF are the two primary federal support agencies of the UNOLS fleet of academic
research vessels. ONR owns three UNOLS academic research vessels and, together with the
operating institutions, coordinates their research missions and ship schedules.
The Department of the Navy’s Naval Oceanographic Office (NAVOCEANO) collects and
analyzes oceanographic data to support national security and provide knowledge of the maritime
battlespace. Civilian and military members of NAVOCEANO are generally qualified as
hydrographers and survey technicians capable of hydrographic surveys (descriptions of seafloor
features) anywhere in the world.50

Oceanographic Data
Oceanographic data consist of measurements of the physical state of the ocean (e.g., sea level is a
physical variable) and the amount of chemical elements in the seawater (e.g., dissolved oxygen is
a biogeochemical variable). Oceanographic data provide a basis for insights into the ocean
ecosystem and its changing environment, aspects of climate change, and the distribution and
availability of marine resources. Physical oceanographic data (Table 1) also can provide
information on oceanographic processes, such as ocean upwelling (Figure 2) and ocean current
and circulation patterns.51 Whereas an oceanographic variable can provide insight into various
characteristics of the ocean, the combination of more than one physical or biogeochemical
variable often can provide additional confidence about the scientific interpretations of the ocean’s
current and future state through scientific modeling studies. Select common physical
oceanographic data are summarized below in Table 1. These data are discussed in more detail in
Appendix A.

49 Jason Daley, “This 340-Million-Year-Old Ocean Crust Could Date Back to Pangaea,” Smithsonian Magazine,
August 17, 2016, at https://www.smithsonianmag.com/smart-news/oldest-bit-seafloor-discovered-mediterranean-
180960153/.
50 NAVOCEANO, “Fleet Survey Team,” at https://www.cnmoc.usff.navy.mil/Organization/Naval-Oceanographic-

Office/Fleet-Survey-Team/.
51 Ocean upwelling occurs when wind energy pushes sea surface water in a specific direction, allowing for deep water

to move to the surface. Upwelled waters are rich in nutrients and ocean upwelling is a natural fertilization process for
the surface ocean, stimulating the base of the marine food web. For more information on ocean upwelling, see text box
entitled “Ocean Upwelling” in Appendix A. NOAA, “What Is Upwelling?” https://oceanexplorer.noaa.gov/facts/
upwelling.html.

Congressional Research Service                                                                                        10
Federal Involvement in Ocean-Based Research and Development
Table 1. Selected Physical Oceanographic Variables
(common physical oceanographic data collected and studied by federal departments and agencies)
Physical Oceanographic Instrumentation and
Variable Equipment Examples Selected Uses/Purposes
Ocean Temperature Argo Profiling Floats (NOAA);a Forecast and track pending
Unmanned Surface Wave Gliders short- and mid-term weather
(NOAA);b CTD Sensors events (including storms and
(NOAA/USGS);c Research Vessels hurricanes) and long-term
(NOAA);d Submersible ROVs climate patterns, such as the El
(NOAA);e Earth-Observing Niño Southern Oscillation;h
Satellites (NOAA/NASA);f Water- Track ocean circulation
Quality Gauge (USGS)g patterns, such as the Gulf
Stream;i
Monitor ocean upwelling,j
which can be applied to track
the occurrence of specific
marine species
Ice Earth-Observing Satellites Understand impact of climate
(NOAA/NASA);k Research Vessels change on polar regions;o
(NSF);l Moored (Stationary) Buoys Predict and quantify rate of sea
(NOAA);m Aircraft (NASA)n level rise;o
Predict freshening (salinity
decline) of surface ocean water
in polar regionso
Sea Level Earth-Observing Satellites Predict coastal sea level trends
(NOAA/NASA);p Tide Gauges and flooding;i
(NOAA/USGS);q Water-Level Quantify the rate of sea level
Sensors (USGS)g rise;o
Inform safe vessel navigationr
Chlorophyll (ocean color) Earth-Observing Satellites Monitor ocean upwelling and
(NOAA/NASA)j provide an estimate for living
phytoplankton in the near-
surface waterj
Seafloor Bathymetry Research Vessels Equipped with Quantify water depth;u
Geological and Geophysical Survey Provide information on
Equipment (NOAA/BOEM/USGS);s seafloor sediment type that
Submersible ROVs (NOAA);e could aid siting of natural
Aircraft Equipped with lidar resources;v
(NOAA);t Earth-Observing
Satellites (NASA/USGS)i Identify seafloor geologic
features (faults or subduction
zones) that could produce
natural hazards (earthquakes
or tsunamis);u
Determine the extent of the
U.S. continental shelf;w
Inform safe vessel navigationu
Source: For additional information and source data, refer to Appendix A.
Notes: BOEM = Bureau of Ocean Energy Management; CTD Sensors = Conductivity, Temperature, and Depth
Sensors; lidar = light detection and ranging; NASA = National Aeronautics and Space Administration; NOAA =
National Oceanic and Atmospheric Administration; National Science Foundation = NSF; ONR = Office of Naval
Research; ROV = remote-operated vehicle; USGS = U.S. Geological Survey.
Congressional Research Service 11Federal Involvement in Ocean-Based Research and Development
a. NOAA, “Argo Center,” at https://www.aoml.noaa.gov/phod/argo/.
b. Wave gliders are inexpensive surfboard-looking autonomous vehicles that collect surface ocean data.
NOAA, “Surface Wave Gliders,” at https://www.pmel.noaa.gov/edd/surface-wave-gliders.
c. A Conductivity, Depth, and Temperature (CDT) sensor detects how the conductivity and temperature of
the seawater changes with water depth, which can be used to derive salinity. NOAA, “What Does “CDT”
Stand For?” at https://oceanexplorer.noaa.gov/facts/ctd.html.
d. NOAA, “Observation Platforms: Vessels,” at https://oceanexplorer.noaa.gov/technology/vessels/
vessels.html.
e. NOAA, “Remotely Operated Vehicle Deep Discoverer,” at https://oceanexplorer.noaa.gov/technology/subs/
deep-discoverer/deep-discoverer.html.
f. NASA, “Ocean Temperature,” https://podaac.jpl.nasa.gov/SeaSurfaceTemperature; NOAA, “How Are
Satellites Used to Observe the Ocean?” at https://oceanservice.noaa.gov/facts/satellites-ocean.html.
g. USGS, “Storm-Tide Monitoring,” June 9, 2018, at https://www.usgs.gov/special-topics/water-science-school/
science/storm-tide-monitoring.
h. NOAA; “SST—Sea Surface Temperature,” at https://www.climate.gov/maps-data/data-snapshots/data-
source/sst-sea-surface-temperature; NASA, “Recipe for a Hurricane,” at https://www.nasa.gov/vision/earth/
environment/HURRICANE_RECIPE.html.
i. NOAA, “How Are Satellites Used to Observe the Ocean?” at https://oceanservice.noaa.gov/facts/satellites-
ocean.html.
j. Ocean upwelling occurs when wind energy pushes sea surface water in a specific direction, allowing for
deep water to move to the surface. For more information on ocean upwelling, see text box entitled “Ocean
Upwelling” in Appendix A. NASA, “Remote Sensing,” at https://science.nasa.gov/earth-science/
oceanography/living-ocean/remote-sensing; NASA, “VIRRS Single-Sensor S-NPP and NOAA-20 Anomaly
Products,” at https://coastwatch.noaa.gov/cw/satellite-data-products/ocean-color/anomaly.html.
k. NASA, “Our Mission,” at https://icesat-2.gsfc.nasa.gov/mission; NASA, “GRACE, GRACE-FO Satellite Data
Track Ice Loss at the Poles,” March 18, 2020, https://climate.nasa.gov/news/2959/grace-grace-fo-satellite-
data-track-ice-loss-at-the-poles/; NASA, “VIIRS—Sea Ice Concentration, Ice Thickness, Ice Surface
Temperature,” https://coastwatch.noaa.gov/cw/satellite-data-products/sea-ice/viirs-sea-ice-concentration-
ice-thickness-ice-surface-temperature.html.
l. NSF, “USAP Ships,” at https://www.nsf.gov/geo/opp/support/ships.jsp.
m. NOAA, “Meet 5 NOAA Buoys that Help Scientists Understand Our Weather, Climate and Ocean Health,”
at https://research.noaa.gov/article/ArtMID/587/ArticleID/2762/Meet-5-NOAA-Buoys-that-help-scientists-
understand-our-weather-climate-and-ocean-health.
n. NASA, “IceBridge—Aircraft, Instruments, Satellites,” at https://www.nasa.gov/mission_pages/icebridge/
instruments/index.html.
o. NASA, “Understanding Sea Level,” at https://sealevel.nasa.gov/understanding-sea level/global-sea
level/overview.
p. NASA, “NASA, US, European Partner Satellite Returns First Sea Level Measurements,” at
https://climate.nasa.gov/news/3052/nasa-us-european-partner-satellite-returns-first-sea level-measurements/.
q. NOAA, “What Is a Tide Gauge?” at https://oceanservice.noaa.gov/facts/tide-gauge.html.
r. NOAA, “Maritime Services,” at https://tidesandcurrents.noaa.gov/maritime.html.
s. NOAA, “Ten Years of Collecting Ocean Exploration Data from NOAA Ship Okeanos Explorer,” at
https://oceanexplorer.noaa.gov/ex10years/welcome.html; BOEM, “Geological and Geophysical (G&G)
Surveys,” at https://www.boem.gov/sites/default/files/about-boem/BOEM-Regions/Atlantic-Region/GandG-
Overview.pdf; USGS, “Marine Seismic Imaging” at https://www.usgs.gov/programs/coastal-and-marine-
hazards-and-resources-program/science/marine-seismic-imaging.
t. NOAA, “What Is Lidar,” at https://oceanservice.noaa.gov/facts/lidar.html.
u. NOAA, “How Is Bathymetric Data Used?” at https://oceanservice.noaa.gov/facts/bathyuses.html.
v. NOAA, “Sea Floor Mapping,” at https://oceanexplorer.noaa.gov/explorations/lewis_clark01/background/
seafloormapping/seafloormapping.html.
w. NOAA, “NOAA’s Participation in the U.S. Extended Continental Shelf Project,” at
https://oceanexplorer.noaa.gov/okeanos/explorations/ex1810/ecs/welcome.html. For more information, see
CRS Report R41153, Changes in the Arctic: Background and Issues for Congress, coordinated by Ronald
O'Rourke.
Congressional Research Service 12Federal Involvement in Ocean-Based Research and Development
Figure 2. Major Areas of Coastal Upwelling
Source: National Oceanic and Atmospheric Administration (NOAA), “Upwelling,” at
https://oceanservice.noaa.gov/education/tutorial_currents/03coastal4.html.
Notes: Areas of major coastal upwelling are shown in red. For additional information on ocean upwelling, see
text box entitled “Ocean Upwelling” in Appendix A.
The concentrations of biogeochemical variables (Table 2) in seawater are influenced by mixing
of waters with different concentrations (e.g., upwelled deep-sea water mixing with near-surface
water), biogeochemical processes (e.g., marine carbon cycle), and atmospheric inputs (e.g.,
diffusion of dissolved oxygen across the atmosphere-surface water interface), among other
factors. Anthropogenic CO2 emissions and agricultural or wastewater discharge have also altered
biogeochemical variables (e.g., pH and dissolved oxygen).52 Selected common biogeochemical
oceanographic data are summarized below in Table 2. These data are discussed in more detail in
Appendix B.
Table 2. Selected Biogeochemical Oceanographic Variables
(common biogeochemical oceanographic data collected and studied by federal departments and agencies)
Biogeochemical Instrumentation and
Oceanographic Variable Equipment Examples Selected Use/Purpose
Salinity Argo Profiling Floats (NOAA);a Provide insight into the water
Unmanned Wave Gliders (NOAA);b cycle;f
Submersible ROVs (NOAA);c CTD Trace ocean circulation
Sensors (NOAA/USGS);d Water- patterns;f
Quality Gauge (USGS)e
Monitor runoff from land or ice
melt;f
Predict hurricane intensityg
52
For information on the effects of human-associated discharge on coastal ocean waters, see CRS Report R46921,
Marine Harmful Algal Blooms (HABs): Background, Statutory Authorities, and Issues for Congress, by Eva Lipiec.
Congressional Research Service 13Federal Involvement in Ocean-Based Research and Development
Biogeochemical Instrumentation and
Oceanographic Variable Equipment Examples Selected Use/Purpose
Dissolved Oxygen Argo Profiling Floats (NOAA);a Serve as indicator of the health
Unmanned Wave Gliders (NOAA);b of the marine ecosystem;h
Submersible ROVs (NOAA);c Correlate with surface ocean
Water-Quality Gauge (USGS)e temperatureh
pH Argo Profiling Floats (NOAA);a Quantify rate of anthropogenic
Unmanned Wave Gliders (NOAA);b carbon uptake by the ocean;k
Moored Buoys Equipped with CO2 Serve as indicator for ocean
Sensors (NOAA);i Earth-Observing acidificationk
Satellites (NASA/NOAA);j
Source: For additional background information and source data refer to Appendix B.
Notes: CO2 = carbon dioxide; CTD Sensors = Conductivity, Temperature, and Depth Sensors; NASA =
National Aeronautics and Space Administration; NOAA = National Oceanic and Atmospheric Administration;
USGS = U.S. Geological Survey.
a. NOAA, “Argo Center,” at https://www.aoml.noaa.gov/phod/argo/.
b. NOAA, “Surface Wave Gliders,” at https://www.pmel.noaa.gov/edd/surface-wave-gliders; NOAA,
“Autonomous Surface Vehicles,” at https://www.pmel.noaa.gov/co2/story/Autonomous+Surface+Vehicles.
c. NOAA, “Remotely Operated Vehicle Deep Discoverer,” at https://oceanexplorer.noaa.gov/technology/subs/
deep-discoverer/deep-discoverer.html.
d. A Conductivity, Temperature, and Depth (CDT) sensor detects how the conductivity and temperature of
the seawater changes with water depth, which can be used to derive salinity. NOAA, “What Does ‘CDT’
Stand For?” at https://oceanexplorer.noaa.gov/facts/ctd.html.
e. USGS, “Storm-Tide Monitoring,” June 9, 2018, at https://www.usgs.gov/special-topics/water-science-school/
science/storm-tide-monitoring.
f. NASA, “Salinity/Density,” at https://podaac.jpl.nasa.gov/SeaSurfaceSalinity.
g. NOAA, “Measuring Salt in the Ocean May Be Key to Predicting Hurricane Intensity,” December 16, 2021,
at https://research.noaa.gov/article/ArtMID/587/ArticleID/2819/Measuring-salt-in-the-ocean-may-be-key-to-
predicting-how-hurricanes-strengthen.
h. USGS, “Dissolved Oxygen and Water,” at https://www.usgs.gov/special-topics/water-science-school/science/
dissolved-oxygen-and-water.
i. NOAA, “Buoys and Other Autonomous Systems,” at https://www.pmel.noaa.gov/co2/story/
Buoys+and+Autonomous+Systems.
j. Joseph Salisbury et al., “How Can Present and Future Satellite Missions Support Scientific Studies that
Address Ocean Acidification?” Oceanography, vol. 28 (October 2015); NOAA, “Ocean Acidification from
Space,” June 2, 2016, at https://carbon.nasa.gov/pdfs/20160602%20NASA%20SSAI%20Gledhill.pdf.
k. Environmental Protection Agency, “Climate Change Indicators: Ocean Acidity,” at https://www.epa.gov/
climate-indicators/climate-change-indicators-ocean-acidity.
Ocean Data Trends and Climate Change
Ocean data and observation trends over time have informed scientific reports that have
highlighted the nature and rate of change the global ocean has experienced, as well as the
potential impacts of these changes.
Ocean Temperature. Warming surface ocean waters affect weather patterns and
storms, including hurricanes. The 2019 Intergovernmental Panel on Climate
Change (IPCC) Special Report on the Ocean and Cryosphere in a Changing
Climate found evidence for an increase in the global proportion of category 4-5
Congressional Research Service 14You can also read