Temperature and acidity dependence of secondary organic aerosol formation from α-pinene ozonolysis with a compact chamber system
←
→
Page content transcription
If your browser does not render page correctly, please read the page content below
Atmos. Chem. Phys., 21, 5983–6003, 2021
https://doi.org/10.5194/acp-21-5983-2021
© Author(s) 2021. This work is distributed under
the Creative Commons Attribution 4.0 License.

Temperature and acidity dependence of secondary organic aerosol
formation from α-pinene ozonolysis with a compact chamber system
Yange Deng, Satoshi Inomata, Kei Sato, Sathiyamurthi Ramasamy, Yu Morino, Shinichi Enami, and
Hiroshi Tanimoto
National Institute for Environmental Studies, Tsukuba 305-8506, Japan

Correspondence: Satoshi Inomata (ino@nies.go.jp)

Received: 30 July 2020 – Discussion started: 17 September 2020
Revised: 25 February 2021 – Accepted: 15 March 2021 – Published: 21 April 2021

Abstract. Secondary organic aerosols (SOAs) affect hu-             1   Introduction
man health and climate change prediction; however, the
factors (e.g., temperature, acidity of pre-existing particles,
and oxidants) influencing their formation are not sufficiently     Secondary organic aerosol (SOA) in the atmosphere is a
resolved. Using a compact chamber, the temperature and             complex set of organic compounds which are formed through
acidity dependence of SOA yields and chemical compo-               oxidation of precursor volatile organic compounds (VOCs)
nents in SOA from α-pinene ozonolysis were systematically          of either biogenic (e.g., monoterpene and isoprene) or an-
investigated under 278, 288, and 298 K temperatures us-            thropogenic (e.g., alkanes and aromatics) origins, or both
ing neutral ((NH4 )2 SO4 ) and acidic (H2 SO4 +((NH4 )2 SO4 ))     (Hallquist et al., 2009). SOA plays important roles in the
seed aerosols. SOA components with m/z less than 400               aerosol effect on climate (Tilmes et al., 2019), air quality
were analyzed using negative electrospray ionization liquid-       (Parrish et al., 2011), and human health (Shiraiwa et al.,
chromatography time-of-flight mass spectrometry. Based on          2017). Nevertheless, it is noted in the IPCC Fifth Assessment
the slightly negative temperature dependence of the SOA            Report (AR5) that the formation of SOA has not been in-
yields, the enthalpies of vaporization under neutral and acidic    cluded in the estimation of the radiative forcing from aerosols
seed conditions were estimated to be 25 and 44 kJ mol−1 ,          because the formation is influenced by a variety of factors not
respectively. In addition, SOA yields increased with an in-        yet sufficiently quantified (Stocker et al., 2014). However, in
crease in the acidity of seed particles (solid/near-solid state)   association with the advance of research technologies, pro-
at low SOA mass loadings, when compared with the seed              cesses that influence the growth of SOA particles to sizes rel-
particle amounts. Acidity dependence analysis of the chemi-        evant for clouds and radiative forcing have been intensively
cal formula, molecular mass, and O : C ratio of the detected       investigated (Shrivastava et al., 2017).
compounds indicated the enhanced formation of multiple                The importance of the formation of low-volatility (and/or
oligomers in the wide molecular mass range with a wide             extremely low-volatility) organic compounds (LVOCs) with
range of O : C ratios under acidic seed conditions. The peak       saturation concentrations less than 10−0.5 µg m−3 through
abundances of some chemical compounds increased with an            heterogeneous/multiphase accretion processes has been
increase in the acidity of seed particles (e.g., m/z 197, 311,     highlighted in SOA formation mechanisms in recent stud-
313, 339, 355, and 383), while decreases in the peak abun-         ies (Ziemann and Atkinson, 2012; Shrivastava et al., 2017).
dances of some chemical compounds were observed (e.g.,             Semi-volatile organic compounds (SVOCs) are generated
m/z 171, 185, 215, 343, and 357). The acidity dependence           from oxidation reactions of VOCs in the gas phase. Het-
could be explained by acid-catalyzed heterogeneous reac-           erogenous/multiphase reactions of SVOCs on particles are
tions or acid-catalyzed decomposition of hydroperoxides. In        thought to contribute to the formation of LVOCs in SOA.
addition, organosulfate (OS) formation was observed under          Earlier acid-catalyzed heterogeneous reaction studies (Jang
acidic seed conditions. Six out of the 11 detected OSs were        et al., 2002; Hallquist et al., 2009; Ziemann and Atkinson,
potentially formed via the aldehyde + HSO−    4 pathway.
                                                                   2012) proposed the formation of hemiacetals, aldol products,
                                                                   and organosulfates, among others, in the presence of acidic

Published by Copernicus Publications on behalf of the European Geosciences Union.
5984                                                   Y. Deng et al.: Temperature and acidity dependence of SOA formation

seed particles, which prompted the notion that the acidity of       major atmospheric oxidation pathway, which is estimated
pre-existing particles is one of the key factors that influence     to account for 46 % of reacted α-pinene (Capouet et al.,
SOA formation.                                                      2008). Previous studies regarding α-pinene ozonolysis in-
   The influence of the acidity of pre-existing particles on        dicate that both SOA yields and chemical compositions in
SOA formation has been investigated in both chamber exper-          SOA are influenced by the air temperature and aerosol acid-
iments and field measurements. From chamber experiments,            ity (Czoschke et al., 2003; Gao et al., 2004; Iinuma et al.,
Eddingsaas et al. (2012) observed the clear uptake of sev-          2004, 2005; Czoschke and Jang, 2006; Jang et al., 2006;
eral SVOCs (e.g., α-pinene oxide and α-pinene hydroxy hy-           Northcross and Jang, 2007; Surratt et al., 2007, 2008; Hal-
droperoxides) after the injection of acidic particles into the      lquist et al., 2009; Saathoff et al., 2009; Kristensen et al.,
α-pinene OH oxidation system under low-NOx conditions               2014, 2017). Pathak et al. (2007b) found that the SOA yields
(photooxidation for 4 h, lights off, and contents in the dark       show a weak temperature dependence in the range of 15 to
for 2 h followed by the injection). However, no apparent up-        40 ◦ C and a stronger temperature dependence between 0 and
take was observed after the injection of neutral particles. Shi-    15 ◦ C. Saathoff et al. (2009) parameterized the temperature
raiwa et al. (2013a) observed the evident formation of perox-       dependence of the two-product SOA yield parameters using
yhemiacetals after gaseous tridecanal was injected into the         a dataset including several previous studies as well as their
dodecane photooxidation system under dry, ammonium sul-             own comprehensive measurements from 243 to 313 K. In
fate seed particles and low-NOx conditions (photooxidation          general, a negative temperature dependence of the α-pinene
for 4 h, lights off, and contents in the dark for 2 h followed      ozonolysis SOA yields could be confirmed. While enhance-
by the injection), which was believed to have been catalyzed        ments of SOA yields from α-pinene ozonolysis reactions un-
by the presence of acids generated in the low-NOx dode-             der acidic seed aerosol conditions compared with neutral
cane mechanism. However, the influence of the acidity of            seed conditions have been generally observed in previous
pre-existing particles on SOA yields from chamber experi-           studies (Czoschke et al., 2003; Gao et al., 2004; Iinuma et
ments is poorly understood. Previous studies have reported          al., 2004, 2005; Czoschke and Jang, 2006; Jang et al., 2006;
complex results. For example, Eddingsaas et al. (2012) re-          Northcross and Jang, 2007), the degree of enhancement var-
ported greater SOA yields under acidic than under neutral           ied probably because of the different experimental settings
seed conditions from photooxidation of α-pinene under high-         among the studies. For example, the study of Czoschke et
NOx conditions and no influence of seed particle acidity on         al. (2003), Iinuma et al. (2004), Czoschke and Jang (2006),
SOA yields under low-NOx conditions. Field studies also re-         Jang et al. (2006), and Northcross and Jang (2007) reported
ported inconsistent results on the influence of acidity on SOA      enhancement ranges of 21 %–87 % from weak acid seed con-
formation. Some researchers reported that SOA formation             ditions to high acid seed conditions. Interestingly, studies of
was enhanced under more acidic conditions (Chu et al., 2004;        Gao et al. (2004) reported smaller enhancement (8 %–15 %)
Lewandowski et al., 2007; Zhang et al., 2007; Hinkley et al.,       of SOA yields when the initial α-pinene concentrations were
2008; Rengarajan et al., 2011; Zhou et al., 2012), whereas          high, and the study of Iinuma et al. (2005) reported both in-
others reported little or no enhancement under acidic con-          creases and decreases in SOA yields under acidic seed con-
ditions (Takahama et al., 2006; Peltier et al., 2007; Tanner et     ditions. It turned out that OH radical scavengers, which are
al., 2009). Other factors, such as temperature, humidity, NOx       known to play an important role in influencing SOA yields
concentration level, and oxidation agents, might have also af-      (Iinuma et al., 2005; Na et al., 2007), were applied in the
fected the results of the aforementioned studies in addition        studies of Gao et al. (2004) and Iinuma et al. (2005), but not
to the acidity of pre-existing particles (Jang et al., 2008), but   applied in the studies of others.
they are also not well understood. For example, the relative           With respect to chemical compositions, Kristensen et
importance of the temperature dependencies of the volatil-          al. (2017) compared the chemical compositions of α-pinene
ities of oxidation products and of the gas-phase and multi-         ozonolysis SOA formed at temperatures of 293 and 258 K
phase chemical reactions, which could result in different tem-      and found that the mass fraction of carboxylic acids in-
perature dependence of SOA yields (Pathak et al., 2007b; von        creased at 258 K compared to 293 K, while the formation of
Hessberg et al., 2009), is still not well constrained. This mo-     dimer esters was suppressed at the sub-zero reaction temper-
tivated the current study to develop a new compact chamber          ature. Compared with neutral seed conditions, enhanced for-
system, in which SOA formation reactions under controlled           mation of large molecules under acidic seed conditions has
temperature, humidity, oxidation agents, and seed particle          been reported by Gao et al. (2004) and Iinuma et al. (2004).
acidity can be easily performed.                                    Gao et al. (2004) additionally reported less abundant small
   Monoterpenes are known to be a large source of SOA in            oligomers (e.g., a compound with molecular mass of 358)
the global atmosphere (Kelly et al., 2018). α-Pinene is the         under acidic seed conditions. This research indicates that sys-
dominant monoterpene and the second most emitted VOC                tematic studies of α-pinene ozonolysis SOA formation under
following isoprene (Guenther et al., 2012; Messina et al.,          specific experimental settings are warranted to clarify tem-
2016). It can react rapidly with atmospheric oxidants in-           perature and acidity dependence.
cluding O3 , OH, and NO3 radicals, and ozonolysis is the

Atmos. Chem. Phys., 21, 5983–6003, 2021                                              https://doi.org/10.5194/acp-21-5983-2021
Y. Deng et al.: Temperature and acidity dependence of SOA formation                                                      5985

   Furthermore, enhanced formation of organosulfates (OSs)      evaluation of the thermostat capacity of the chamber under
from α-pinene oxidation under acidic seed conditions has        dark conditions is presented in Text S1 in the Supplement,
been suggested by previous studies (Surratt et al., 2007,       which indicates that the temperature inside the chamber
2008; Iinuma et al., 2009; Duporte et al., 2020). OS has        was well controlled (varied within ±1 ◦ C). The chamber is
been regarded as an important aerosol component, account-       collapsible and is operated at atmosphere pressure.
ing for up to 30 % of organic mass in PM10 and also as an an-      For a typical experimental run, a total volume of 0.6 stan-
thropogenic pollution marker in the past 2 decades (Iinuma      dard cubic meters (sm3 ) of G3 pure air (CO2 < 1 ppmv, CO
et al., 2007, 2009; Surratt et al., 2007, 2008; Riva et al.,    < 1 ppmv, THC < 1 ppmv, and dew temperature < −70 ◦ C)
2015, 2016; Duporte et al., 2016, 2020; Brüggemann et al.,      was introduced into the Teflon chamber at a flow rate of
2020). The formation mechanisms of OS from α-pinene ox-         20 slpm for 30 min. The relative humidity (RH) of the cham-
idations have been studied under different experimental set-    ber air was adjusted by passing the G3 pure air through Milli-
tings. For example, Surratt et al. (2007) proposed OS forma-    Q water (resistivity of 18.2 M cm, total organic carbon con-
tion through esterification of hydroxyl or carbonyl groups in   tent ≤ 5 ppb) before it entered the Teflon bag. The RH of
photooxidation experiments. Surratt et al. (2008) proposed      the chamber air was measured after the experimental run by
nitrooxy organosulfate formation through esterification of      pumping the remaining chamber air into a separate small
hydroxyl groups in nighttime oxidation (i.e., NO3 -initiated    Teflon bag, to which a Vaisala RH&T probe (model, HMP76)
oxidation under dark conditions). Iinuma et al. (2009) pro-     equipped with a measurement indicator (model, M170) was
posed the acid-catalyzed ring opening of an epoxide mech-       attached. Particle number concentration and VOC mixing ra-
anism through the α-pinene oxide–acidic sulfate particle ex-    tio measurements indicate that the chamber background con-
periment. Nozière et al. (2010) proposed a sulfate-radical-     centrations of particles and VOCs were negligible, and no
initiated OS formation process of α-pinene in irradiated sul-   extra contamination was observed by the humidification pro-
fate solutions. For α-pinene ozonolysis experiments, the for-   cess of the G3 air (Text S2). α-Pinene liquid (Wako Chem-
mation of OS through reactions between SO2 and stabilized       icals, Japan) was injected into the G3 pure air line through
Criegee intermediates under dry conditions or organic perox-    a septum equipped in a Swagelok PFA Tee connector using
ides in the aqueous phase has been recently suggested (Ye et    a micro-syringe (ITO Corporation, Japan) in the middle of
al., 2018; Stangl et al., 2019; Wang et al., 2019). However,    the injection of dry pure G3 air. Diethyl ether in nitrogen gas
based on our knowledge, no study concerning OS formation        (mass fraction of 0.4 %; Takachiho, Japan) used as an OH
from α-pinene ozonolysis in the presence of sulfate particles   radical scavenger was introduced to the chamber in excess
exists.                                                         amounts (approximately 53 ppmv; 164–1963 times the ini-
   In this study, α-pinene ozonolysis experiments have been     tial concentration of α-pinene) after the introduction of pure
conducted under dark conditions in the presence of seed par-    air. Seed aerosol particles generated by a commercial atom-
ticles and an OH scavenger utilizing a self-made compact-       izer (ATM220S, Topas GmbH, Germany) were subsequently
type chamber system. The study aimed to characterize the        introduced into the Teflon chamber after being dried by a dif-
newly developed chamber as well as to study the temperature     fusion dryer containing silica gel. Neutral seed aerosols were
and acidity dependence of the yield and chemical composi-       generated from a 0.6/0.3 mol L−1 (NH4 )2 SO4 solution, and
tion of α-pinene ozonolysis SOA. Moreover, OS compounds         acidic seed aerosols were generated using a solution mixture
and their possible formation mechanisms have been targeted      of 0.25 mol L−1 (NH4 )2 SO4 and 0.25 mol L−1 H2 SO4 .
during the analysis.                                               After 30 min of stabilization, the initial concentrations
                                                                of α-pinene and seed aerosol particles were measured with
                                                                a quadrupole-type proton transfer reaction mass spectrom-
2     Experimental                                              etry instrument (PTR-QMS500, Ionicon Analytik GmbH,
                                                                Innsbruck, Austria) and a scanning mobility particle sizer
2.1    Chamber description and operation                        (SMPS, TSI classifier model 3082; differential mobility ana-
                                                                lyzer model 3081; condensation particle counter model 3772;
A    temperature-controllable   chamber    system    has        USA), respectively. The PTR-MS was operated at a flow rate
been developed for the simulation of SOA forma-                 of approximately 250 cm3 s−1 under a field strength (E/N ,
tion (Fig. S1 in the Supplement). The chamber is                where E is the electric field strength (V cm−1 ) and N is the
a cuboid shape Teflon bag (FEP; 0.7 m3 volume,                  buffer gas number density (molecule cm−3 ) of the drift tube)
900 mm × 600 mm × 1300 mm; 50 µm thickness; Take-               of 106 Td. The length of the drift tube was 9.2 cm. The drift
sue, Japan) contained in a constant temperature cabinet         voltage was set to 400 V. The temperatures of the inlet and
(HCLP-1240; W1200 mm × D703 mm × H1466 mm; NK                   drift tubes were set to 105 ◦ C, and the pressure at the drift
System, Japan). The temperature inside the cabinet was          tube was set to 2.1 mbar. The signal intensities of ions with
measured using a thermocouple attached to the inside            m/z values of 21, 30, 32, 37, 45, 46, 75, 81, and 137 were
of the cabinet (T3 in Fig. S1). The achievable operating        recorded approximately every 4.5 s. The detection sensitiv-
temperature range of the chamber was 5–40◦ . A detailed         ity of α-pinene was 3.3 ± 0.6 ncps ppbv−1 (ncps means nor-

https://doi.org/10.5194/acp-21-5983-2021                                         Atmos. Chem. Phys., 21, 5983–6003, 2021
5986 Y. Deng et al.: Temperature and acidity dependence of SOA formation malized counts per second to 106 cps of H3 O+ ). The SMPS seed conditions) (Tang and Munkelwitz, 1977). Therefore, was contained in a smaller constant temperature cabinet (LP- the influence of water on the particle phase through physical 280-E, NK System, Japan), whose temperature was adjusted partitioning or chemical reactions would be minor (Faust et to be the same as the cabinet containing the Teflon chamber. al., 2017). Before each experimental run, the Teflon bag was The sheath and sample flow rates of the SMPS were 3.0 and cleaned by filling it with pure G3 air and then evacuating all 0.3 L min−1 , respectively. The measured diameter range of the air from the bag at least three times, which took approx- the SMPS was 13.8–697.8 nm, and the data were collected imately 40 min. The very low chamber background particle every 5 min. concentrations indicate that the bag was sufficiently cleaned After obtaining the initial concentration of α-pinene and (Text S2). seed particles, excess ozone produced by irradiation of pure One Teflon filter (PF020, 47 mm diameter, Advantec O2 with vacuum ultraviolet light from a low-pressure mer- MFS) aerosol sample was collected for each different combi- cury lamp ozone generator (model 600, Jelight Compony nation of seed and temperature conditions. The sample vol- Inc., USA) was introduced into the chamber at a flow rate ume was 0.5 m3 for each sample. In total, six aerosol samples of 200 slpm for 1.5 min, to initiate the ozonolysis reactions. were collected, and they were subjected to negative electro- After the ozone generator was turned off, the introduction of spray ionization liquid-chromatography time-of-flight mass pure O2 continued for another minute to purge all generated spectrometry analyses (Sect. 2.2). A blank filter was also an- ozone into the Teflon bag. Subsequently, the G3 pure air was alyzed using a procedure similar to that of the sample filters. introduced for 1 min to facilitate the mixing of the chamber The results confirmed no substantial contamination in the air. The ozone concentration in the chamber was measured filter and the filter analysis procedure (Text S2). The acid- with an ozone monitor (model 1200, Dylec, Japan) immedi- ity of the seed particles was measured in a separate exper- ately after its introduction. For some experiments, the order iment where the seed particles were sampled on a Teflon of the introduction of α-pinene and O3 was inverted (see Ta- filter which was then extracted into 10 mL of Milli-Q wa- bles S1 and S2 in the Supplement). In the experiments in ter. The pH of the water solution was measured with a pH which O3 was first introduced, the introduction of G3 pure meter (FPH70, AS ONE, Japan). The H+ concentration was air was sustained for one more minute after the injection of ∼ 220 nmol m−3 under the acidic seed conditions. α-pinene to purge all α-pinene into the Teflon bag and to facilitate the mixing of the chamber air. In the latter case, 2.2 (−) ESI LC-TOF-MS analysis the maximum α-pinene concentrations appeared within 55 s of its introduction, which indicated that the mixing by intro- Chemical composition analysis of the Teflon filter sam- ducing air with a flow rate of 20 slpm was probably com- ples was conducted using electrospray ionization liquid- pleted within 55 s. The concentrations of both the α-pinene chromatography time-of-flight mass spectrometry (ESI LC- and aerosol particles were continually measured until the end TOF-MS) (Agilent Technologies, UK) similarly to in pre- of the experiment, which is defined in this study as 90 min vious studies (Sato et al., 2018, 2019) except that nega- after the start of the α-pinene ozonolysis reaction. The con- tive mode was used in this study whereas positive mode centration of ozone after 90 min of ozonolysis reactions was was used in those previous studies. The key configuration also measured. parameter settings were as follows: nebulizer pressure was In total, 40 experimental runs were executed under neu- 0.21 MPa, the voltage in the spray chamber was −3500 V, tral or acidic seed aerosol conditions at temperatures of 278, the drying nitrogen gas temperature was 325 ◦ C and flow 288, or 298 K (Tables S1 and S2). Notably, when the chamber rate was 5 L min−1 , and the fragmentor voltage was 175 V. temperature was set to 278 K, the temperature in the small The mass calibration and lock-mass correction were con- cabinet was set to 280 K, which is the lowest work temper- ducted using G1969-85000 and G1969-85001 tuning mix- ature of the SMPS. In the present study, we did not inves- tures (Agilent Technologies, UK), respectively. The mass tigate the influence of humidity on SOA yield. Since very resolution of the mass spectrometer (full width at half maxi- dry conditions are not realistic in ambient air, we carried out mum) was > 20 000. For the analysis, the Teflon filter sample the experiments at medium humidity (26 %–55 % RH, Ta- was sonicated in 5 mL methanol for 30 min after the addition bles S1 and S2). The differences in RH among experiments of internal standard (i.e., sodium ethyl-d5 sulfate methanol in the present study would not influence SOA formation sig- solution, Sect. 3.2). The filter extract was concentrated to nificantly, as explained in the following section. First, nucle- near dryness under a stream of nitrogen (∼ 1 L min−1 ). ation would be negligible in all experiments because of the A 1 mL formic-acid–methanol–water solution (v/v/v = high concentrations of seed particles applied. Consequently, 0.05/100/99.95) was added to the concentrated extract to the influence of RH on SOA formation would be reflected in obtain the analytical sample. A 10 µL aliquot of the analyt- the particle phase (Kristensen et al., 2014). In addition, be- ical sample was injected into the LC-TOF-MS instrument cause the seed particles were dried into effloresced states be- and separated with an octadecyl silica gel column (Inertsil fore being introduced into the chamber, all particles would be ODS-3; GL Science, Japan; 0.5 µm × 3.0 mm × 150 mm). A in solid (neutral seed conditions) or near-solid states (acidic formic-acid–water solution (0.05 % v/v) and methanol were Atmos. Chem. Phys., 21, 5983–6003, 2021 https://doi.org/10.5194/acp-21-5983-2021
Y. Deng et al.: Temperature and acidity dependence of SOA formation                                                              5987

used as mobile phases. The total flow of the mobile phases              Wall loss of gas-phase organic compounds in the Teflon
was 0.4 mL min−1 . The methanol fraction during each anal-           chamber could also cause the underestimation of SOA yields
ysis was set at 10 % (0 min), 90 % (30 min), 90 % (40 min),          (Zhang et al., 2014; Krechmer et al., 2016). Although not ex-
10 % (45 min), and 10 % (60 min). As reported previously             perimentally determined in the present study, the influence of
(Sato et al., 2007), the recovery of malic acid, whose sat-          gas-phase wall loss on SOA yields will be discussed based on
uration concentration was estimated to be 157 µg m−3 , was           the studies of Zhang et al. (2014) and Krechmer et al. (2016)
determined to be > 90 %, suggesting that evaporation loss            in Sect. 4.1.
during pre-treatment is negligible for molecules with sat-
uration concentrations of ∼ 102 µg m−3 or less. We tenta-
tively determined the molecular formulae and signal inten-           3     Data analysis
sities of 362 products (including 11 organosulfates) with dif-
                                                                     3.1    Derivation of SOA yield
ferent m/z (Table S3) based on retention times and interpre-
tation of mass spectra. In addition, the tentatively determined      SOA yield (Y ) is defined as the ratio of the mass concentra-
molecular structures and compound names of some major                tion of SOA (mSOA , µg cm−3 ) to that of the reacted α-pinene
products based on literature data and the results of this study      (1VOC , µg cm−3 ) in each experimental run.
(Sect. 4.2) are presented in Table S4.                                     mSOA
                                                                     Y=           ,                                              (1)
                                                                           1VOC
2.3   Evaluation of wall loss                                        where mSOA was calculated as the product of the increased
                                                                     volume of aerosol particles from the volume of seed parti-
The wall-loss rate of particles in the chamber was evaluated         cles and a SOA density of 1.34 g cm−3 (Sato et al., 2018),
by measuring the time evolution of the volume–size distribu-         and the arithmetic mean of the last three data of each exper-
tions of seed-only particles using the SMPS. The measure-            imental run was applied here. It was corrected for particle-
ments were carried out whenever a new Teflon bag was used            phase wall loss using the bulk-volume wall-loss rate, assum-
or the experimental conditions (i.e., temperature or seed par-       ing a first-order wall-loss constant which is independent of
ticle acidity) were changed under humid air conditions. The          particle size and reaction time (Pathak et al., 2007b). The
latest measured bulk wall-loss rate (Sect. 3.1) was applied for      size-resolved wall-loss rates were not applied because the
each SOA formation experiment.                                       bulk wall-loss rates were very close to the size-resolved rates
   In Fig. S4, size-resolved particle wall-loss rates, which         at approximately 300 nm (Fig. S4). The mode diameters of
were determined assuming first-order wall-loss constants             the volume–size distributions of the seed particles (Fig. S5)
(Wang et al., 2018a), were shown for seed particles of dif-          and of aerosol particles at the end of the ozonolysis reactions
ferent size distributions. Large wall loss was observed for          were also approximately 300 nm (Fig. S5). A detailed expla-
particles with mobility diameters less than 100 nm and larger        nation of the derivation of mSOA is presented in Text S4. Note
than 200 nm. The size distributions of the measured par-             that when the mass loadings of SOA are low, the obtained
ticle wall-loss rates presented shapes similar to that of a          mSOA and related yields retain greater uncertainties because
0.83 m3 Teflon chamber (Hu et al., 2014), whereas in the lat-        the subtracted volume concentrations of seed particles from
ter, the lowest wall-loss rates appeared in the smaller size         the measured volume concentrations are large (Mei et al.,
end (∼ 70–110 nm) and were greater (∼ 0.2 h−1 ) than those           2013). The influence of gas-phase wall loss on SOA yield
in the present study. The large apparent wall-loss rates of sub-     is discussed qualitatively in Sect. 4.1.
100 nm particles were also similar to those of a 1.5 m3 Teflon          In addition, a four-product volatility basis-set (VBS) gas–
reactor (Wang et al., 2018a). Model simulation (Text S3) and         particle partitioning absorption model (Eq. 2, Donahue et al.,
literature survey results revealed that the high wall-loss rates     2006; Lane et al., 2008) was applied to assist the interpreta-
of sub-100 nm particles were mainly caused by particle co-           tion of the observed responses of Y to the chamber tempera-
agulation (Nah et al., 2017; Wang et al., 2018a), and those          ture and the acidity of the seed aerosol.
of super-200 nm particles were likely the result of turbulent              X
                                                                                           1
deposition (Lai and Nazaroff, 2000). Figure S4 also indicates        Y=       αi                     ,                           (2)
                                                                            i
                                                                                    1 + ci∗ / mSOA
that the wall-loss rates of super-200 nm particles were rela-
tively high when the mean diameter of the seed particles was         where αi is the mass-based stoichiometric yield for product i,
relatively small. Therefore, we waited for 30 min after the          and ci∗ is the effective saturation concentration of i in µg m−3 .
introduction of seed particles to start the ozonolysis reaction      In this study, αi is assumed to be temperature-independent
so that the size distribution of the seed particles could shift to   (Pathak et al., 2007a) whereas the temperature dependence
the larger size end due to coagulation and loss of small par-        of ci∗ is accounted for using the Clausius–Clapeyron equation
ticles. In addition, we used high-concentration solutions for        as follows:

the generation of seed particles to produce larger particles in              ∗ T0        1Hvap,i 1         1
this study (Sect. 2.1).                                              ci∗ = ci,0    exp                  −       ,                  (3)
                                                                                 T           R       T0 T

https://doi.org/10.5194/acp-21-5983-2021                                              Atmos. Chem. Phys., 21, 5983–6003, 2021
5988 Y. Deng et al.: Temperature and acidity dependence of SOA formation
where T0 is the reference temperature, which is 298 K in this carbon–oxygen nonideality. For compounds containing only
∗ is the effective saturation concentration of i at
study; ci,0 C, H, and O atoms, the values for n0C , bC , bO , and bCO
T0 ; R is the ideal gas constant; and 1Hvap,i is the effective are 22.66, 0.4481, 1.656, and −0.7790, respectively. For OS
enthalpy of vaporization. The temperature dependence of Y compounds that contain C, H, O, and S atoms, the values for
is then represented by the substitution of Eq. (3) for ci∗ in n0C , bC , bO , bCO , and bS are 24.06, 0.3637, 1.327, −0.3988,
Eq. (2). We further assume a constant effective 1Hvap for all and 0.7579, respectively. The log10 C0∗ of the 362 compounds
condensable organic compounds. Thus, the four-product ba- determined by LC-TOF-MS analysis are presented in Ta-
sis set has five free parameters: α1 , α2 , α3 , α4 , and 1Hvap . ble S3. As has been noted previously, the sensitivity of
Here, c0∗ = {1, 10, 100, 1000} µg m−3 , which was set based ESI mass spectrometry is compound-specific; thus the calcu-
on the measured range of mSOA (Sect. 4.1) in this study. Mi- lated distribution includes the uncertainties that result from
crosoft Excel Solver GRG Nonlinear engine was used for the compound-specific sensitivities. The estimated volatility dis-
derivation of the five parameters under neutral or acidic seed tributions were further used to estimate the influence of gas-
particle conditions. phase wall loss on SOA yields following the method sug-
gested by Krechmer et al. (2016) (Text S5).
3.2 Derivation of the ethyl-d5-sulfate equivalent
(EDSeq.) yield of OS
4 Results and discussion
Before the extraction of filter samples, 20 µL of sodium
ethyl-d5 sulfate (EDS) methanol solution (50 µg mL−1 ) was
4.1 Performance of the Teflon chamber
added to each sample filter as an internal standard for the
quantification of OS. The ethyl-d5-sulfate equivalent (ED- An example experimental run of SOA formation from α-
Seq.) masses of OSs were determined by comparing the total pinene ozonolysis is presented in Fig. 1 (exp. no. 27). The
chromatographic peak areas of OSs to that of the EDS stan- initial concentrations of α-pinene and ozone were 145 and
dard with known mass. The EDSeq. masses of OSs were di- > 824 ppbv, respectively. The number concentration of seed
vided by the corresponding air volumes collected to obtain aerosol particles was 9.6 × 103 cm−3 , and they were concen-
the EDSeq. concentrations of OSs. The EDSeq. molecular trated in the diameter range of 80–200 nm. SOA was formed
yield of OS is defined as the ratio between the estimated ED- while α-pinene was consumed immediately at the introduc-
Seq. concentration of OS (mOS , µg cm−3 ) and the reacted tion of excess O3 . The mass concentration of SOA reached its
mass concentration of α-pinene (1VOC , µg cm−3 ). Note maximum while α-pinene was almost totally consumed ap-
that the sensitivity of ESI mass spectrometry is compound- proximately 50 min after the introduction of ozone. The time
specific; therefore, the calculated EDSeq. yield includes the variation in α-pinene conforms to an α-pinene-limited first-
uncertainties that result from compound-specific sensitivi- order chemical reaction (5τ = 47 min). With the particle-
ties. phase wall-loss correction, the SOA loading at the end of
this experiment was calculated to be 200 ± 34 µg m−3 , which
3.3 Volatility distribution analysis
resulted in a final SOA yield of 26 ± 7 % (Table S2). As
SOA compounds identified from the six filter samples the corrected SOA particle concentration was constant after
through LC-TOF-MS analysis were subjected to volatility 50 min, we consider the wall-loss correction applied here to
distribution analysis. The saturation concentration (C ∗ ) of be reasonable (Ng et al., 2006). Without particle-phase wall-
each chemical compound was calculated and then ascribed to loss correction, the concentration of SOA particles at 90 min
the volatility basis set (Donahue et al., 2006). Again, 298 K would be underestimated by approximately 40 %. The ob-
was used as the reference temperature (T0 ). For compounds served particle number–size distribution shifted to a much
whose chemical structures have been suggested by previous greater but narrower size range of 200–300 nm at the end of
researchers, the SPARC online calculator (Hilal et al., 2003; the experiment. Evolution of the particle number–size distri-
Sato et al., 2018) was used for the derivation of their C0∗ . bution is presented in Fig. S6.
For other compounds, including organosulfates, the follow- The measured SOA mass yields at 298 K under neutral
ing equation from Li et al. (2016) was applied: seed conditions were compared with those of Pathak et
al. (2007a) and other experimental studies (Fig. 2). In this
nC nO study, seven experiments with different initial α-pinene con-
log10 C0∗ = n0C − nC bC − nO bO − 2 bCO
nC + nO centrations (54–323 ppbv) at 298 K and neutral seeds were
− nS bS , (4) conducted under a RH condition of approximately 26 %–
27 % (Table S1). In Pathak et al. (2007a), the SOA mass
where n0C is the reference carbon number; nC , nO , and nS yields from pre-existing studies under low-NOx dark ozonol-
are the numbers of carbon, oxygen, and sulfur atoms in ysis conditions were summarized and categorized into two
the molecule, respectively; bC , bO , and bS are the respec- groups according to experimental RH conditions: RH < 10 %
tive contribution of each atom to log10 C0∗ ; and bCO is the and RH = 50 %–73 %. They further fitted the data in each
Atmos. Chem. Phys., 21, 5983–6003, 2021 https://doi.org/10.5194/acp-21-5983-2021Y. Deng et al.: Temperature and acidity dependence of SOA formation 5989
of (1–3) × 103 µm2 cm−3 (seed-to-chamber surface area ra-
tio (1–4) × 10−4 ), Rwall in the Teflon bag might be at least
twice that of the large chambers. This leads to the underes-
timation of the SOA yield of 50 % compared with the val-
ues obtained from the large chambers. A low limit correc-
tion of the gas-phase wall-loss influence for exp. no. 2 and
other experimental runs in which chemical composition anal-
ysis had been conducted based on the method of Krechmer et
al. (2016) (Text S5, Fig. 2), which confirmed that gas-phase
wall loss is one reason for the lower SOA yields in the present
study compared with Pathak et al. (2007a) and other previ-
ous studies presented in Fig. 2. We note that this is a short-
coming of the compact chamber with a 0.7 m3 volume used
in this study. We also note that the chamber is aimed at ex-
ploratory research, where multiple experiments under differ-
ent temperature, seed particle, relative humidity, oxidant, and
radiation conditions can be executed within relatively short
periods. Furthermore, the vapor wall-loss correction factors
of the SOA mass presented no obvious temperature depen-
dence (Text S5). Therefore, the temperature dependence of
SOA yields will be discussed, assuming that the underesti-
mation of the SOA yield due to the wall loss of oxidized
organic vapors does not affect the temperature dependence.
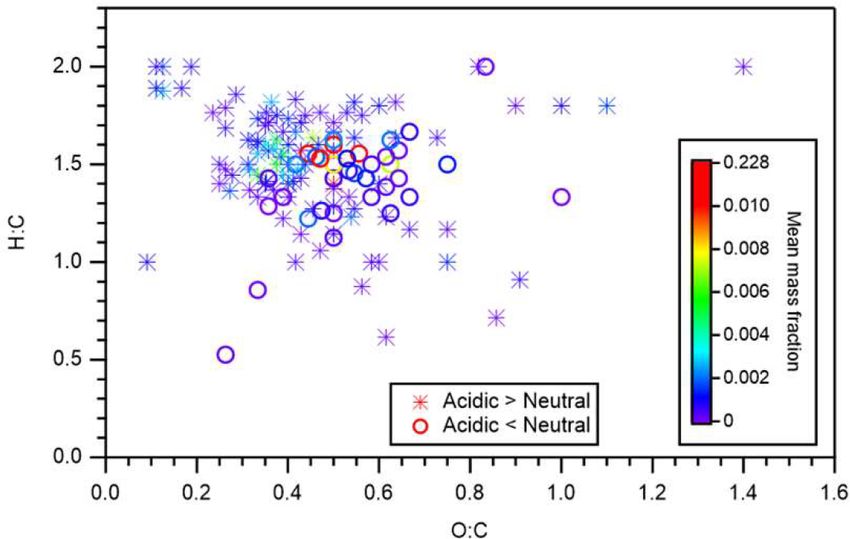
4.2 Temperature and acidity dependence of SOA yield
The yields of SOA from α-pinene ozonolysis under dif-
Figure 1. Example experimental run: (a) concentrations of α-
ferent experimental conditions in this study are summa-
pinene (black solid curve), O3 (square markers), and SOA before
(blue dashed line) and after (circle markers) particle-phase wall-loss
rized in Fig. 3. Results under neutral and acidic seed
correction compared with reaction time and (b) number–size distri- conditions are presented separately in panels (a) and (b).
butions of seed aerosol particles (black sticks) and aerosol particles In each panel, the measured SOA yields as a function
at the end of the experimental run (brown curve). The vertical dot- of SOA mass loadings are indicated by markers, and
ted line in panel (a) indicates the starting time that O3 was injected. the four-product VBS model fitting results are shown by
Data shown in this figure are from exp. no. 27 (Table S2). curves. The fitted parameters with the four-product VBS
model under neutral and acidic seed conditions are sum-
marized in Table 1. Under neutral seed conditions, the
group using the multiple product basis-set approach (Pathak fitted temperature-independent stoichiometric yields α =
et al., 2007a). The four-product basis-set fitting was adopted {0.00, 0.09, 0.09, 0.52} and 1Hvap is 25 kJ mol−1 . Un-
to compare with the experiment results of this study (Fig. 2). der acidic seed conditions, α = {0.00, 0.14, 0.05, 0.43} and
The SOA yields in this study were 25 %–60 % lower than 1Hvap is 44 kJ mol−1 . The fitting results pointed out that
that of Pathak et al. (2007a). Possible reasons may include most of the detected SOA compounds are of relatively high
lack of consideration of the wall loss of oxidized organic saturation concentration (i.e., c∗ at 298 K of 1000 µg m−3 )
vapors because the surface-to-volume ratio of the chamber under both neutral and acidic seed conditions. Weak in-
used in this study (7.1 m−1 ) was much larger than those of creases in SOA yields with decreases in the chamber tem-
previous studies (< 3 m−1 ; Pathak et al., 2007a, and refer- perature can be observed under both seed conditions. This
ences therein). According to Zhang et al. (2014), the vapor is consistent with the result in Pahtak et al. (2007b), which
wall-loss bias factor, Rwall (defined as the ratio of the SOA found a weak dependence of SOA yields on temperature in
mass when the vapor wall loss was assumed to be zero to the range of 288–303 K. As temperature decreases, SVOCs
the SOA mass when the optimal vapor wall loss rate was tend to partition into the particle phase because of the lower-
applied), was reported to be ∼ 4 at the initial seed surface ing of their volatilities.
area of ∼ 2 × 103 µm2 cm−3 (seed-to-chamber surface area The effective 1Hvap of α-pinene ozonolysis SOA derived
ratio ∼ 1 × 10⁻³ ) and ∼ 2 at the initial seed surface area from the four-product VBS fitting in this study was compared
of > 6 × 103 µm2 cm−3 (seed-to-chamber surface area ratio with previous studies (Table 2, Fig. S7). The 1Hvap values
> 3 × 10⁻³ ) during the photooxidation of toluene. As the ini- derived in this study were comparable to those in Saathoff
tial seed surface area in the present study was in the range et al. (2009) and Pathak et al. (2007a) where the experi-
https://doi.org/10.5194/acp-21-5983-2021 Atmos. Chem. Phys., 21, 5983–6003, 20215990 Y. Deng et al.: Temperature and acidity dependence of SOA formation
Figure 2. Yield comparison. SOA mass yields measured at 298 K under neutral seed conditions in the present study were compared to those
of previous studies. Colored markers represent the results of this study. Colored circular markers represent the real-time SOA yields, i.e.,
the SOA yields along with the α-pinene ozonolysis reactions from 0 to 90 min. Different experimental runs are differentiated by colors. Red
solid square markers represent the final SOA yields of the seven experiments. Horizontal error bars indicate the uncertainties of the final
SOA concentrations; vertical error bars indicate the uncertainties of the final SOA yields. However, the systematic errors from vapor wall
loss are not included. The open square indicates the result of exp. no. 2 after gas-phase wall-loss correction (Text S5). Black markers and
curves represent results of previous studies. Black markers represent experimental results. The solid and dotted black curves represent the
parameterized results from the four-product volatility basis-set fittings of previous α-pinene ozonolysis experiments under low-NOx and
dark conditions summarized in Pathak et al. (2007a). The solid curve represents results under a 50 %–73 % RH range, and the dotted curve
represents results under RH < 10 %. The dashed curve represents the results calculated using Eqs. (1), (6), (7), (10), and (11) at 303 K in
Saathoff et al., 2009. The experiments of Saathoff et al. (2009) were carried out at 303 K and 48 %–37 % and 0.02 % RH, without or with OH
scavenger (cyclohexane or 2-butanol); experiments of Wang et al. (2011) were carried out at 295 K and < 1 % RH, without OH scavenger;
experiments of Wang et al. (2014) were carried out at 295 K and < 5 % RH, without OH scavenger; experiments of Nah et al. (2016) were
carried out at 298 K and < 5 % RH, with cyclohexane as OH scavenger; experiments of Ye et al. (2018) were carried out at 296 K and 12 %–
14 % and 48 %–49 % RH, with cyclohexane as OH scavenger; experiments of Kenseth et al. (2020) were carried out at 295 K and < 5 %
RH, without OH scavenger; and experiments of Czoschke and Jang (2006) were carried out at 294–300 K and 14 %–67 % RH, without OH
scavenger. Note that all data presented in this figure are normalized to unity density (1 g cm−3 ).
Table 1. Four-product VBS model fitting results.
Seed RH Temperature c∗ values α 1Hvap
(%) (K) (µg m−3 ) (Stoichiometric yields) values (kJ mol−1 )
c1∗ c2∗ c3∗ c4∗ α1 α2 α3 α4
Neutral ∼ 26–27 298 1.000 10.00 100.0 1000 0 0.092 0.087 0.52 25
∼ 32–34 288 0.7292 7.292 72.92 729.2
∼ 45–55 278 0.5191 5.191 51.91 519.1
Acidic ∼ 26–27 298 1.000 10.00 100.0 1000 2.8 × 10⁻⁵ 0.14 0.048 0.43 44
∼ 32–34 288 0.5550 5.550 55.50 555.0
∼ 45–55 278 0.2949 2.949 29.49 294.9
ments were executed in large chambers of 10–200 m3 . It may enuder measurements which attributed 20 %–40 % of SOA
support our assumption that the temperature dependence of mass to low-volatility material (C ∗ < 0.3 µg m−3 ), most of
SOA yields was not influenced by vapor wall loss. It is also the measured SOA in this study is of relatively high volatility
in agreement with the 1Hvap of 40 kJ mol−1 applied in the as aforementioned. The differences in the volatility of SOA
CMAQv4.7 model (Carlton et al., 2010). However, they are and the derived 1Hvap between Saha and Grieshop (2016)
lower than those of Saha and Grieshop (2016) and much and this study are consistent with the general phenomenon
lower than those of Epstein et al. (2010). While the 1Hvap that 1Hvap is conversely related with volatility (Epstein et
in Saha and Grieshop. (2016) was derived based on thermod- al., 2010). The 1Hvap in Epstein et al. (2010) was derived
Atmos. Chem. Phys., 21, 5983–6003, 2021 https://doi.org/10.5194/acp-21-5983-2021Y. Deng et al.: Temperature and acidity dependence of SOA formation 5991 Figure 3. Mass yields of SOA for increasing SOA mass loadings. Markers and whiskers are measured data and their uncertainties (Text S4; the uncertainties of the data during the reaction time of 85–90 min are presented); dashed curves are fitting of measured data using a four- product VBS model (Donahue et al., 2006; Lane et al., 2008). Panel (a) presents results under neutral seed conditions, and panel (b) presents results under acidic seed conditions. from published experimental vapor pressure data of organic of 19 %, with a final SOA volume concentration of approxi- compounds. The reason for the difference in 1Hvap between mately 50 µm3 cm−3 . Furthermore, the degree of acidity of this study and Epstein et al. (2010) cannot be currently ex- the seed aerosols could have also influenced the enhance- plained. Notably, sensitivity analyses achieved by fixing the ment (Gao et al., 2004; Czoschke and Jang, 2006). Further stoichiometric yields αi while changing 1Hvap and compar- comprehensive studies are warranted (including the consider- ing the resulting VBS curves with measured data (Fig. S8) ation of the particle viscosity and phase separation) on the in- indicated that the effective 1Hvap could be in the 0 to 70 and fluence of seed aerosol acidity on α-pinene ozonolysis SOA 0 to 80 kJ mol−1 ranges for neutral and acidic seed condi- formation. tions, respectively. Figure S9 presents the comparisons of the SOA yields un- 4.3 Temperature and acidity dependence of SOA der neutral and acidic seed conditions at different tempera- composition tures. This indicates that the SOA yields were enhanced un- der acidic seed conditions when the SOA loadings were low. Among the 362 compounds identified through LC-TOF-MS When the SOA loadings were high, the enhancement disap- analysis in this study (Table S3), 331 compounds were as- peared. This is consistent with the results of Gao et al. (2004), cribed to VBS bin ranges of −8 to 3. The other 31 com- which reported obvious initial α-pinene concentration depen- pounds were ascribed to higher VBS bin ranges of 4–6. Only dence of the enhancement of SOA yields under acidic con- the former 331 compounds are targeted in the following dis- ditions when compared with neutral seed conditions. For the cussions for two reasons. First, less than a half of the com- initial α-pinene concentrations of 12, 25, 48, 52, 96, 120, pounds that belong to VBS bins 4 or greater could exist in and 135 ppbv, the relative enhancements of SOA yields were the particle phase (Donahue et al., 2006), which would intro- 37 %, 34 %, 26 %, 24 %, 15 %, 10 %, and 8 %, respectively duce large uncertainties for the estimation of the mass con- (Gao et al., 2004). This is probably because the SOA com- centrations of the compounds in the gas phase from the par- ponents can be of high viscosity under conditions where RH ticle phase. In addition, LC-TOF-MS analysis of pure com- is smaller than around 50 %, and if high SOA mass load- pounds indicated that fragmentation of high molecular com- ings coated the seed particles, the acid-catalyzed heteroge- pounds during the ionization could occur; e.g., pinic acid neous SOA formation reactions could be impeded (Shiraiwa (C9 H14 O4 ) could be fragmented into C8 H14 O2 , and the latter et al., 2013b; Zhou et al., 2013). In this study, the initial con- was assigned to VBS bin 6 (Fig. S10). Note that due to the centrations of α-pinene were 54–323 ppbv at 298 K, suggest- potentially high viscosity of the newly formed SOA, high- ing that the enhancement could be less than 24 %. When the volatility compounds formed inside the aerosol particle could SOA volume loading was 50 µm3 cm−3 , the fitted SOA yields have been wrapped into the particle phase and detected (Shi- under acidic conditions were enhanced by 11 %, 17 %, and raiwa et al., 2013b). 25 % when compared to the neutral seed conditions under Figure 4 presents the volatility distributions of the identi- 298, 288, and 278 K, respectively. This is consistent with the fied compounds. The measured intensities of particle-phase findings of Gao et al. (2004) and is also comparable to the compounds were normalized by their total intensity for each results of Iinuma et al. (2005). In Iinuma et al. (2005), the experiment and are presented in Fig. 4a. Compounds that experiment with 2-butanol as an OH radical scavenger un- were attributed to VBS bins between 0 and 3 are known der room temperature (294–298 K) reported an enhancement as SVOCs (Li et al., 2016). Those in bins 2 and 3 gener- https://doi.org/10.5194/acp-21-5983-2021 Atmos. Chem. Phys., 21, 5983–6003, 2021
5992                                                     Y. Deng et al.: Temperature and acidity dependence of SOA formation

Table 2. Comparison of 1Hvap in this study with previous studies.

        References                                                   1Hvap (kJ mol−1 )   C ∗ ranges (µg m−3 )   Temp ranges (◦ C)
        This work; ozonolysis                                                  25–44                101 –103               5–25
        Saha and Grieshop (2016); ozonolysis                           80−11 log10 C ∗             10−2 –104             30–120
        Saathoff et al. (2009); ozonolysis                                     24–59          2.1 × 10⁻³ –56             −30–40
        Pathak et al. (2007a); ozonolysis                                      30, 70              10−2 –104               0–49
        Epstein et al. (2010); semiempirical correlation-based fit    129−11 log10 C ∗            10−2 –1010                 27
        Carlton et al. (2010); CMAQv4.7 SOA module                                 40                15, 134                 40

ally presented a decreasing tendency with the increase in                mined by normalizing the stoichiometric SOA yields (Ta-
experimental temperatures, and there was no obvious tem-                 ble 2) based on the total mass fractions of compounds in VBS
perature dependence for those in bins 0 and 1 (Fig. 4a).                 bins 0 to 3 are also presented. The mass fractions determined
The corresponding gas-phase concentrations of each com-                  from the LC-TOF-MS data at VBS bins 1 and 3 and 0 and 2
pound were derived assuming gas–particle partitioning equi-              were smaller and larger, respectively, than those determined
librium (Odum et al., 1996). The 1Hvap values derived in                 from the SOA stoichiometric yields. These differences are
this study (Table 1) were used to calculate the saturation               probably caused by uncertainties in saturation concentration
concentration under 278 and 288 K following Eq. (3). The                 and sensitivity parameterization as well as the existence of
intensities of both the particle and gas phases were then nor-           undetected molecules in the LC-TOF-MS analysis (Sato et
malized by their total amount and are presented in Fig. 4b.              al., 2018).
With the inclusion of the corresponding gaseous phase com-                  To gain more insights into the acidity dependence of the
pounds, the temperature dependence of compounds in VBS                   α-pinene ozonolysis SOA, the relative intensities of the com-
bin 3 changed to positive (i.e., increased with temperature)             pounds identified by LC-TOF-MS under acidic and neutral
whereas the tendency in bin 2 remained negative (Fig. 4b).               seed conditions were compared. For compounds whose in-
As the α-pinene ozonolysis rate constant at the temperature              tensity under acidic seed conditions was more than 1.1 times
range of 278–298 K does not vary considerably (within 15 %;              that of neutral seed conditions, monomers with a chem-
IUPAC Task Group on Atmospheric Chemical Kinetic Data                    ical formula of C10 H9−18 O4−14 accounted for 32 %, and
Evaluation, http://iupac.pole-ether.fr, last access: 1 February          oligomers with a chemical formula of C11−22 H7−35 O2−12
2021), α-pinene was completely consumed at the reaction                  accounted for 68 % of the total intensity. Conversely, for
time of 90 min, and the temperature dependence of gas-phase              compounds whose intensity under acidic conditions was less
wall loss was considered insignificant (Text S5), the total              than 0.9 times that of neutral seed conditions, monomers
amounts of SVOCs formed should be similar at the three                   with a chemical formula of C6−10 H7−15 O4−6 accounted
temperatures. Hence, the total amounts of gas- and particle-             for 87 %, and oligomers with a chemical formula of
phase compounds in each VBS bin should be independent of                 C11−21 H9−27 O5−10 accounted for 13 % of the total intensity.
experimental temperatures. If a larger 1Hvap were applied                   Figure 5 presents the particle-phase mass distributions of
for the derivation of the intensity of gas-phase compounds               compounds whose mass fractions under acidic seed condi-
(e.g., the semiempirical equation in Epstein et al., 2010), the          tions were more than 1.1 (or less than 0.9) times those of neu-
total amount in VBS bin 3 at 298 K would be much higher                  tral seed conditions. The molecular mass of those compounds
than at other temperatures, which is unreasonable. This sug-             with greater mass fractions under acidic seed conditions was
gested the appropriateness of the 1Hvap values derived from              generally distributed in the higher mass end compared with
the four-product VBS fitting of the SOA yields in Sect. 4.1.             those with greater mass fractions under neutral seed con-
In addition, we note that the volatility distribution pattern de-        ditions. The mass-fraction-weighted mean molecular mass
rived in this study is similar to that of the experimental runs 1        of those compounds presenting greater intensities under
and 6 (derived using the same method) of Sato et al. (2018),             acidic seed conditions was 284 ± 14 (mean ± standard devi-
although positive electrospray ionization analysis was used              ation) g mol−1 , whereas that of those presenting greater in-
and the α-pinene ozonolysis experiments were carried out                 tensities under neutral seed conditions was 204 ± 4 g mol−1 .
under dry conditions in the latter. According to Morino et                  Figure 6 presents the identified compounds whose inten-
al. (2020), both the root-mean-square errors between the ob-             sity under acidic seed conditions was more than 1.1 (or less
served and simulated SOA concentrations for the formation                than 0.9) times that of neutral seed conditions in the atomic
experiments and between the observed and simulated volume                H-to-C ratio (H : C) versus O-to-C ratio (O : C) space. The
fraction remaining for the heating experiments were mini-                color scale indicates the mean mass fraction of identified
mized in the case of the C ∗ distribution reported by Sato               compounds across all six experiments. It is suggested that
et al. (2018). In Fig. 4b, the volatility distributions deter-           compounds with a lower intensity under acidic seed condi-

Atmos. Chem. Phys., 21, 5983–6003, 2021                                                   https://doi.org/10.5194/acp-21-5983-2021
Y. Deng et al.: Temperature and acidity dependence of SOA formation 5993
Figure 5. Mean particle-phase mass fraction distributions of com-
pounds whose particle-phase mass fractions under acidic seed con-
ditions were more than 1.1 (red symbols) or less than 0.9 (black
symbols) times those of neutral seed conditions. Whiskers repre-
sent the standard deviations of the three experiments at different
temperatures.
Figure 4. Volatility distributions of chemical components in
(a) particle-only phase and (b) particle + gas phases. In panel (a),
data were normalized by the total signal intensity of the particle
phase of each experiment; in panel (b), data were normalized by
the total intensity of the particle phase and its equilibrium gas phase
in each experiment. Curves and markers imposed in panel (b) are
the volatility distributions under neutral (black) and acidic (grey)
seed conditions determined by normalizing the stoichiometric SOA
yields αi by the total mass fraction of compounds in VBS bins 0 to
3 (Sato et al., 2018).
Figure 6. Atomic H-to-C ratio (H : C) versus O-to-C ratio (O : C).
Stars and circles respectively indicate compounds whose particle-
phase mass fractions under acidic seed conditions were more than
tions were concentrated in the O : C ratio range of 0.4–0.75
1.1 and less than 0.9 times those of neutral seed conditions. The
and H : C ratio range of 1.1–1.7, whereas those with higher color scale indicates the mean mass fraction of identified com-
intensity under acidic seed conditions were more broadly dis- pounds across all six experiments. Notably, organosulfates were not
tributed in the H : C versus O : C space. Compounds with presented.
O : C ratios less than 0.4 were oligomers with a chemical
formula of C11−22 H19−35 O2−7 and were distributed in the
VBS bins of −3 to 3. Compounds with O : C ratios greater
Figure 7 presents the compounds whose normalized inten-
than 0.75 were likely to be highly oxidized molecules with a
sity under acidic seed conditions was less than 0.9 (panel a)
chemical formula of C10−14 H9−21 O9−14 and were attributed
or more than 1.1 (panel b) times that of neutral seed condi-
to VBS bins −8 to −2. Furthermore, oligomers with O : C
tions in the VBS space. The acidity dependence of the ma-
ratios of less than 0.4 accounted for 61 % of those oligomers
jor compounds in VBS bins was tentatively explained from
with high relative intensity under acidic conditions, whereas
the viewpoints of acid-catalyzed decomposition reactions or
those with O : C ratios of greater than 0.75 accounted for
acid-catalyzed heterogenous reactions. Compounds that pre-
only 1 %. This, together with the aforementioned chemical
sented lower intensities under acidic than neutral seed condi-
formula and molecular mass distributions, indicated that the
tions were mainly distributed in VBS bins 3, 2, −1, −4, and
formation of many oligomers, especially with small O : C ra-
−6 (Fig. 7a). The respective compounds that presented the
tios, was enhanced under acidic seed conditions.
highest intensity in VBS bins 3, 2, −1, −4, and −6 were
m/z 215.091 (C10 H15 O5 ), 171.065 (C8 H11 O4 ), 185.081
https://doi.org/10.5194/acp-21-5983-2021 Atmos. Chem. Phys., 21, 5983–6003, 2021You can also read