Financial Framework for Sustainable & Scalable Growth - Hilary Maxson - Schneider Electric
←
→
Page content transcription
If your browser does not render page correctly, please read the page content below

Capital Markets Day 2021

                Financial
                Framework
                for Sustainable & Scalable Growth
                Hilary Maxson
                Chief Financial Officer

©2021 Schneider Electric. All Rights Reserved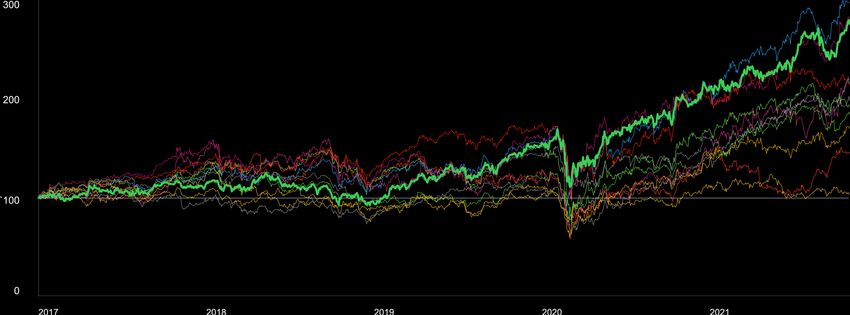
We have outperformed the market in recent years through our complete
     portfolio and execution on our strategic priorities

                                                                                                     Strategic priorities:
                                                                                                                             Organic growth CAGR
                                                                                                                              2017-2021: c.+4%
                                                                                                     MORE PRODUCTS           Market growth2: c.+2%
                                         Organic growth CAGR
                                           2012-2016: ~flat
                                                                                                     MORE SOFTWARE
                                              Market growth2:                                        & SERVICES
                                                 c.+2.5%

                                                                                                     BETTER SYSTEMS

                                                  2012-16                                                                            2017-21 1

                                              “Integrate”                                                                           “Scale”

1)     FY21 organic growth at midpoint of +11% to +13% target range
2)     Market growth (volume) CAGR based on Industrial Production (IP) as sourced from Oxford Economics

     ©2021 Schneider Electric. All Rights Reserved Ɩ Page 2
We are now at an inflection point for sustainable growth
Organic revenue growth of between
+5% to +8%
on average, 2022-2024
Market growth2: c.+4%
Organic growth CAGR
2017-2021: c.+4%
8%
Market growth2: c.+2% Driven by:
• Accelerating Markets 5%
• Incremental Growth Drivers:
Services, Software & Sustainability
• Unique Operating Model
2017-211 2022-24
“Scale” “Sustainable Growth”
MORE
MORE MORE
Strategic priorities: PRODUCTS
SOFTWARE &
SUSTAINABILITY
SERVICES
1) FY21 organic growth at midpoint of +11% to +13% target range
2) Market growth (volume) CAGR based on Industrial Production (IP) as sourced from Oxford Economics
©2021 Schneider Electric. All Rights Reserved Ɩ Page 3Upgrading our across-cycle sustainable growth ambition
Organic revenue growth of
5%+
on average across the cycle¹
¹ Across the economic cycle, incorporating Sustainable Growth targets for 2022-2024
©2021 Schneider Electric. All Rights Reserved Ɩ Page 4Innovation to fuel Sustainable Growth ambition –
Strategic R&D investment to increase over time
R&D Evolution (% of Group revenues)
1.6
5.1%
Step up in R&D
Average R&D cash spend (€bn)
4.8%
1.2
in coming years, from existing ~5% of revenue
0.8
0.4
Focus areas
• Innovation at every level of digital flywheel
0
2012-2016 2017-20211 2022- • Sustainability
• Cybersecurity
€6bn+
• Electronics and AI
in absolute amount of R&D investment since start of 2017 → Strong focus on ensuring return on investment
¹ FY21 shown on basis of pro-rated H1’21 figures for illustrative purposes only
©2021 Schneider Electric. All Rights Reserved Ɩ Page 5On track to achieve our margin ambition 1 year ahead of plan
Our existing margin ambition
13% - 17%
across the cycle (set in 2012)
c.17%
Adj. EBITA margin
c. +365 bps organic1
c.17%
On track to be achieved
15.6% 15.6% 1 year ahead of plan1
15.1%
14.7% 14.8%
14.5%
13.9% 14.1%
13.7%
2012 2013 2014 2015 2016 2017 2018 2019 2020 2021
¹ Based on midpoint of FY21 adj. EBITA margin guidance of +120bps to +150bps organic expansion
©2021 Schneider Electric. All Rights Reserved Ɩ Page 6Leveraging several elements to drive margin improvement
Organic improvement in Gross Margin
Key drivers:
c. +150 bps organic
improvement
Consistent delivery on Industrial Productivity
40.4%
39.5%
39.0%
Track record of RMI recovery over the cycle
38.4%
38.0%
Mix improvement: Including better Systems margin
2016 2017 2018 2019 2020 and higher weight of Software revenues
Organic improvement in SFC / Sales ratio
c. +70 bps organic improvement Disciplined approach to SFC spend
+50 bps
+40 bps
+20 bps Delivery on structural savings plans
-40 bps
2020 impacted by COVID-19, though partly
mitigated by tactical savings
2017 2018 2019 2020
©2021 Schneider Electric. All Rights Reserved Ɩ Page 7And setting the path for further expansion of margin in the
coming years…
3-year target Beyond 2024
2022-2024
Opportunity to further expand
Adj. EBITA margin beyond 2024
A yearly organic improvement of
+30 bps to +70 bps Operational leverage and
in Adj. EBITA margin continued evolution of business
mix to positively impact margins
Implying Adj. EBITA margin in the range c.18% to c.19% by 2024 at
constant scope and FX
©2021 Schneider Electric. All Rights Reserved Ɩ Page 8A proven engine of Industrial Productivity
A strong track record Existing commitment on track
Average annual Industrial Productivity saving
~€1bn target
over 3 years ~€1bn
Productivity target
#1 Supply Chain Europe Top 15 2020-2022²
on track
€348m €334m
2012-16 2017-2020 2020-22¹ We expect a good level of Industrial
Industrial Productivity Productivity to continue beyond 2022
Delivering €3bn+ contribution from
productivity since start of 2012
¹ Targeted
² Excluding impact from additional costs of freight, electronic components and COVID-19 related costs
©2021 Schneider Electric. All Rights Reserved Ɩ Page 9Focused on continued pricing power through our differentiated
value proposition
Proven track-record on net price Delivering over
Net price1 evolution over last 5 years
H2’16 – H1’21
€1bn+
contribution from net price since start of 2012
c. €900m
c. €500m
• Ambition to be flat to positive net pricing
Gross Price
across the cycle
RMI
Net Price
• Factoring the need to compensate additional
costs (freight, electronic components, plastics
c. -€400m and COVID-19 related costs)
¹ Price on products and raw material impact
©2021 Schneider Electric. All Rights Reserved Ɩ Page 10Our business transformation and resultant mix impact is
contributing to our margin evolution
Improving mix over time Drivers of mix evolution
• Simple strategic priorities:
2012-2016 2017-2020 2021 and beyond
MORE PRODUCTS MORE SOFTWARE
MORE SERVICES MORE SUSTAINABILITY
-0.7pts
• Evolution of our revenues (more digital, more ARR)
• Careful management of Systems business to drive
-4.1pts profitable growth
• Impact of Geographical mix
Cumulative mix impact on Gross Margin bridge in period indicated
©2021 Schneider Electric. All Rights Reserved Ɩ Page 11Evolving the nature of revenues to be more digital and
more resilient
Software Ambition for Software, Sustainability and
+ Services revenues (currently c.18% of
Digital Group revenues) to increase by +5pts by
services
20251
Moving towards
60%
Group
Increased
across Edge
Control
c. 50% revenue
leveraging Field
Services
c.
domains
of Group revenues by 2025¹
Leveraging installed base,
servicing of
Assets under Management
Connectable Recurring revenue weightage in Software & Services
products (currently c.30%) to increase to c.45% by 2025
Growing proportion of natively
connected products through
R&D, replacing non-digital offers ARR metrics to be reported from FY 2022 results
¹ As a function of expected organic revenue growth and impact of previously announced disposal program
©2021 Schneider Electric. All Rights Reserved Ɩ Page 12Focused on delivering structural savings from our operational
effectiveness plan
Strong progress being made Existing commitment on track
~€1bn Efficiency target 2020-2022
€1.0bn
~€1bn
Structural savings
c. €440m target 2020-2022
on track
€0.5bn
c. €560m c. €560m
We expect SFC / Sales ratio1 to
continue to reduce over time
€0.0bn
Jan 2020 – Jun 2021 Jan 2020 – Dec 2022
beyond 2022
Cumulative savings through H1’21 Cumulative savings to be realized
¹ SFC / Sales ratio was 24.8% in FY20
©2021 Schneider Electric. All Rights Reserved Ɩ Page 13We expect a decrease in restructuring to normative levels in the
coming years
450 Average Annual Restructuring cost¹ (€m)
300
Restructuring costs to be
around
150
€100 million
per year, from 2023
0
2012-16 2017-20 2020-22 2023 2024
2020-2022 restructuring program of between
€1.15bn to €1.25bn to fund operational efficiency plans
¹ Average per year within respective period of time
©2021 Schneider Electric. All Rights Reserved Ɩ Page 14Revenues, Profits and Cash moving upward in lockstep
Free cash flow evolution (€bn) Towards a
~€4.0bn
c.€4bn FCF
~€3.0bn
company by 2024…
~€2.0bn
Cash conversion expected to continue at
around 100% across the cycle
(Free cash flow as a proportion of Net Income – Group share)
2012-2016 2017-2021¹ By 2024 Tangible capex expected to remain at
“Integrate” “Scale” “Sustainable c. 2% of revenues across the cycle
Growth”
1 Based on company compiled consensus of €3.2bn Free cash flow in FY21
©2021 Schneider Electric. All Rights Reserved Ɩ Page 15A cohesive framework to maximize resource efficiency
15% ROCE¹
14%
13%
12%
11%
10%
2016 2017 2018 2019 2020
Driving ROCE towards 15%
¹ ROCE, excluding impacts from significant M&A in the first year post-acquisition
©2021 Schneider Electric. All Rights Reserved Ɩ Page 16Disciplined capital allocation: priorities unchanged
1 2
Strong Investment
Continued focus on Dividends
Grade Credit Ratings
3 4
Portfolio optimization Share buyback
©2021 Schneider Electric. All Rights Reserved Ɩ Page 17Committed to strong investment grade credit ratings
Our strong investment grade rating means:
A-
Since 2009
• Reliable access to credit markets in
periods of Global economic uncertainty
• Favorable credit terms in comparison to
BBB rated companies
A3
Since 2019¹
Combined with interest rate reductions, the
Group’s cost of debt has reduced over time
The Group remains committed to retaining a
strong investment grade credit rating
¹ A3 rating from 2009 – August 2017, Baa1 rating August 2017 – November 2019, A3 rating from November 2019
©2021 Schneider Electric. All Rights Reserved Ɩ Page 18Our commitment to a progressive dividend
Progressive Dividend for 11 years
©2021 Schneider Electric. All Rights Reserved Ɩ Page 19Portfolio optimization: a disciplined approach to value creation
Acquisitions Disposals
Unified Asset
€0.8 billion
of revenues disposed or deconsolidated
Lifecycle
Management against program of €1.5 - €2.0 billion by
end of 2022
• Opportunistic approach to value accretive
• We remain committed to the completion of
bolt-ons in the core, oriented toward
the program
building a hybrid digital company
• We will continue to review the portfolio for
• Focus on smaller and earlier stage
strategic fit on an ongoing basis
acquisitions linked to future-looking
incremental growth drivers
©2021 Schneider Electric. All Rights Reserved Ɩ Page 20Share Buyback: Raising threshold on maximum purchase price
Recent Share Buyback Programs (€bn)
2.0 2.0 300
We propose¹ to raise the
c.1.5
cap on purchase price to
€250
1.5 1.5
Share buyback value (€bn)
Cap on purchase price (€)
200
c.1.0
1.0
100
0.5
Over
0.6
0
2015-2016 2017-2018 2019-2022
0 €260 million
buyback against 2019-2022 program
Cap on purchase Remaining to Already since reinstatement in July 2021
price (RHS) buy back (LHS) realized (LHS)
¹ Subject to approval at the Annual Shareholders’ meeting on May 5, 2022
©2021 Schneider Electric. All Rights Reserved Ɩ Page 21We continue to focus on generating shareholder value over the cycle
Total Shareholder Return2
Schneider Electric
c.+180%
3-YEAR TSR¹ 5-YEAR TSR2
c. +200% c. +180%
1 SE performance among 11 peers as considered for long-term incentive plan (base 100: Jan 1st, 2019 to November 23, 2021)
2 SE performance among 11 peers as considered for long-term incentive plan (base 100: Jan 1st, 2017 to November 23, 2021)
©2021 Schneider Electric. All Rights Reserved Ɩ Page 22Our ambition for the future…
Accelerating Accelerating Incremental Unique
Markets Growth Drivers Operating Model
Sustainable Revenue Adj. EBITA
Growth Margin Expansion Free Cash Flow
Between +5% to Between +30 bps to
2022-2024 c. €4bn by 2024
Financial +8% organic, on average +70 bps organic, per year
Targets Longer Term 5%+ organic,
on average across the cycle1 Opportunity to further expand with business mix and operational leverage
Ambitions
Aspiration To consistently be a Company of 25*
1 across the economic cycle, incorporating Sustainable Growth targets for 2022-2024 *sum of organic revenue growth % and adj. EBITA margin %
©2021 Schneider Electric. All Rights Reserved Ɩ Page 23You can also read