Financial Integration and Structure in the Euro Area - April 2022
←
→
Page content transcription
If your browser does not render page correctly, please read the page content below

Financial Integration and
                                         Structure in the Euro Area
ECB Committee on Financial Integration

                                          April 2022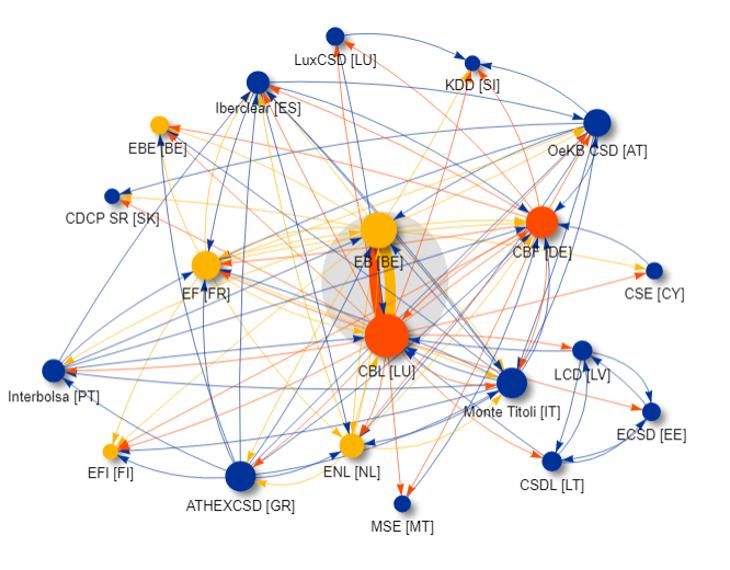
Contents
Preface                                                                           2

Key messages                                                                      3

        1       Overall assessment of financial structure and integration         3

        2       Selected policy issues for financial structure and integration    9

Structure and integration developments in the euro area financial
      system                                                                     15

        1       Financial market structure                                       15

        Box 1 Making euro area equity markets fit for green and digital
             innovation                                                          19

        2       Financial intermediary structure                                 25

        Box 2 Measuring market-based and non-bank financing of non-
             financial corporations in the euro area                             28

        3       Financial integration                                            37

        Box 3 Frictions in debt issuance procedures and home bias in the
             euro area                                                           45

        Box 4 Home bias in green bond markets                                    49

        4       Financial resilience                                             55

        5       Trends in risk sharing in recent years                           58

        Box 5 A deep dive into risk sharing through the capital channel in the
             euro area – inter- versus intra-regional risk sharing               63

Financial Integration and Structure in the Euro Area, April 2022 – Contents       1
Preface
This is the second edition of the European Central Bank’s biennial report on financial
integration and structure in the euro area. As explained in greater detail in the
preface to the first edition in March 2020,1 it is designed to focus on structural
developments in the financial system of the euro area, and in some cases also of the
European Union (EU), and related policy issues. In so doing, it covers developments
in financial integration across member countries, changes in financial structure (the
mixture of financial markets and intermediaries) and financial development or
modernisation (for example through innovations in the financial system). Definitions
of these three concepts and how they link to Eurosystem tasks and functions were
provided in more detail in the 2020 preface.
The findings of this report may touch upon issues relevant for the policy discussion
related to the European banking union (BU), the European capital markets union
(CMU) and thereby on the financial aspects of deepening Economic and Monetary
Union (EMU).
The report has been streamlined in two ways compared with the previous issue: by
focusing on the main trends in financial integration, structure and development, and
by replacing special feature articles with more concise boxes. The topics covered by
the five boxes are the following:
• Making euro area equity markets fit for green and digital innovation;
• Measuring market-based and non-bank financing of non-financial corporations
in the euro area;
• Frictions in debt issuance procedures and home bias in the euro area;
• Home bias in green bond markets;
• A deep dive into capital risk sharing in the euro area – inter- versus intra-
regional risk sharing.
The standard set of indicators of financial integration and structure and their
descriptions are included in an online Statistical Annex.
The report does not cover the implications of Russia’s military attack on Ukraine for
the euro area or the EU financial system, as the data cut-off date was 11 February
2022.
1 European Central Bank (2020), Financial integration and structure in the euro area, Frankfurt, March.
Financial Integration and Structure in the Euro Area, April 2022 – Preface 2Key messages
1 Overall assessment of financial structure and integration
The surveillance parts of this report cover developments in euro area financial
structure, in terms of both financing instruments and financial intermediaries,
as well as in euro area financial integration during the COVID pandemic period.
The economic and financial implications of the COVID-19 pandemic as well as the
sizeable policy responses dominated most of the two-year reporting period of this
report. There were, however, also a number of previous features and trends in
financial structure and integration that continued or evolved differently during the last
two years. The surveillance parts of the report – summarised in this section –
describe the most important patterns in both regards. They consider aggregate and
sectoral developments for different financing instruments (liability perspective) and
for different financial intermediaries (notably from an asset perspective). They also
review the integration of financial markets across member states and its resilience as
well as assess risk sharing across member states.
Thanks to a decisive set of policy responses the financing of euro area firms
and households held up during the pandemic crisis, although this required a
significant increase in public debt. As seen in Chart 1.1, aggregate external
financing of both non-financial corporations (NFCs, left panel) and households
(middle panel) broadly held up in the euro area during the pandemic (blue lines in
2020 and 2021 compared to the years before). But this was only possible thanks to
the fast and formidable policy support and actions that fiscal authorities, the
Eurosystem and prudential authorities and bodies undertook in response to the
pandemic. For example, the right panel of Chart 1.1 visualises this in terms of the
multiplication of public debt issuance necessary to finance measures supporting
firms and households. The speed and decisiveness of the action clearly benefited
from the experiences with the financial crisis and the sovereign debt crisis a decade
earlier and subsequent reforms.
Financial Integration and Structure in the Euro Area, April 2022 – Key messages 3Chart 1.1
External financing of euro area NFCs, households, and general governments by
instrument
(flows; four-quarter sums; EUR billions, Q4 for 2017 -2020; Q3 for 2021)
Total external financing Loans from rest of the world
Loans from MFIs Unlisted shares and other equity
Debt securities Trade credit
Listed shares Other
Loans from non-MFIs
a) NFC sector b) Household sector c) General government
sector
1,200 350 1,400
Thousands
Thousands
Thousands
1,000 300 1,200
-
800 250 1,000
600 200 - - 800
- -
400 150 600
200 100 400
0 50 200
-200 0 0
-400 -50 -200
2017 2018 2019 2020 2021 2017 2018 2019 2020 2021 2017 2018 2019 2020 2021
Q4 Q4 Q4 Q4 Q3 Q4 Q4 Q4 Q4 Q3 Q4 Q4 Q4 Q4 Q3
Sources: ECB (euro area accounts) and ECB calculations.
Notes: MFI stands for Monetary and Financial Institutions. Non-MFIs include other financial institutions (OFIs) as well as insurance
corporations and pension funds (ICPFs). "Other" is the difference between the total and the instruments included in the figure and
includes inter-company loans and the rebalancing between non-financial and financial accounts data. Figures shown represent the
sum of flows over the last four quarters at the end of Q4 for 2017 to 2020 and of Q3 for 2021.
In addition to fiscal support and guarantees, another factor helping non-
financial corporations to stabilise was a fast change in their financing mix
towards bank credit lines and corporate debt issuance, as also facilitated by
various monetary policy measures. While total NFC financing held up overall, the
pandemic triggered large swings in its composition. Notably, in 2020 trade credit and
public equity issuance dried up (grey and green blocks in Chart 1.1), because of the
great uncertainty about the viability of firms during lockdowns early in the crisis and a
rush towards liquidity (“dash for cash”). At the same time, NFCs resorted more to
debt financing, both through bank loans and through corporate debt securities
(yellow and red blocks). Robustified by regulatory reforms decided after the Great
Financial Crisis and supported by special ECB liquidity operations, banks were able
to let firms draw elastically on their credit lines. In addition, much enhanced
corporate bond purchases by the ECB through its Pandemic Emergency Purchase
Programme (PEPP) made corporate issuance attractive.
Multiple support to companies was all the more important as the corporate
sector could be regarded as the economic epicentre of the COVID crisis. The
initially necessary social distancing and lockdowns very much limited the operations
of firms in important sectors, constraining the employment of people earning wages,
investment and the production, distribution and sale of goods and services.
Therefore, the risks spread within the corporate sector and from there to supporting
governments, financial intermediaries and consumers. One challenge for the future
will be how the pandemic legacy of corporate debt will be resolved, including through
the functioning of insolvency frameworks.
Financial Integration and Structure in the Euro Area, April 2022 – Key messages 4The trend towards non-bank financial intermediation continued, with an
especially strong growth of investments funds, in particular for equity funds,
despite some initial stresses in some segments of the fund sector. Turning from
the perspective of financing instruments to the one of financial intermediaries, a
trend that existed at least since the Great Financial Crisis is the growth of non-bank
financial intermediaries in the euro area. For example, the share of non-banks in the
provision of credit to NFCs grew from around 15 per cent at the time of the Great
Financial Crisis to almost 30 per cent in 2021 (see panel b of Chart A in Box 2 of this
report). A particularly strongly growing type of non-bank intermediary during the last
two years were investment funds (green line in panel a of Chart 1.2), notably driven
by equity funds (blue line). This reflected not only valuation effects on the back of
strong fiscal support and monetary policy measures but also high inflows over a
number of quarters. Apart from the low interest rate environment, the enhanced
interest in portfolio equity investment may have been driven by the strong
performance of stock markets until the cut-off date of this report. Finally, as of late
also insurance corporations and pension funds increased their equity holdings, partly
through the purchase of investment funds (Chart 9 in the main chapter of the report).
Chart 1.2
Developments in euro area investment funds
a) Total assets and relative shares of equity, b) Equity funds’ investment flows by
bond, and mixed funds geographic area of investment
(percentages (left-hand scale); EUR trillions (right-hand scale), (EUR billion, quarterly data, Q1 2019 – Q4 2021)
monthly data, Dec 2008 – Dec 2021 (left-hand scale); quarterly
data, Q1 2011 – Q4 2021 (right-hand scale))
Equity funds EA
Bond funds US
Mixed funds Other
Total assets (right-hand scale)
37% 20 200
Thousands
35% 18
150
16
33%
14 100
31%
12
29% 50
10
27%
8 0
25%
6
-50
23% 4
21% 2 -100
03/19
12/19
06/19
09/19
03/20
06/20
09/20
12/20
03/21
06/21
09/21
12/21
2008 2010 2012 2014 2016 2018 2020
Sources: ECB (investment fund balance sheet statistics).
Notes: Panel b: "Other" refers to all equity transactions of euro area equity funds with counterpart area other than EA and US.
Contrary to previous major crises, a material decrease in euro area financial
integration induced by the beginning of the pandemic – and more pronounced
in prices than in quantities – stopped and reversed relatively quickly. Turning to
euro area financial integration, Chart 1.3 shows the ECB’s two composite indicators
that provide an aggregate picture of integration across the main market segments
(money, bond, equity and banking markets) in terms of prices (blue line) and
quantities (yellow line) since the start of the euro. The price-based indicator suggests
that the moderated and volatile recovery of integration after the Great Financial
Financial Integration and Structure in the Euro Area, April 2022 – Key messages 5Crisis and the European Sovereign Debt Crisis reported in the 2020 report was still
intact until the cut-off date. Quantity-based integration (capturing cross-border bond
holdings, equity holdings and interbank lending), however, moved broadly sideways
for a number of years and only recovered somewhat more recently. The levels of
integration measured with the latest data now compare to those of the mid-2000s,
i.e. a few years before the financial crisis. Most importantly, the adverse effects of
the COVID crisis on financial integration, while material in particular in terms of
cross-border price divergences, seem to have been relatively short-lived both in
prices and in quantities.
Chart 1.3
Price-based and quantity-based financial integration composite indicators
(quarterly data; price-based indicator: Q1 1995 – Q4 2021; quantity-based indicator: Q1 1999 – Q4 2021)
Price-based Indicator OMT and Begin
Lehman
Quantity-based indicator banking union COVID-19
Brothers
default announcement Pandemic
1.00
Euro Subprime Sovereign Announcement
introduction crisis crisis capital markets
union action
plan
0.75
0.50
0.25
0.00
1995 1997 1999 2001 2003 2005 2007 2009 2011 2013 2015 2017 2019 2021
Source: ECB and ECB calculations.
Notes: The price-based composite indicator aggregates ten indicators for money, bond, equity and retail banking markets, the quantity-
based composite indicator aggregates five indicators for the same market segments except retail banking. The indicators are bounded
between zero (full fragmentation) and one (full integration). Increases in the indicators signal greater financial integration. From
January 2018 onwards the behaviour of the price-based indicator may have changed due to the transition from EONIA to €STR
interest rates in the money market component. OMT stands for Outright Monetary Transactions. For a detailed description of the
indicators and their input data, see the Statistical Web Annex to this report and Hoffmann, P., Kremer, M. and Zaharia, S. (2019),
Financial integration in Europe through the lens of composite indicators, Working Paper Series, No 2319, ECB, September.
The most influential policy measures that first contained re-fragmentation in
the euro area and then brought it back to pre-pandemic levels were first a
prompt series of ECB monetary policy measures and then, decisively, the EU
agreement about a very sizeable COVID recovery fund. To analyse in greater
depth what happened with integration during the pandemic crisis, Chart 1.4 zooms
in on the period February 2020 to February 2022. This is only possible with a high-
frequency version of the price-based composite indicator (blue line), which is
complemented with information about the severity of the crisis (various dashed
lines), economic activity (red dots) and important events and policy actions
(numbered and colour coded vertical lines). The chart first confirms the sharp re-
fragmentation (and economic contraction) triggered by the first COVID wave and
severe lockdown measures. Initial policy measures – including notably the ECB’s
PEPP (e.g. events 7, 9 and 16) – were able to contain this development but not
sustainably reverse it yet. Only when the two key proposals for a sizeable European
recovery fund (events 24 and 25) combined with a number of other measures and
developments a sustainable re-integration was set in motion. These other
Financial Integration and Structure in the Euro Area, April 2022 – Key messages 6developments included particularly the previous adoption of three European safety
nets for businesses, jobs and workers (event 17), the easing of the first virus wave
(dashed orange and violet lines) and a sharp economic recovery. Thereafter,
following also an expansion of the PEPP (event 26) and the European Council’s
agreement on the NextGenerationEU recovery fund financed through the joint
issuance of debt (events 28 and 29), the price-based composite ultimately reached
pre-pandemic levels.
Chart 1.4
Euro area price-based financial integration, COVID-19 pandemic developments and
events
(daily data, 3 February 2020 – 23 February 2022)
Price-based composite indicator Fully vaccinated people (percent of population)
Industrial production growth (%) COVID-19 hospitalizations (23 Nov 2020=100)
COVID-19 new cases (27 Jan 2022=100) Lockdown stringency
COVID-19 deaths (per hundred thousand inhabitants)
0.70 100
1 7 9 12 16 26 28 29 31 33 35 38 39 40 41 424344 45 46 47 48 49
10 17 25 26 32 34 36 50 90
24
14.06
0.65 80
9.86
70
0.60 60
3.53 3.77 2.47
2.34 2.33 0.29 1.25
0.48 0.58 -0.68 0 50
-0.19 0.51 0.39
1.14 -1.34 -1.42 -1.27
0.55 -1.14 -1.53 40
30
0.50 -10.89 20
10
-19.24
0.45 0
02/20 04/20 06/20 08/20 10/20 12/20 02/21 04/21 06/21 08/21 10/21 12/21 02/22
Sources: Price-based composite indicator and industrial production: ECB and ECB calculations; COVID-19 deaths, fully vaccinated
people, and lockdown stringency index: Our World in Data.
Notes: The price-based composite indicator of financial integration is a high-frequency version (daily readings) of the one by Hoffmann
et al. (2019), described in Borgioli et al. (2020). The indicator is calibrated to vary between 0 and 1. The COVID-19 deaths data series
are measured as seven day moving averages. Fully vaccinated is the share relative total population. Industrial production growth
(excluding construction) is measured as growth rate to the previous month. Lockdown stringency varies between 0 and 100 (100 =
strictest) and is computed as an average of the COVID-19 stringency indexes of all euro area countries, weighted by their 2019 real
GDP. It is based on nine response indicators including school closures, workplace closures, and travel bans. PEPP stands for
Pandemic Emergency Purchase Programme and SURE for Support to mitigate Unemployment Risks in an Emergency. The chart
distinguishes between four phases of the crisis, indicated by the grey and light blue shaded areas. The first captures the first infection
wave, with drastic lockdowns and a severe economic downturn (mid-February to early May 2020). The second phase covers the stark
economic rebound when infections had returned to low levels and member countries partly opened up again (early May to mid/late-
August 2020). The third phase spans the severe return of infections in three more waves with, however, more targeted lockdowns and
a more resilient economy than during the first phase (mid/late-August 2020 to end May 2021). The fourth phase is characterized by a
combination of the rise in the number of COVID-19 new cases (including Delta and Omicron variants) together with the low number of
deaths, high vaccination rates, and more resilience of financial integration (since June 2021 until February 2022).
Vertical lines and their numbers mark selected significant events (colours refer to country events – Italy red, Spain dark blue, Germany
light blue – or events with euro area wide relevance – fiscal light brown, monetary policy and other black):
1. Closure of Italian schools and universities (4 March 2020), 7. ECB PEPP announcement (18 March), 9. PEPP legal documentation
published (25 March 2020), 10. Third European Council with divergent views on coronabonds (26 March 2020), 12. Eurogroup
agreement on comprehensive policy response (9 April 2020), 16. ECB collateral rating freeze (22 April), 17. Fourth European Council
with endorsement of Eurogroup’s comprehensive policy response and plans for recovery fund (23 April), 24. Franco-German EUR 500
bn. European recovery fund proposal (18 May 2020), 25. European Commission EUR 750 bn. “NextGenerationEU” recovery
instrument proposal (27 May 2020), 26./26. ECB PEPP expansion and Germany announces major fiscal stimulus package (4 June
2020), 28. Start of special European Council on recovery fund (17 July 2020), 29. End of special European Council on recovery fund
with final agreement on size and structure (21 July 2020), 31. First issuance of EU Commission SURE bonds (21 October), 32. S&P
upgraded the outlook on the Italian sovereign bond rating from negative to stable (23 October 2020), 33. Germany adopts toughest
health restrictions since first lockdown (28 October 2020), 34. ECB hints at December monetary policy stimulus (29 October 2020), 35.
BioNTech/Pfizer vaccine announcement (9 November 2020), 36.Second issuance of EU Commission SURE bonds (10 November
2020), 38. ECB expands PEPP envelope and announces to “preserve favourable financing conditions” (10 December 2020), 39.
Announcement of US economic relief package (15 January 2021), 40. ECB temporarily increases PEPP purchases (11 March 2021),
41. Commission successfully placed 800 billion euros of bonds, "NextGenerationEU" (8 June 2021), 42. European Union countries
agreed on an easing of travel restrictions over summer (11 June 2021), 43. EU hands out first payments from COVID-19 recovery
fund, "NextGenerationEU" (28 June 2021), 44. ECB reformulates inflation goal to 2%, allows overshoot (8 July 2021), 45. ECB
extends forward guidance on rates (22 July 2021), 46. ECB Governing Council (28 October 2021). 47. Inflation in the euro area is
estimated at 4.1% in October (29 October 2021), 48. Governing Council meeting (16 December 2021), 49. Euro area GDP rose by
0.3% on quarter in the last three months of 2021, slightly less than predicted, after a sharp contraction in Germany's output (31
January 2022), 50. Governing Council follow up from December meeting announcing a gradual reduction of asset purchases and
termination of PEPP net asset purchases (3 February 2022). Omitted numbers are relevant events suppressed for readability.
Financial Integration and Structure in the Euro Area, April 2022 – Key messages 7Once pre-pandemic levels were reached again, measured financial integration gradually further increased and remained resilient to further COVID waves. Following the establishment of the comprehensive set of national and European fiscal, monetary and prudential policy instruments, Chart 1.4 clearly shows how euro area financial integration remained resilient to the later waves of the coronavirus and its variants, as also national lockdown measures become less severe and eventually vaccinations picked up (dashed green line). If anything, integration further increased in the following quarters. The experience overall illustrates, among other things, how powerful aligned monetary and fiscal policies can be in stabilising financial markets specifically and the euro area more generally during a crisis. As flagged in the 2020 report, however, the resilience of integration to large shocks needs to be continuously monitored. For example, while the ratio of intra- euro area foreign equity investments relative to foreign debt investments has somewhat recovered during the pandemic (Chart 18 in the main chapter of the report), the ratio of intra-euro area foreign direct investment relative to combined FDI and portfolio equity investments continued to decline (Chart 19 in the main body). The former should increase the resilience of financial integration and the latter decrease it. Measured quantity-based integration of the European Union green bond market may gradually decrease over time, from an initial high level, as all member states develop local bond supply and domestic investors have local alternatives (“home bias” effect). A particularly highly integrated European market is the relatively new market for green bonds. Box 4 of the report, however, finds that the limited investor home bias in this market (member countries’ investors holding a relatively large share of green bonds issued in other euro area countries) may have to do with the local underdevelopment of this market in some member countries. As soon as the domestic market develops and there is a greater local supply of green bonds, investors from these countries tend to reduce their foreign holdings to buy more domestically issued bonds and the green home bias increases, as a consequence. Although this process seems to be quite gradual, it may lead to a reduction of quantity-based integration measured in this market over time. The nature of the COVID crisis very much restricted private consumption risk sharing across euro area countries, limiting one of the benefits of financial integration and development. An important economic benefit expected from financial integration and development in the euro area is risk sharing across member countries. The associated financial flows are expected to help households to better stabilise income and consumption in the face of shocks. While estimates suggest that income risk sharing has been relatively stable over the last years and the pandemic – in contrast to the Great Financial Crisis and the European Sovereign Debt Crisis –, it also remains at relatively low levels (Chart 23 in the main body of the report). At the same time, the nature of the COVID crisis restricted key private channels for consumption risk sharing, since public health measures, mobility restrictions and production constraints limited households in consuming their regular consumption baskets. Given the long data windows with which consumption risk sharing needs to be estimated, the measured moderate recovery – driven much by Financial Integration and Structure in the Euro Area, April 2022 – Key messages 8
the credit channel but starting from a relatively low level – is still likely to be related to
    the resolution of the previous crises (Chart 24 in the main body). Box 5 of the report
    presents a historical analysis of the capital channel of risk sharing and confirms the
    relatively moderate contribution of this channel for the years following the European
    twin crises. Distinguishing a region of Northern euro area countries and a region of
    Southern euro area countries, it also finds that most of the capital channel operates
    within those regions rather than across them and that the inter-regional capital
    channel is particularly weak for the South.

    The major fiscal initiatives at the EU level, such as the NextGenerationEU
    recovery programme and the three safety nets for business, jobs and workers,
    were key for ensuring risk sharing among member countries and for
    compensating for the hampered private financial channels. Given the nature
    and severity of the COVID crisis, it was therefore critical that the hampered private
    risk sharing channels were swiftly complemented with fiscal channels. This was all
    the more important, as the European Economic and Monetary Union does not
    include a fiscal union and therefore the fiscal risk sharing channel in the euro area is
    typically estimated as very small (Chart 24 in the main body). Sizeable fiscal risk
    sharing mechanisms were established with the three EU safety nets for businesses,
    jobs and workers and, notably, the NextGenerationEU pandemic recovery
    programme. From 2021 to 2026 NGEU can mobilise funds in the order of 6 per cent
    of EU GDP, with a significant annual volume of debt issuance at the European level.
    A large share of the NGEU grants and loans will be distributed to the countries most
    affected by the pandemic. Moreover, due to the joint backing of debt by all EU
    member states loans can be made available at favourable conditions. Pay-outs have
    started towards the end of 2021 and about a third of NGEU funds are expected to be
    used by the end of 2022. All this brings fiscal risk sharing in the EU to another level
    for a number of years, as the programme is designed to be temporary. But the
    success of the associated investments and reforms is expected to have a significant
    impact on the future debate on fiscal integration in the EU.

2   Selected policy issues for financial structure and
    integration
    Completing the Banking Union and making material progress with the Capital
    Markets Union are key to enhance the integration and resilience of the
    financial sector and help Europe's post-COVID recovery. The description and
    assessments of financial integration and financial structure trends in the euro area
    and the EU in the previous section illustrate that there remain significant challenges
    ahead. Both as a consequence of the pandemic and as a consequence of otherwise
    existing trends. With the Banking Union (BU) and the Capital Markets Union (CMU)
    the EU has two interrelated projects under which many are already tackled, or new
    ones can be addressed going forward. A strong and integrated EU financial sector is
    essential to the EU’s post-recovery ambitions and requires a robust BU as well as an
    ambitiously deepened CMU, including in its green dimensions. The BU has come a
    long way since 2012, but further progress needs to be made on key missing

    Financial Integration and Structure in the Euro Area, April 2022 – Key messages             9
elements, such as improving the crisis management framework or setting up a
European deposit insurance scheme, and to ultimately complete the project. This
would enable banks to conduct their business across the banking union without
being hampered by national borders, allowing financing to reach the most promising
projects. It would also make the banking sector more resilient. At the same time, the
EU needs to urgently strengthen its financial markets beyond the banking segment.
More developed and integrated capital markets would allow companies to diversify
their funding sources, help mobilise investment across the Union and contribute to
overall financial resilience, provided that the resilience of the non-bank financial
sector is also strengthened so that it provides robust financing to companies in both
normal and stressed market conditions.2 Thus, the ECB welcomes the objectives of
the European Commission’s second CMU action plan of September 2020 to achieve
better access to finance for companies, make it safer for individuals to invest their
savings and to better integrate EU capital markets. It supports the full and swift
implementation of the envisaged reforms, including the proposals of November
20213 as well as outstanding actions such as on withholding tax and supervisory
convergence. Alongside the advancement of the EU’s sustainable finance
framework, these actions will also contribute to building a green CMU with sizeable,
mature and integrated green capital markets.4 The ECB also notes that more needs
to be done to complete the single market for investment funds with more widespread
cross-border distribution, because this promises to give investors more choice,
reduce costs and fees, as recently also noted in a report by the European Court of
Auditors (ECA).5 Assessing the suitability of the regulatory framework, the ECA
report highlights a lack of adequate and reliable data to mitigate risk to financial
stability as a key concern and calls for strengthening ESMA’s role as a supervisor.
Selected areas discussed in the main body of this report that need enhanced
policy efforts include equity markets, debt issuance procedures and bank
consolidation. This section highlights a small number of policy considerations that
emerge from the analysis presented in this report and go beyond the work already
going on under the BU and CMU, at least in some dimensions. They touch on the
role of more dynamic and integrated equity markets for financing European
innovation, on better integrating European debt issuance procedures and on the
need for further European bank consolidation.
The NextGenerationEU recovery and public investment programme provides a
unique historical opportunity to bring private risk capital markets in the euro
2 In view of vulnerabilities revealed during the March 2020 market turmoil, there is a need for authorities
to take a holistic and system-wide approach, consider the role of different players, and assess and
design policies to address the structural vulnerabilities in the non-bank financial sector. See Holistic
Review of the March Market Turmoil, Financial Stability Board, 17 November 2020; ECB Financial
Stability Review, November 2021, Section 5.2.2 Strengthening the policy framework for non-banks.
3 This package contains four follow-ups to the 2020 action plan. See European Commission (2021),
Capital Markets Union: Commission proposes new measures to boost Europe's capital markets, press
release, Brussels, 25 November.
4 See Towards a green capital markets union for Europe, speech by Christine Lagarde, President of the
European Central Bank, Frankfurt am Main, 6 May 2021; and Born, A., Giuzio, M., Lambert, C.,
Salakhova, D., Schölermann, H. and Tamburrini, F. (2021), Towards a green capital markets union:
developing sustainable, integrated and resilient European capital markets, Macroprudential Bulletin,
Issue 15, ECB.
5 See European Court of Auditors (2022), Investment funds - EU actions have not yet created a true
single market benefiting investors, special report 04, Luxembourg, 21 February.
Financial Integration and Structure in the Euro Area, April 2022 – Key messages 10area and EU to similar levels as is the case for other major economies. This
way, private and public forces together ensure enough innovation and prepare
the ground for financing the green, digital and other technological
transformations. The green and digital transformations require sizeable
investments for achieving the necessary technological and commercial innovations.
If anything, the COVID pandemic and recent geopolitical events have further
underlined the need to accelerate the EU’s twin transition. The European
Commission has estimated that the average additional investment effort until 2030 to
meet the EU’s current green and digital ambitions amounts to €650 billion per year
across the EU. While public investments under NGEU and its significant share in
green and digital investments will mean material progress, the required efforts will
not be possible without also very substantial private investment. The research
literature clearly suggests that public and private equity markets are much more
suitable for providing the necessary funding for relatively risky innovation-orientation
investment than bank lending. Yet, the relevant equity market segments in the euro
area are significantly smaller and less integrated compared to other major advanced
economies, even though European risk capital markets have grown well during the
last few years.6 For example, Chart 2.1 compares the size of risk capital markets in
the euro area and the United States. A particular bottleneck seems to be the small
size of European venture capital funds and a resulting lack of large funding rounds,
which particularly hamper successful companies with high growth potential to scale
up further. Moreover, public equity markets as the exit option for growing firms are
also very much smaller in the euro area than in the US (Chart A, panel a) in Box 1 of
the report).
The implementation of the 2020 CMU action plan can produce some tangible
progress in the development and integration of European equity markets. As
detailed in Box 1, For example, the creation of a European Single Access Point
(ESAP), a digital platform for harmonised company information, including
sustainability-related information and open to small and medium-size enterprises
(SMEs), as proposed by the Commission last November, can help to connect
investors and companies. Moreover, the ongoing review of EU fund and insurance
regulation envisages to facilitate institutional investors’ investments in green or other
innovative projects. Additional measures under the Action Plan are forthcoming. The
planned review of EU public listing rules should proceed swiftly to make listing easier
for SMEs, including the set-up of an SME Initial Public Offering (IPO) fund.
Moreover, the thorny path of making insolvency frameworks more efficient and more
harmonised across member countries needs to be continued, as envisaged via a
Commission proposal to be published later this year. This seems also important
because of the greater indebtedness of many companies due to the COVID crisis
and the possibility that currently low default rates may increase once fiscal support
and public guarantees fully vanish.
6 See, for example, the pre-IPO risk capital indicator published by the Association for Financial Markets
in Europe (2021), Capital Markets Union: Key performance Indicators – Fourth Edition, October.
Financial Integration and Structure in the Euro Area, April 2022 – Key messages 11Chart 2.1
Size and composition of risk capital markets in the euro area and United States
(EUR billion; annual data: 2016 2020)
Business angel
Venture capital
Growth capital
250
200
150
100
50
0
2016 2017 2018 2019 2020 2016 2017 2018 2019 2020
Euro area US
Sources: European Business Angel Network (EBAN), Invest Europe, National Venture Capital Association (NVCA), Center for Venture
Research (University of New Hampshire) for panel b.
Notes: The data covers data for all euro area countries excluding Cyprus, Malta, Slovakia and Slovenia. Venture capital is a subset of
private equity and refers to equity investments made for launch (seed), early development (start-up), or expansion (later stage venture)
of business. “Seed” is funding provided before the investee company has started mass production/distribution with the aim to complete
research, product definition or product design, also including market tests and creating prototypes. This funding will not be used to
start mass production/distribution. “Start-up” is funding provided to companies, once the product or service is fully developed, to start
mass production/distribution and to cover initial marketing. Companies may be in the process of being set up or may have been in
business for a shorter time but have not sold their product commercially yet. The destination of the capital would be mostly to cover
capital expenditures and initial working capital. “Later stage venture” is financing provided for an operating company, which may or
may not be profitable. Late stage venture tends to be financing into companies already backed by VCs. For further details see
www.investeurope.eu/research/. As for “Business Angel” investment these are (high-risk) investments made by private early stage
investors typically in the form of seed financing towards startup businesses. Angel investment comprises financial contribution in
addition to the investment of time, expertise and connections that the investors also provide in exchange for ownership equity in the
startups.
Yet further actions will be necessary to build a vibrant EU equity ecosystem,
notably to support European companies with high growth potential to scale up
their activities. Greater efficiency and harmonisation of equity and venture capital
frameworks across Member States, including addressing the debt-equity bias in
taxation, could contribute to further grow and integrate the market. It is also
worthwhile to consider how large companies can be further incentivised to provide
corporate venture capital to start-ups.7 Moreover, the extent of the currently ongoing
technological transformations, the importance of risk capital for innovation and in turn
the EU’s growth and competitiveness requires commensurate engagement of both
the private and the public sector and the adequate balance between the two. For
example, it may justify targeted public support to stimulate private investment in
promising projects. The Scale-up Europe initiative launched by the French
Presidency of the EU to achieve large pan-European equity funds for late-stage
company financing is targeting precisely one key bottleneck in Europe’s capital
market landscape. Obviously, the success of such initiatives also depends on
effective policies in other fields outside the strict financial area, such as education,
business-university clusters, competition, company and labour regulations, taxation
and pension reforms.
Debt issuance procedures need also to be better integrated and harmonised to
reduce costs and allow investors to better diversify across EU countries.
7 For example, CB Insights’ 2020 Global CVC Report suggests that Europe is lagging the United States
and Asia also in corporate venture capital.
Financial Integration and Structure in the Euro Area, April 2022 – Key messages 12Turning to debt securities markets, there is no uniform issuance procedure at the moment. Box 3 of the report assesses to which extent home bias in debt securities holdings in the euro area could be reduced, if certain aspects of issuance processes were better integrated and therefore transaction costs reduced. The box focuses on links between Central Securities Depositories (CSDs), institutions mainly responsible for settlement and custody services and involved in the issuance process of new securities via their notary services. It finds that the existence of a link between two CSDs is associated with an economically and statistically significant reduction of home bias. It is therefore advisable to further integrate and harmonise debt issuance processes in the EU. Accordingly, the ECB supports initiatives under the September 2020 CMU action plan to reduce fragmentation in the European post-trade landscape and the SCoReE project (Single Collateral Management Rulebook for Europe). As further domestic and cross-border bank consolidation could help address structurally low profitability and fragmentation in retail credit markets, it should be considered to remove remaining regulatory obstacles. In what concerns EU credit institutions, further consolidation could reap several benefits. With a significant cross-border dimension, it could foster the integration of credit markets, diversify revenue sources and avoid concentrations at local level. Both domestic and cross-border bank mergers have the potential to address excess capacities and cost inefficiencies, two of the factors behind structurally low profitability in Europe. Chart 2.2 suggests that consolidation has been limited since the creation of the BU in 2012, despite some moderate pick up lately (see also Chart 7, left panel, in the main body). While further consolidation should remain a market-driven process and be based on credible business plans ensuring institutions’ stability, ECB Banking Supervision supports addressing remaining regulatory obstacles to cross-border consolidation. For example, consolidation through branches rather than subsidiaries could imply a deeper and more cost- effective form of consolidation, but it may presently lead to a reallocation of risk across national Deposit Guarantee Schemes. The current Deposit Guarantee Scheme Directive only allows the transfer of contributions for the last 12 months before a merger from the previously responsible scheme to the new one. A more balanced approach to the allocation of resources, in line with the opinion of the European Banking Authority on the issue, would limit risk shifting between the two schemes. In previous reports, the ECB has also made suggestions for the effective use of intragroup waivers to enhance the cross-border fungibility of capital and liquidity within banking groups. Financial Integration and Structure in the Euro Area, April 2022 – Key messages 13
Chart 2.2
           Total assets of target banks in the euro area
           (EUR billions)
                       Cross-border transactions
                       Domestic transactions

Billions   1,400

           1,200

           1,000

             800

             600

             400

             200

                0
                    1999           2002            2005           2008           2011            2014            2017           2020

           Source: ECB calculations based on Dealogic and Orbis BankFocus.
           Notes: The sample includes M&A transactions involving significant institutions and less significant institutions in the euro area,
           excluding some private transactions and transactions among small banks not reported in Dealogic. Transactions associated with the
           resolution of banks and distressed mergers were removed from the sample. Transactions are reported based on the year in which they
           were announced.

           Financial Integration and Structure in the Euro Area, April 2022 – Key messages                                               14
Structure and integration developments
in the euro area financial system
We have recently witnessed an unprecedented shock, with non-financial
corporations (NFCs) at its epicentre. The coronavirus brought a type of shock that
was unprecedented in our lifetime, triggering a sharp economic downturn
extraordinary in its speed, reach and scale across the world. The NFC sector was
the economic epicentre of the COVID-19 pandemic, as a significant part of it was
temporarily shut down or reduced in capacity. Risks then spread within the corporate
sector – in the form of supply chain disruptions – and thereafter to bank and non-
bank lenders. Despite its common origin, the economic and financial fallout from the
crisis has been asymmetric across euro area countries: i.e. the effects on production,
trade, investment, employment, consumption and financial systems have varied.
Financial structures and integration were severely stressed by the coronavirus
crisis. A sequence of concerted monetary, fiscal and prudential policy responses
were taken to mitigate the initial tendencies to financial fragmentation and avoid the
financial sector aggravating the real-side impacts. As the period covered by this
report (the last two years) coincides with the COVID-19 pandemic, the economic and
financial implications of which started to materialise in Europe around mid-February
2020, particular emphasis is placed on how the ongoing crisis is influencing financial
integration, structures and developments in the euro area.
The state of financial integration and the evolving structure of financial
markets and intermediaries are two key elements for gauging the functioning
of European Economic and Monetary Union (EMU). For example, they influence
the extent to which asymmetric shocks can be shared and how the single monetary
policy is transmitted across member countries.
This chapter is structured in two parts. The first investigates the structure of euro
area financing markets and the provision of this financing by different euro area
financial intermediaries. The second then focuses on measuring the extent of
financial integration in the euro area, assessing the resilience of this integration and
evaluating its implications for risk sharing.
1 Financial market structure
External financing of euro area NFCs and households (HHs) has held up since
the onset of the pandemic (Chart 1, left-hand and middle panels, dark blue
lines). It remained at levels broadly comparable with the pre-pandemic years, thanks
to coordinated fiscal, monetary and prudential policy measures. NFCs and HHs
financed themselves via debt instruments – loans, trade credits and debt securities –
and equity instruments including listed and unlisted shares and other types of
Financial Integration and Structure in the Euro Area, April 2022 – Structure and integration
developments in the euro area financial system 15equities.8 The timely and effective fiscal policy responses that stabilised markets and
the economy came, however, at the cost of a significant increase in the financing
needs of the general governments (GGs) (Chart 1, right-hand panel).
NFC external financing increased strongly at the start of the pandemic, and
then slowed down from the second half of 2020. At the onset of the crisis, NFCs
built precautionary liquidity buffers and front-loaded their financing needs via bank
loans and debt securities,9 as trade credit slowed down in the first half of 2020 on
the back of much reduced economic activity.10 The increase in external financing
from the second half onwards was driven by improvements in trade credit and
lending between NFCs, reflecting the recovery in economic activity and large firms’
liquidity support to their subsidiaries, sub-contractors and customers.
The economic contraction, combined with sharp declines in corporate sales
and cash flows during the first months of the pandemic, drove up NFCs’ bank
borrowing and net debt securities issuance in 2020 on the back of substantial
monetary and fiscal policy support. As NFCs made a substantial effort to build up
their cash buffers in 2020 and the larger ones replaced bank borrowing with market-
based debt, their reliance on bank loans remained subdued in 2021. The debt
increase in the euro area NFC sector was facilitated by the ECB stepping up its
corporate bond purchases, as part of the Pandemic Emergency Purchase
Programme (PEPP). The TLTRO-III also had a positive impact on bank lending to
firms.
Net issuance of listed NFC shares was negative in 2020, only returning to
positive levels in 2021. At the same time net issuance of unlisted shares
increased markedly. Net issuance of listed NFC shares in 2020 was strongly and
negatively affected by a shift from listed equites to unlisted, mergers and acquisitions
(M&A) and balance sheet restructuring by multinationals. In addition to the impact of
de-listing, net issuance of unlisted shares was supported by the recovery in the
creation of new firms and possible recapitalisation needs of existing businesses. The
renewed increase in net listed shares in 2021 was driven by robust issuance in the
8
The European system of accounts (ESA 2010) defines the instruments included in Charts 1 and 2 as
follows: Equity is a financial asset that is a claim on the residual value of a corporation, after all other
claims have been met. Listed shares are equity securities listed on an exchange. Such an exchange
may be a recognised stock exchange or any other form of secondary market. Listed shares are also
referred to as quoted shares. The existence of quoted prices of shares listed on an exchange means
that current market prices are usually readily available. Unlisted shares are equity securities not listed
on an exchange. Other equity comprises all forms of equity other than those classified in the sub-
categories listed shares and unlisted shares. In particular, it includes all forms of equity in corporations
which are not shares, including the following: (1) the equity in incorporated partnerships subscribed by
unlimited partners; (2) the equity in limited liability companies whose owners are partners and not
shareholders; (3) the capital invested in ordinary or limited partnerships recognised as independent
legal entities; (4) the capital invested in cooperative societies recognised as independent legal entities.
9 Banks let companies drew elastically on credit lines during the initial stages of the crisis, playing the
valuable role of “elastic nodes” in the financial system (see Aramonte S., Schrimpf, A. and Shin, H.S.
(2021), “Non-bank financial intermediaries and financial stability”, BIS Working Papers, No 972, Basel,
October).
10 European Central Bank (2021), “Non-financial corporate health during the pandemic”, Economic
Bulletin, Issue 6, Frankfurt, September.
Financial Integration and Structure in the Euro Area, April 2022 – Structure and integration
developments in the euro area financial system 16technology sector, moderate recapitalisations by unlisted firms and improvements in
new listings.11
Household financing flows remained at pre-pandemic levels all along. Fiscal
support measures for households, high household saving ratios and continued credit
growth on the back of lending for house purchases sustained household financing.
Government financing increased strongly in 2020 before the economic
recovery in the latter part of 2020 and 2021, coupled with progress on the
health crisis, partly reversed the drivers of this trend. The sharp contraction in
economic activity in the first half of 2020 led to a sudden drop in tax revenues and a
surge in current expenditures (due to automatic stabilisers and increased subsidies
and transfer payments). While government consumption and investment increased
from late 2020, government income also grew substantially as tax collection rose
and the fiscal support measures for households put in place to mitigate the crisis
declined.
Chart 1
External financing of euro area NFCs, households and general governments by
instrument
(flows; four-quarter sums; EUR billions, Q4 for 2017-2020; Q3 for 2021)
Total external financing Loans from rest of the world
Loans from MFIs Unlisted shares and other equity
Debt securities Trade credit
Listed shares Other
Loans from non-MFIs
1,400,000
1,200,000
1,000,000
800,000
600,000
400,000
200,000
0
-200,000
-400,000
2017 2018 2019 2020 2021 2017 2018 2019 2020 2021 2017 2018 2019 2020 2021
Q4 Q4 Q4 Q4 Q3 Q4 Q4 Q4 Q4 Q3 Q4 Q4 Q4 Q4 Q3
NFC sector HH sector GG sector
Sources: ECB (euro area accounts) and ECB calculations.
Notes: MFI stands for Monetary and Financial Institutions. Non-MFIs include other financial institutions (OFIs) as well as insurance
corporations and pension funds (ICPFs). "Other" is the difference between the total and the instruments included in the figure and
includes inter-company loans and the rebalancing between non-financial and financial accounts data. Figures shown represent the
sum of flows over the last four quarters at the end of Q4 for 2017 to 2020 and of Q3 for 2021.
For all sectors, the COVID-19 crisis increased the outstanding amount of total
financing relative to euro area GDP. It also moderately altered the composition
of the euro area economy’s balance sheet liabilities (Chart 2). The amount of
total financing grew, both as a result of increased volumes and higher valuations. At
the end of the third quarter of 2021, aggregate financing amounted to €73.8 trillion,
11 Recovery in entries was not uniform across countries, however. See: Criscuolo, C., “Productivity and
Business Dynamics through the lens of COVID-19: the shock, risks and opportunities”, paper
presented at the ECB Forum on Central Banking 2021
Financial Integration and Structure in the Euro Area, April 2022 – Structure and integration
developments in the euro area financial system 17or 6.1 times nominal GDP (Chart 2, middle panel).12 The strong net issuance of
debt securities since end-2019 has extended the euro area economy’s reliance on
debt financing and increased the use of marketable instruments in the euro area
economy’s financing mix. Debt instruments and marketable instruments increased
their relative share in the financing mix by 1.1 percentage points and 0.6 percentage
points respectively, mostly on account of the large government debt increase. Euro
area GDP also declined considerably in 2020.
Chart 2
External financing of euro area economy
(EUR trillions (both left-hand and right-hand (ratio to nominal GDP; end-of-period (percentages; end-of-period stocks, Q4 for
scales); end-of-period stocks, Q4 for 2017 - stocks, Q4 for 2017 -2020; Q3 for 2021) 2017 -2020; Q3 for 2021)
2020; Q3 for 2021))
Listed Shares
Non-financial corporation debt
securities
Government debt securities
Bank debt securities
Trade credits and advances
Other equity
Unlisted shares
Loans
Nominal GDP
80 12.2 7 100%
Millions
Millions
90%
70 12.0 6
80%
60
11.8 5 70%
50 60%
11.6 4
40 50%
11.4 3
40%
30
11.2 2 30%
20
20%
10 11.0 1
10%
0 10.8 0 0%
2017 2018 2019 2020 2021 2017 2018 2019 2020 2021 2017 2018 2019 2020 2021
Q4 Q4 Q4 Q4 Q3 Q4 Q4 Q4 Q4 Q3 Q4 Q4 Q4 Q4 Q3
Sources: ECB (euro area accounts) and ECB calculations.
Notes: The chart is constructed from the liabilities of all economic sectors, excluding liabilities to the rest of the world, loans from NFCs
(to net out intra-company loans in this non-consolidated data), currency and deposits, investment fund shares or units, entitlements
from pension, insurance and standardised guarantee schemes, financial derivatives and employee stock options as well as other
accounts payable. Other equity refers to equity claims that are not securities listed on an exchange and not unlisted securities, such as
equity in incorporated partnerships, equity in limited liability companies whose owners are partners, capital invested in cooperative
societies or investment by the government in the capital of public corporations whose capital is not divided into shares. The European
System of Accounts (ESA) 2010 underlying the euro area data is broadly consistent with the SNA 2008, although in some cases it may
be more detailed.
The figures for 2021 include values up to Q3, due to data availability.
An overarching lesson is that post-pandemic financing needs call for deeper
and more dynamic capital markets, in particular equity markets, as well as the
mobilisation of additional capital.13 The euro area NFC sector in particular will
need to re-balance debt/equity ratios to address the post-pandemic debt overhang
by reallocating capital from debt to equity or mobilising additional risk capital to
support growth and innovation in the euro area economy. A case in point is the depth
and integration of the rapidly growing sustainable financing segment (see
12 Compared to 2019, it increased by EUR 0.6 trillion and represents a 0.35 times larger share relative to
GDP.
13 See also “Europe needs a fully fledged capital markets union – now more than ever”, ECB Blog post by
Luis de Guindos, Vice-President of the ECB, and Fabio Panetta and Isabel Schnabel, Members of the
Executive Board of the ECB, 2 September 2020.
Financial Integration and Structure in the Euro Area, April 2022 – Structure and integration
developments in the euro area financial system 18Box 1: Making euro area equity markets fit for green and digital innovation).
Euro area economic agents will most importantly need to cater for investment efforts
to meet the challenges of greening and digitising the euro area economy. At the EU
level, these are estimated at €650 billion per year up to 2030.14 This annual
investment effort represents 5.4% of euro area GDP, 31.2% of combined euro area
NFC, HH and GG financing and 2.3% of euro area household deposits (four quarter
sum figures at the end of the third quarter of 2021).
The euro area financial sector’s capacity to attract and intermediate funds to
euro area economic agents will crucially depend on scaling up market-based
financing and an increasing role for the non-bank financial sector. The ECB
regularly assesses these issues (see Sections 3.1 and 3.2) and tracks progress (see
Box 2: Measuring market-based and non-bank financing).
Box 1
Making euro area equity markets fit for green and digital innovation
Prepared by O. Carradori, P. Molitor and H. Schölermann
Capital markets, and equity financing in particular, will be essential to meet the EU’s post-
recovery ambitions. The investment required to green and digitalise the EU economy is estimated
at €650 billion per year until 2030, far exceeding public recovery spending.15 Alongside public
investment programmes such as NextGenerationEU, which are expected to considerably boost
innovative sectors and companies, private investment will have to be stepped up significantly over
the coming years. This would help meet programme objectives and leverage the innovation and
transformation potential, especially as public programmes expire.16 From a financing perspective,
research shows that equity is more suitable for riskier and innovative projects than debt.17 Equity
financing can also have a stabilising impact in an environment in which the COVID-19 crisis has
increased corporate leverage substantially. Equity will thus be vital in closing the investment gap
and financing post-recovery economic activity. This box provides an overview of euro area equity
markets by type of equity and investor and highlights the need to further improve Europe’s equity
landscape, in particular as regards risk capital.
Equity financing plays a central role in funding innovation, and is therefore a crucial
complement to public investment in delivering the green and digital transition.18 In contrast to
bank lenders, equity investors are more willing to assume the greater risks associated with
14 European Commission (2021), “The EU economy after COVID-19: implications for economic
governance”, Communication from the European Commission, COM(2021) 662 final, Strasbourg,
October..
15 European Commission (2021), “The EU economy after COVID-19: implications for economic
governance”, Communication from the European Commission, COM(2021) 662 final, Strasbourg,
October.
16 Disbursements by NextGenerationEU will run until 2026.
17 See Bongini, P., Ferrando, A., Rossi, E. and Rossolini, M. (2021), “SME access to market-based
finance across Eurozone countries”, Small Business Economics, vol. 56(4), pp. 1667-1697l; Hsu, P.,
Tian, X. and Xu, Y. (2014), “Financial development and innovation: Cross-country evidence”, Journal of
Financial Economics, Vol. 112, No 1, pp. 116-135.
18 See Aghion, P., Boneva, L., Breckenfelder, J., Laeven, L., Popov, A., Olovsson, C., and Rancoita, E.
(2022), “Financial markets and green innovation”, ECB Discussion Paper, forthcoming.
Financial Integration and Structure in the Euro Area, April 2022 – Structure and integration
developments in the euro area financial system 19You can also read