FIRST QUARTER 2022 EARNINGS - MGM RESORTS INTERNATIONAL - MAY 2, 2022
←
→
Page content transcription
If your browser does not render page correctly, please read the page content below
MGM RESORTS INTERNATIONAL
FIRST QUARTER 2022 EARNINGS

          MAY 2, 2022
        MGM RESORTS INTERNATIONAL
F O R WA R D - L O O K I N G S T A T E M E N T S
Statements in this presentation that are not historical facts are forward-looking statements, within the meaning of the Private Securities Litigation Reform Act of 1995 and involve risks and/or uncertainties, including
those described in the Company's public filings with the Securities and Exchange Commission. The Company has based forward-looking statements on management’s current expectations and assumptions and
not on historical facts. Examples of these statements include, but are not limited to, the Company’s expectations regarding the closing of the sale of The Mirage, the purchase of The Cosmopolitan of Las Vegas
and the closing of our offer to purchase LeoVegas (collectively, the “Transactions”) and any excepted benefits to be received from the Transactions. Additional forward-looking statements also include statements
related to the Company’s financial outlook (including expectations regarding its liquidity position, long term cost savings and corporate expense), the continued impact of the COVID-19 pandemic on the
Company’s operations, the Company’s ability to execute on its strategic pillars, the Company's ability to return value to shareholders (including the timing and amount of any share repurchases or dividends),
expectations regarding the development of an integrated resort in Japan and in New York, the positioning of BetMGM as a leader in sports betting and iGaming (including BetMGM’s expected growth in new and
existing jurisdictions and projected market share) and expectations regarding the renewal of the Company’s subconcession in Macau. These forward-looking statements involve a number of risks and
uncertainties. Among the important factors that could cause actual results to differ materially from those indicated in such forward-looking statements include the continued impact of the COVID-19 pandemic,
effects of economic and other conditions in the markets in which the Company operates and competition with other destination travel locations throughout the United States and the world, the design, timing and
costs of expansion projects, risks relating to international operations, permits, licenses, financings, approvals and other contingencies in connection with growth in new or existing jurisdictions and additional risks
and uncertainties described in the Company’s Form 10-K, Form 10-Q and Form 8-K reports (including all amendments to those reports). In providing forward-looking statements, the Company is not undertaking
any duty or obligation to update these statements publicly as a result of new information, future events or otherwise, except as required by law. If the Company updates one or more forward-looking statements, no
inference should be drawn that it will make additional updates with respect to those other forward-looking statements.

                                                                                  MARKET AND INDUSTRY DATA
This presentation also contains estimates and information concerning the Company’s industry that are based on industry publications, reports and peer company public filings. This information involves a number
of assumptions and limitations, and you are cautioned not to rely on or give undue weight to this information. The Company has not independently verified the accuracy or completeness of the data contained in
these industry publications, reports or filings. The industry in which we operate is subject to a high degree of uncertainty and risk due to a variety of factors, including those described in the “Risk Factors” section of
the Company’s public filings with the SEC. Third party logos and brands included in this presentation are the property of their respective owners and are included for informational purposes only.

                                         NOTE REGARDING PRESENTATION OF NON -GAAP FINANCIAL MEASURES
This presentation includes certain “non-GAAP financial measures” as defined in Regulation G under the Securities Exchange Act of 1934, as amended. Schedules that reconcile the non-GAAP financial measures to
the most directly comparable financial measures calculated and presented in accordance with Generally Accepted Accounting Principles in the United States are included herein or in the Company’s earnings
releases that have been furnished with the SEC and are available on our website at www.mgmresorts.com.
In this presentation we also present 2019 Adjusted Property EBITDA for The Mirage, which is calculated as 2019 reported Adjusted Property EBITDAR less rent of $90 million. Schedules that reconcile The Mirage
Adjusted Property EBITDAR to the most directly comparable financial measure calculated and presented in accordance with GAAP are available in the Company's earnings release, dated February 12, 2020, that
was furnished with the SEC and our available on our website at www.mgmresorts.com.

                                  IMPORTANT NOTE REGARDING BETMGM FINANCIAL AND OTHER INFORMATION
This presentation includes certain financial and other information related to BetMGM and the industry in which BetMGM operates, which is jointly owned by the Company and Entain plc. This information was
obtained from BetMGM management and while the Company believes such information to be reliable and accurate, the Company has not independently verified it and does not make any representation as to its
accuracy. BetMGM financial information is not prepared in accordance with GAAP. If BetMGM presented these financial measures in accordance with GAAP, then BetMGM would present the revenues associated
with its Nevada digital and retail sports betting operations differently, until such time as BetMGM is directly licensed as a Nevada gaming operator. Currently under GAAP, its calculation of net revenue would be on
a basis net of operating costs, such that the GAAP reported net revenue would be lower than the net revenue reported herein, with net income remaining the same. BetMGM projected net revenue from operations
and target EBITDA margins are also based on significant assumptions regarding the extension of current market trends in the states where BetMGM currently operates as well as assumptions regarding BetMGM’s
expansion into new jurisdictions in 2022. These assumptions are subject to significant risks and uncertainty and as a result investors are cautioned not to place undue reliance on such statements as a prediction of
BetMGM’s actual results. See “Forward-looking Statements” above.

  MGM RESORTS INTERNATIONAL                                                                                                                                                                                                     2
OUR STRATEGIC PILLARS

                                                          Recruit, develop and retain the best talent
                                     STRONG PEOPLE        Foster a culture of diversity and inclusion
                                      AND CULTURE
                                                          Invest in the employee experience

                                                          Leverage a customer-centric model reinforced by
                                   CUSTOMER-CENTRIC       a strong brand and deep customer insights to
                                                          provide unmatched entertainment experiences for
                                        MODEL             our guests and drive top-line growth
    OUR VISION:
   TO BE THE WORLD’S
        PREMIER                                           Operating model refinement to diversify business
                                                          mix, maximize operating efficiencies, and expand
 GAMING ENTERTAINMENT                 OPERATIONAL         margins
       COMPANY                        EXCELLENCE
                                                          Enhancement of digital capabilities to strengthen
                                                          customer loyalty

                                                          Pursuit of targeted, attractive ROI opportunities
                                    DISCIPLINED CAPITAL   that align to the Company’s strategic vision

                                 ALLOCATION TO MAXIMIZE   Focus on shareholder returns
                                   SHAREHOLDER VALUE
                                                          Fortify balance sheet

MGM RESORTS INTERNATIONAL                                                                                     3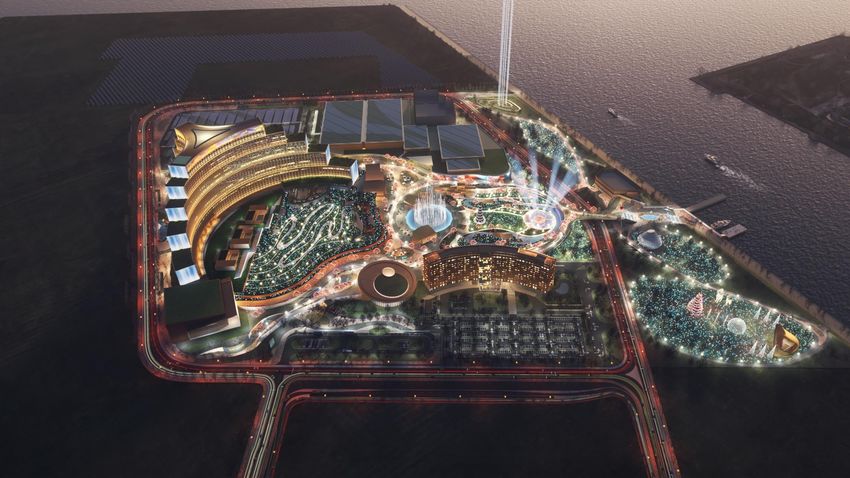
•   1Q 2022 FINANCIAL RESULTS
 TABLE OF   •   BETMGM
CONTENTS
            •   SUPPLEMENTAL

                                            4
1Q 2022 – LAS VEGAS STRIP
                   ALL-TIME RECORD ADJUSTED PROPERTY EBITDAR FIRST QUARTER, WITH RECORD FIRST QUARTER MARGINS

                       Net Revenues                                          Adjusted Property EBITDAR and Margin %                                                                                               Margin %
                        ($ in U.S. millions)                                                                    ($ in U.S. millions)

              Actual                    Hold-Adjusted                                Actual                                   Hold-Adjusted                                                        Actual                              Hold-Adjusted
          $1,663                        $1,655
                                                                                                                                                                                       +744bps                                  +700bps
                                                                                                                                                                                       vs. 1Q19                                 vs. 1Q19
116% of                       115% of                                         $594                                             $587
 1Q19                          1Q19                                                                                                                                                        35.7%                                       35.5%
                                                                                                $404                                             $408                                                         28.3%                                        28.5%
                                                                      147% of                                             144% of
                   $1,428                        $1,433                1Q19                                                1Q19

          1Q22      1Q19                1Q22     1Q19                        1Q22              1Q19                           1Q22              1Q19                                       1Q22              1Q19                      1Q22                1Q19

           Casino and hotel metrics 1Q 2022 vs. 1Q 2019 (as reported):                                           Same-store 1Q 2022 (excl. Aria & Vdara) vs. 1Q 2019 (excl. Circus Circus):
           • Casino revenues +46% vs. 1Q 2019                                                                    • Casino revenues +21% vs. 1Q 2019
              – Table games drop +24%; win +33%                                                                     – Table games drop -9%; win flat
              – Slot handle +51%; win +53%                                                                          – Slot handle +27%; win +33%

           • Hotel revenues +4% vs. 1Q 2019                                                                      • Hotel revenues -13% vs. 1Q 2019
              – Occupancy of 78% compared to 90% in 1Q 2019                                                         – Occupancy of 78% compared to 91% in 1Q 2019
              – ADR +14%                                                                                            – ADR +1%
              – RevPAR1 -1%                                                                                         – RevPAR1 -14%

  MGM RESORTS INTERNATIONAL                        Note: Unless otherwise noted, datapoints include the results of Aria and Vdara commencing September 27, 2021 only and 2019 datapoints include Circus Circus Las Vegas which was sold in December 2019
                                                   1 RevPAR is hotel revenue per available room
                                                                                                                                                                                                                                                                   5
1Q 2022 – REGIONAL OPERATIONS
          ALL-TIME RECORD ADJUSTED PROPERTY EBITDAR FIRST QUARTER, WITH RECORD FIRST QUARTER MARGINS

                            Net Revenues                      Adjusted Property EBITDAR                                                     Margin %
                               ($ in U.S. millions)                    ($ in U.S. millions)

              111% of
               1Q19     $891
                                                      $804
                                                                                                                          +882 bps
                                      $711                                                                                vs. 1Q19   35.2% 34.0%
                                                             148% of
                                                              1Q19
                                                                                                                                                       26.3%
                                                                  $313
                                                                                 $242         $212

                        1Q22        1Q21              1Q19      1Q22           1Q21           1Q19                                   1Q22    1Q21      1Q19

   • Strong first quarter results driven by higher rated player spend levels and a             • Casino metrics 1Q 2022 vs. 1Q 2019:
     continued focus of operating costs and labor productivity                                    – Casino revenues +23%
      – Expect casino spend levels to normalize over time                                         – Table games drop +1%; win +9%
      – Staffing expected to continue to ramp up as more non-gaming outlets                       – Slot handle +18%; win +23%
        reopen

MGM RESORTS INTERNATIONAL                                                                                                                                      6
1Q 2022 – MGM CHINA
                      PUBLIC HEALTH POLICY HEADWINDS BUT CONTINUED TO DRIVE MARKET-SHARE GROWTH

                                                              Net Revenues                      Adjusted Property EBITDAR
                                                                  ($ in U.S. millions)                ($ in U.S. millions)

                                                                                         $734

                                                         37% of
                                                          1Q19

                                                                        $315
                                                          $268
                                                                                                                             $193

                                                                                                               $5

                                                                                                  ($26)
                                                         1Q22          4Q21              1Q19     1Q22      4Q21             1Q19

   • 1Q22 Adjusted Property EBITDAR declined sequentially vs. 4Q21; partially driven by $18 million in litigation reserves

   • VIP table games turnover of $963 million fell 45% sequentially vs. 4Q 2021
      – Win of $23 million decreased 55% sequentially vs. 4Q 2021, driven by volume decrease and lower hold (2.4% in 1Q 2022 vs. 2.9% in 4Q 2021)

   • Main floor table games drop of $1.1 billion decreased 6% sequentially vs. 4Q 2021, and 45% vs. 1Q 2019 levels
     – Win of $239 million decreased 9% sequentially vs. 4Q 2021; due to volume and hold (hold was 21.8% in 1Q 2022 vs. 22.5% in 4Q 2021)

   • See Supplemental section for MGM China reported property-level details

MGM RESORTS INTERNATIONAL                                                                                                                           7
MGM CHINA’S MARKET OUTPERFORMANCE
                  GGR MARKET SHARE IN 1Q 2022 REMAINS WELL ABOVE 2019 AND 2020 LEVELS

                                                         MGM China GGR Market Share
                                                                                                      13.8%   14.0%
                                                                                                                      13.3%
                                                                            12.6%
                                                                                      11.5%
                                                                                              11.2%

                      9.9%
        9.4%                     9.5%
               9.2%
                                                  8.7%

                                                         7.4%   7.4%

        1Q19   2Q19   3Q19       4Q19             1Q20   2Q20     3Q20      4Q20      1Q21     2Q21   3Q21    4Q21    1Q22

MGM RESORTS INTERNATIONAL    Source: DICJ Macau GGR
                                                                                                                              8
KEY 1Q 2022 TAKEAWAYS

 Rapid recovery in domestic operations following initial Omicron slow down
 • First quarter Adjusted Property EBITDAR records driven by elevated customer spend and continued realization of cost-saving initiatives
 • Maintained domestic margin gains over 2019 despite a weaker January
 • MGM China achieved 13% market share despite headwinds from public health policy

 Progress made in strategic actions to bolster liquidity and position the Company for long-term value creation
 • Approaching finish line in acquisition of The Cosmopolitan of Las Vegas, which will further diversify and enhance the Las Vegas Strip portfolio
 • Approximately $6.3 billion of domestic liquidity (excluding MGP and MGM China) as of March 31, 2022, adjusted for recent transactions and near-term maturities1
 • Returned cash to shareholders via $1.0 billion of share repurchases in the first quarter
    – Since the initiation of the $3 billion repurchase plan in 2021, repurchased approximately 66 million shares for $2.8 billion
    – Received board approval for an additional $2 billion repurchase plan during the first quarter

 Growth opportunities align with vision to be the world’s premier gaming entertainment company
 • U.S. Sports betting and iGaming: BetMGM has established itself as a leading operator nationwide, with the #1 position in iGaming2
 • International iGaming: Announced acquisition of LeoVegas to position MGM in international online gaming
 • Asia diversification: Selected as Osaka’s integrated resort partner in Japan; Further investments in Macau
 • Disciplined exploration of key new jurisdictions (e.g. New York commercial casino opportunity)
 • Investing in our core business to drive deeper customer loyalty through MGM Rewards, enabled by advanced marketing practices and physical and digital
   experiences

                                               1   Refer to calculation provided on slide 12
                                               2   Based on revenue figures reported by states, BetMGM management estimates, and third-party estimates

MGM RESORTS INTERNATIONAL                                                                                                                                            9
1Q 2022 FINANCIAL ITEMS

 BetMGM
   • 1Q 2022 net revenues associated with BetMGM operations were $271 million1
   • MGM Resorts’ 50% share of BetMGM’s operating loss2 was $92 million in 1Q 2022, driven by one time promotional spend to enter new markets

 Corporate expense (net)3
   • 1Q 2022: $111 million, including approximately $9 million in transaction costs

 Capital expenditures
   • 1Q 2022 U.S.: $93 million
   • 1Q 2022 MGM China: $9 million
   • We expect 2022 capital expenditures to be as follows:
      - U.S.: $750-800 million
      - MGM China: $85-100 million

 Cash Rent
   – Expected annual cash rent relating to triple net and ground leases, adjusted for pending transactions, is $1.77 billion4

                                            1 Net revenues for 1Q 2022 for the BetMGM joint venture on a GAAP basis was approximately $260 million, which includes approximately $24 million related to Nevada sportsbooks operations for which BetMGM records
                                            on a net basis as BetMGM is considered to be the agent in the Nevada transactions for GAAP purposes. MGM Resorts recorded $31 million of net revenues for Nevada sportsbooks operations during 1Q 2022
                                            2 Reported as part of the Company’s Adjusted EBITDAR under “Unconsolidated affiliates”

MGM RESORTS INTERNATIONAL
                                            3 Refer to “SUPPLEMENTAL DATA – ADJUSTED PROPERTY EBITDAR AND ADJUSTED EBITDAR” table within the Company’s earnings release

                                            4 Reflects $1.67 billion as of March 31, 2022, adjusted to add $200 million for The Cosmopolitan transaction, add $860 million for the VICI transaction, which replaces the $873 million of MGP rent, and to remove $90
                                            million for The Mirage transaction
                                                                                                                                                                                                                                                                      10
STRATEGIC MILESTONES
▪ BetMGM, MGM’s U.S. sports betting and iGaming
joint venture, has established itself as a clear leader
in the market
▪ Closed the transaction with VICI for the redemption of ALIGNS WITH COMPANY VISION
the Company’s MGM Growth Properties (“MGP”) TO BE THE WORLD’S PREMIER
operating partnership units for $4.4 billion cash as GAMING ENTERTAINMENT
part of VICI’s acquisition of MGP COMPANY
▪ Purchased Infinity World’s 50% interest in CityCenter
and monetized the real estate of ARIA and Vdara for
$265 million of net cash proceeds SIMPLIFIES MGM STRUCTURE
& INVESTMENT CASE
▪ Sold real estate assets associated with
MGM Springfield to MGP for $400 million
BUSINESS DIVERSIFICATION
▪ Announced the acquisition of The Cosmopolitan
of Las Vegas for $1.625 billion
▪ Announced agreement to sell the operations of The BOLSTERS LIQUIDITY POSITION
Mirage in Las Vegas for $1.075 billion FOR DISCIPLINED CAPITAL
ALLOCATION TO MAXIMIZE
▪ Selected as Osaka’s integrated resort partner SHAREHOLDER VALUE
in Japan
▪ Announced offer to acquire 100% of the share capital
of LeoVegas for 6.0 billion SEK ($607 million)1
MGM RESORTS INTERNATIONAL 1 Based upon USD/SEK exchange rate of 9.814 11STRONG LIQUIDITY PROVIDES FINANCIAL FLEXIBILITY
CONSOLIDATED LIQUIDITY OVERVIEW AS OF 03/31/22
MGM Resorts MGM Resorts
($ in U.S. millions) (Ex. MGM China and MGP) MGM China MGP Consolidated
Cash and equivalents (Incl. restricted cash)1 $2,923 $288 $8 $3,219
Revolver availability $1,643 $1,259 $1,350 $4,252
Total liquidity $4,566 $1,547 $1,358 $7,471
Adjusted for recent transactions and near-term debt maturities2
MGP / VICI $4,400
The Cosmopolitan of Las Vegas ($1,625)
The Mirage $815
LeoVegas3 ($607)
Repayment of 2023 senior notes ($1,250)
Cash and equivalents $4,656
Total liquidity $6,299
1 Includes “restricted cash” held in an escrow account related to The Cosmopolitan of Las Vegas acquisition
2 Pending regulatory approvals and other customary closing conditions. The MGP/VICI and The Cosmopolitan of Las Vegas do not contemplate any fees and expenses,. The Mirage transaction
contemplates estimated taxes and fees
MGM RESORTS INTERNATIONAL 3 Pending regulatory approvals, the receipt of valid tenders of not less than 90% of LeoVegas shares, and customary closing conditions. Tender offer of SEK 6.0 billion, USD amount based upon
12
USD/SEK exchange rate of 9.814MLIFE IS NOW MGM REWARDS
LAUNCHED FEBRUARY 1 ST
NEW NEW NEW
PROGRAM WAYS TO EARN MARQUEE BENEFITS
• Simplified program rules grounded in member • Ability to earn rewards for hotel, dining • Waived Resort Fees for Gold+ members
research, solidifying industry-leading value and table games addressing top member pain-point
proposition
• Standardized tier credit earning rates
• Annual airfare credit for Platinum+ members to
• Strategic focus on enhanced benefits and across portfolio
drive incremental cross-regional visitation
personalization capabilities to target higher value
members • Customers earn rewards for
BetMGM activity driving omni-channel • Member loyalty celebrations via annual dining
• Becomes the consumer-facing brand of MGM
awareness and visitation credit and exclusive member events
Resorts reinforcing brand identity across portfolio
13ENHANCED MGM REWARDS IN-APP EXPERIENCE
FULLY RE-DESIGNED UI EXCLUSIVE DIGITAL CARD
Balance details, tier advancement EXPERIENCES Seamlessly show your status
progress, benefits and bookings via the MGM App
Enhanced In-App experience unlocked
via tier advancement
MGM RESORTS INTERNATIONAL 14• 1Q 2022 FINANCIAL RESULTS
TABLE OF • BETMGM
CONTENTS
• SUPPLEMENTAL
15BETMGM REMAINS THE CLEAR #1 OPERATOR IN
U.S. iGAMING…
OVERALL ESTIMATED NATIONAL MARKET SHARE IN U.S. iGAMING1
35%
30%
25%
COMPETITOR 1
20%
COMPETITOR 2
15%
10%
COMPETITOR 3
5%
21-Feb 21-Mar 21-Apr 21-May 21-Jun 21-Jul 21-Aug 21-Sep 21-Oct 21-Nov 21-Dec 22-Jan 22-Feb
MGM RESORTS INTERNATIONAL 1 Total
market share by iGaming GGR across all U.S., including jurisdictions where BetMGM is not currently active; Third party estimates used where operator-specific results are
unavailable. 16… AND #1 IN ITS ACTIVE MARKETS IN
U.S. SPORTS BETTING & iGAMING
OVERALL ESTIMATED NATIONAL MARKET SHARE IN U.S. SPORTS BETTING & iGAMING IN ACTIVE BETMGM MARKETS1
30%
25%
COMPETITOR 1
20%
COMPETITOR 2
15%
10%
5%
COMPETITOR 3
0%
21-Feb 21-Mar 21-Apr 21-May 21-Jun 21-Jul 21-Aug 21-Sep 21-Oct 21-Nov 21-Dec 22-Jan 22-Feb
1 Totalmarket share by GGR for retail, OSB and iGaming across all U.S., only for jurisdictions where BetMGM was active; Third party estimates used where operator-specific results are
MGM RESORTS INTERNATIONAL unavailable; results include internal estimates for the current month for AZ due to state reporting timing
17
1 In markets where BetMGM was operational during the stated time period. Based on BetMGM GGR as a percentage of state reported revenues in markets where BetMGM was
operational… WITH A LEADING POSITION NATIONWIDE IN
U.S. SPORTS BETTING & iGAMING
OVERALL ESTIMATED NATIONAL MARKET SHARE IN U.S. SPORTS BETTING & iGAMING1
35%
30%
25% COMPETITOR 1
COMPETITOR 2
20%
15%
10%
COMPETITOR 3
5%
21-Feb 21-Mar 21-Apr 21-May 21-Jun 21-Jul 21-Aug 21-Sep 21-Oct 21-Nov 21-Dec 22-Jan 22-Feb
1 Total market share by GGR for retail, OSB and iGaming across all U.S., including jurisdictions where BetMGM is not currently active; Third party estimates used where operator-specific
MGM RESORTS INTERNATIONAL results are unavailable; results include internal estimates for the current month for AZ due to state reporting timing
18
2 In markets where BetMGM was operational during the stated time period. Based on BetMGM GGR as a percentage of state reported revenues in markets where BetMGM was
operationalGROWING PRESENCE & BROAD-BASED MARKET ACCESS
23 ONTARIO
ME
WA
Current active VT
jurisdictions 1 MT ND NH
MN NY MA
OR
CT RI
ID WI MI
SD
29 WY
IA
PA
MD
NJ
NE OH DE
NV IL IN
WV D.C.
VA
Market UT
CA CO
access KS MO KY
NC
secured or
anticipated3 TN
SC
OK AR
AZ NM
GA
AL
41%
MS
TX LA
FL
Addressable
population2 Live
Market Access Secured or Anticipated2
MGM Property PR
MGM RESORTS INTERNATIONAL 1 Does
2 Appx.
not include OH and FL where BetMGM has launched online horse race betting
adult population in US and Canadian jurisdictions with access or expected access to BetMGM iGaming and / or sports betting products by end of Q1 2022. 19
3 Includes open license jurisdictions where BetMGM intends to apply for market access; includes Puerto RicoBETMGM WILL INTEGRATE SEAMLESSLY WITH MGM REWARDS
37+ million 100%
MGM Rewards 14% 39% of BetMGM players are
enrolled in
Members of new BetMGM of new MGM
players in 2021 were BEST LOYALTY PROGRAM Rewards enrollments MGM Rewards
active with MGM1 in 2021 were from
Global Gaming Awards in 6 of the last 7 years
BetMGM
MGM RESORTS INTERNATIONAL 1 MGM Rewards players who were active in the 12 months prior to acquisition
20• MGM CHINA PROPERTY DATA
SUPPLEMENTAL
• RECENT TRANSACTIONS / ANNOUNCEMENTS
21MGM CHINA FINANCIAL INFORMATION UNDER IFRS
Due to the time differences between Macau and the United States, this supplemental information is being provided on behalf
of MGM China for the benefit of MGM China investors
Three Months Ended
March 31
2022 2021
HK$'000 HK$'000
(unaudited) (unaudited)
Revenue
MGM Macau $1,180,049 $1,318,121
MGM Cotai $913,727 $980,703
Total Revenue $2,093,776 $2,298,824
Adjusted EBITDA1
MGM Macau $153,246 $169,973
MGM Cotai ($107,500) ($85,610)
Total Adjusted EBITDA $45,746 $84,363
1
Adjusted EBITDA is profit/loss before finance costs, income tax expense, depreciation and amortization, gain/loss on disposal/write-off of property and equipment and other assets, interest income, net foreign currency
MGM RESORTS INTERNATIONAL difference, share-based payments, pre-opening costs and corporate expenses which mainly include administrative expenses of the corporate office and license fee paid to a related company. Adjusted EBITDA is used by
management as the primary measure of the Group’s operating performance and to compare our operating performance with that of our competitors. Adjusted EBITDA should not be considered in isolation, construed as 22
an alternative to profit or operating profit as reported under IFRS or other combined operations or cash flow data, or interpreted as an alternative to cash flow as a measure of liquidity. Adjusted EBITDA presented in this
announcement may not be comparable to other similarly titled measures of other companies operating in the gaming or other business sectorsMGM CHINA FINANCIAL INFORMATION UNDER IFRS
Due to the time differences between Macau and the United States, this supplemental information is being provided on behalf
of MGM China for the benefit of MGM China investors
Three Months Ended
March 31
2022 2021
HK$'000 HK$'000
MGM MACAU (unaudited) (unaudited)
(in thousands, except for percentages and revenue per available room (“RevPAR”))
VIP Table Games Turnover 3,548,123 10,398,589
VIP Gross Table Games Win1 80,726 368,985
VIP Table Games Win Percentage 2.28% 3.55%
Average Daily Gross Win Per VIP Gaming Table 20.2 60.6
Main Floor Table Games Drop 5,185,281 4,672,214
Main Floor Gross Table Games Win1 1,069,371 980,622
Main Floor Table Games Win Percentage 20.60% 21.00%
Average Daily Gross Win Per Main Floor Gaming Table 51.9 50.5
Slot Machine Handle 2,881,131 3,527,202
1
Slot Machine Gross Win 131,991 142,756
Slot Hold Percentage 4.60% 4.00%
Average Daily Win Per Slot 1.7 2.4
Commissions, complimentaries and other incentives1 (244,094) (307,695)
Room Occupancy Rate 72.80% 81.10%
RevPAR 1,110 961
As of March 31
Gaming Units: 2022 2021
Tables2 288 287
3
Slot Machines 844 694
1
The total of “VIP gross table games win”, “main floor gross table games win” and “slot machine gross win” is different to the casino revenue because casino revenue is reported net of commissions and certain sales incentives
MGM RESORTS INTERNATIONAL including the allocation of casino revenue to hotel rooms, food and beverage and other revenue for services provided to casino customers on a complimentary basis
2 23
Permanent table count as of March 31, 2022 and 2021
3
Due to social distancing measures as a result of the COVID-19 pandemic, the slot machines were operated at a reduced capacityMGM CHINA FINANCIAL INFORMATION UNDER IFRS
Due to the time differences between Macau and the United States, this supplemental information is being provided on behalf
of MGM China for the benefit of MGM China investors
Three Months Ended
March 31
2022 2021
HK$'000 HK$'000
MGM COTAI (unaudited) (unaudited)
(in thousands, except for percentages and revenue per available room (“RevPAR”))
VIP Table Games Turnover 3,966,286 8,007,850
VIP Gross Table Games Win1 95,934 237,200
VIP Table Games Win Percentage 2.42% 2.96%
Average Daily Gross Win Per VIP Gaming Table 34.6 51.2
Main Floor Table Games Drop 3,371,758 3,427,066
Main Floor Gross Table Games Win1 798,165 803,010
Main Floor Table Games Win Percentage 23.70% 23.40%
Average Daily Gross Win Per Main Floor Gaming Table 41.5 41.6
Slot Machine Handle 2,725,712 3,992,534
Slot Machine Gross Win1 62,282 93,604
Slot Hold Percentage 2.30% 2.30%
Average Daily Win Per Slot 0.8 1.5
Commissions, complimentaries and other incentives1 (190,647) (289,225)
Room Occupancy Rate 38.90% 47.00%
RevPAR 539 469
As of March 31
Gaming Units: 2022 2021
Tables2 264 265
Slot Machines3 781 662
1
The total of “VIP gross table games win”, “main floor gross table games win” and “slot machine gross win” is different to the casino revenue because casino revenue is reported net of commissions and certain sales incentives
MGM RESORTS INTERNATIONAL including the allocation of casino revenue to hotel rooms, food and beverage and other revenue for services provided to casino customers on a complimentary basis.
2 24
Permanent table count as of March 31, 2022 and 2021
3
Due to social distancing measures as a result of the COVID-19 pandemic, the slot machines were operated at a reduced capacity.COMMENCED PUBLIC OFFER TO THE
SHAREHOLDERS OF SWEDEN-BASED
LEOVEGAS AB
On May 1, 2022, MGM Resorts International announced that it has commenced a recommended public tender offer for 100%
of the shares of LeoVegas AB at a price of SEK 61.00 in cash per share, equivalent to a total tender value of approximately
$607 million1. The acquisition will be financed with existing cash and is expected to be accretive to MGM Resorts’ earnings
and cash flow per share.
The purchase price represents a multiple of approximately 10 times EBITDA, inclusive of expected and highly achievable
operational synergies and identified revenue growth opportunities.
MGM Resort’s believes the acquisition of LeoVegas will provide a unique opportunity for the Company to create a scaled
global online gaming business with the following attributes:
Strategic Opportunities to Accelerate Growth and Product Offerings – LeoVegas’ online casino and sports betting capabilities
and strong customer base outside of the U.S. is expected to further expand MGM Resorts’ presence around the world.
Experienced Online Gaming Management Team and Superior Technology Capabilities – LeoVegas’ management team has
demonstrated the ability to develop a robust and scalable technology platform with advanced product offerings.
Commitment to Continued Profitable Growth – LeoVegas has operated profitably as a high-growth platform since 2014. From
2017 to 2021, LeoVegas’ revenues compounded annual growth rate was 16%, while maintaining strong profitability. MGM
Resorts scale, brands and expertise will allow the combined businesses to expand within existing gaming segments and
provide incremental opportunities to enter new areas.
LeoVegas generated EUR393 million in revenue and EUR48 million in Adjusted EBITDA during the last twelve months ended
March 31, 2022.2
The offer is subject to certain regulatory approvals, the receipt of valid tenders of not less than 90% of LeoVegas’ shares and
customary closing conditions. It is expected to be completed during the second half of fiscal year 2022.
1
Based upon USD/SEK exchange rate of 9.814
MGM RESORTS INTERNATIONAL 2
Definition of Adjusted EBITDA per LeoVegas’ financial reports. The amount has been calculated as the sum of the Adjusted EBITDA figures in LeoVegas’ financial reports for the 25
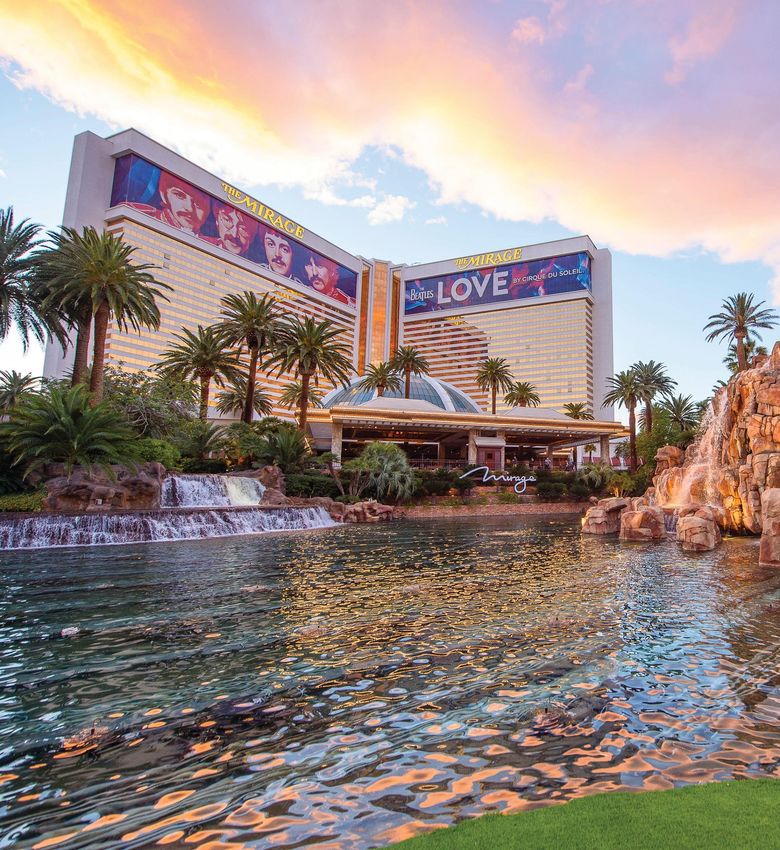
second, third and fourth quarters 2021 and the first quarter 2022. 25AGREEMENT TO SELL THE
OPERATIONS OF THE MIRAGE
IN LAS VEGAS
On December 13, 2021, MGM Resorts announced it has reached an
agreement to sell the operations of The Mirage Hotel & Casino ("The
Mirage") to Hard Rock International ("Hard Rock") for $1.075 billion in
cash, subject to customary working capital adjustments.
The purchase price represents an approximate 17 times multiple1.
For the twelve months ended December 31, 2019, The Mirage reported
Adjusted Property EBITDAR of $154 million.
At the closing of the transaction, MGM Resorts' master lease that currently
includes The Mirage property will be amended to reduce the annual rent
by $90 million. The Company expects net cash proceeds after taxes and
estimated fees to be approximately $815 million.
Under the terms of the agreement, MGM Resorts will retain The Mirage
name and brand, licensing it to Hard Rock royalty-free for a maximum
period of three years while it finalizes its plans to rebrand the property.
The transaction is expected to close in the second half of 2022, subject to
regulatory approvals and other customary closing conditions.
26
1 Based on 2019 Adjusted Property EBITDAR less $90 million rent 26MGM RESORTS SELECTED AS OSAKA’S INTEGRATED RESORT
PARTNER IN JAPAN
On September 28, 2021, MGM Resorts announced that MGM Japan, together with its joint venture partner ORIX, has been selected by Osaka as the region’s integrated resort partner.
Osaka's selection of MGM-ORIX is one of several steps in the licensing process following the 2018 passage of Japan's Integrated Resort Implementation Act. The next step is for MGM,
together with Osaka prefecture/city and ORIX, to submit an Area Development Plan to Japan's central government during the October 2021 to April 2022 application period. Integrated
resort licenses are expected to be issued by the central government in 2022. If selected to receive a license, MGM anticipates an opening date in the second half of the 2020s. 27INTEGRATED RESORT IN OSAKA, JAPAN
RENDERING
Note: See Supplemental section for additional information
28OSAKA YUMESHIMA INTEGRATED RESORT PROJECT
Proposed to be located along the water on Osaka's Yumeshima island, the project is
designed to help establish Japan as a top global tourist destination, with Osaka serving
as an internationally celebrated city for international business, travel and world-class
amenities and entertainment.
Resort Details Tourism & Economic Development
Hotel & Amenities: Initial investment: ~$10 billion
MGM Osaka, MGM Villas, and
MUSUBI Hotel (2,500 total guest Projected number of annual visitors:
rooms). ~20 million
Variety of dining and food & beverage
offerings, retail space, spa, fitness Projected number of employees: ~15,000
center, and banquet halls.
Promotion of tourism throughout Japan:
Meetings and Conventions: Support and facilitate the formation of a
~400,000 square feet of conference "Showcase of Japanese Tourism" plan for
facilities, with an additional ~330,000 the area surrounding the resort to
square feet of exhibition space, establish Osaka as a gateway for wider
including an Innovation Laboratory tourism in Japan. Facilities to include
Kansai Tourism Center, Garden Theater,
Entertainment: Japan Food Pavilion, and Kansai Art &
Yumeshima Theater (~3,500 seats) Culture Museum.
MGM RESORTS INTERNATIONAL 29You can also read