Macro Note 20 June 2019 - Landsbankinn

Page created by Terrence Hawkins
 
CONTINUE READING
Macro Note 20 June 2019 - Landsbankinn
Macro Note
20 June 2019
Macro note

 In real terms, the economy grew by 1.7% YOY in Q1. Domestic demand decreased by 2.8%,                      GDP growth and contribution of underlying components
 exports increased by 2.6% and imports decreased by 8.1%. The contribution of net foreign trade
                                                                                                            Source: Statistics Iceland
 to GDP growth was positive by 4.4%.
                                                                                                             15%
 Private consumption increased by 2.8% YOY in Q1. This is the smallest YOY increase since
 Q3 2014.
                                                                                                             10%
 Business sector investment decreased by 33.6% YOY in Q1. This decrease is mainly due to
 the sale of four airplanes by WOW air to Air Canada in January which enters national accounts as             5%

 disinvestment. Business sector investment excluding ships, aircrafts and heavy industry
                                                                                                              0%
 decreased by 5.4% YOY. This is the 5th consecutive quarter that business sector investment (ex.
 ships, aircrafts, heavy industry) decreases YOY.                                                            -5%
 We expect the economy to contract by 0.5% in real terms in 2019, but that this contraction will
                                                                                                            -10%
 be short-lived and that the economy will grow again in 2020.                                                              2011              2012              2013              2014        2015       2016      2017          2018     2019Q1

                                                                                                                      Private consumption                      Public consumption             Capital formation    Exports         Imports        GDP

Private consumption increased by 2.8% YOY in Q1.   Business sector investment excl. ships, aircrafts and   Most GDP forecasts assume a small contraction in 2019, but the downturn will be of short duration, and the economy will
This is the smallest increase YOY since Q3 2014.   heavy industry decreased by 5.4% YOY in Q1              grow again in 2020.
  Source: Statistics Iceland                        Source: Statistics Iceland                              Source: Statistics Iceland, CBI, IMF, Landsbankinn, Íslandsbanki, Arion Bank

                       12%                                               40%                                      4%
                                                                                                                  3%
                       10%
                                                                         30%
                                                                                                                  2%
                       8%
                                                     YOY volume change
   YOY volume change

                                                                         20%                                      1%
                       6%
                                                                                                                  0%
                       4%                                                10%
                                                                                                                -1%
                       2%
                                                                          0%                                    -2%
                       0%
                                                                                                                -3%
                                                                         -10%
                       -2%                                                                                                                    2019                                         2020                          2021
                       -4%                                               -20%                                         Landsbankinn (2019-05)                                   CBI (2019-05)                       Stat. Iceland (2019-02)
                                                                                                                      Arion Bank (2019-04)                                     Íslandsbanki (2019-06)              IMF (2019-04)

 20 June 2019 - Landsbankinn Economic Research
                                                                                                                                                                                                                                                        2
Macro note

  The current account surplus was ISK 35.1bn (1.2% of GDP) in Q1 2019 compared to an ISK                           The current account surplus was ISK 35.1bn (1.2% of GDP) in Q1 compared to an ISK 6.7bn (0.2% of GDP) surplus in
  6.7bn (0.2% of GDP) surplus in Q1 2018. The increase was mainly due to exports of old fishing                    Q1 2018.
                                                                                                                         Source: CBI
  vessels and airplanes (WOW air sold 4 jets to Air Canada in January). The surplus excluding
  ships and airplanes was ISK 12.5bn (0.4% of GDP).                                                                140
                                                                                                                   120
  WOW air ceased operations at the end of Q1 so the bankruptcy did not impact Q1 numbers.                          100
                                                                                                                   80
  No catch quota was issued for capelin this season and the outlook for next year is rather                        60
  bleak, as stock recruitment has been poor.                                                                       40
                                                                                                                   20
  We expect the current account surplus to be ISK 34.5bn (1.2% of GDP) in 2019, compared                            0
  with a surplus of ISK 81.5bn (2.9% of GDP) in 2018. The contraction is mainly due to the                         -20
  bankruptcy of WOW air and capelin catch failure.                                                                 -40
                                                                                                                   -60
  The net external position was positive by ISK 598bn (20% of GDP) at the end of Q1, an                            -80
                                                                                                                               Q1         Q2             Q3     Q4        Q1       Q2          Q3          Q4          Q1          Q2          Q3     Q4      Q1
  increase of ISK 270bn (9.2% of GDP) QOQ. The increase is mainly do to a rise in prices of
                                                                                                                                                  2016                                  2017                                            2018                 2019
  foreign securities and a deprecation of the króna.
                                                                                                                            Goods account balance               Service account balance             Primary income                 Secondary income        Current account

The net external position was positive by ISK 276 bn (9.9% of GDP) at year-end 2018                                Exports of airplanes and ships amounted to ISK                                   Capelin exports where ISK 17.8bn last year. No catch
                                                                                                                   22.6bn in Q1.                                                                    quota was issued for this season.
Source: CBI, Statistics Iceland                                                                                      Source: Statistics Iceland                                                       Spurce: Statistics Iceland
                                                                                                                                                                                                      40
                                                                                                                    25
           1.000                                                                                           50%                                                                                        35

                                                                                                                    20                                                                                30
               0                                                                                           0%
                                                                                                                                                                                                      25
                                                                                                                    15
           -1.000                                                                                          -50%                                                                                       20
  ISK bn

                                                                                                                    10                                                                                15
           -2.000                                                                                          -100%
                                                                                                                                                                                                      10
                                                                                                                     5
           -3.000                                                                                          -150%                                                                                       5

                                                                                                                     0                                                                                 0
           -4.000                                                                                          -200%         2010          2012              2014    2016           2018
                    2005          2007   2009        2011            2013            2015    2017   2019
                                                                                                                                         Airplanes                      Ships
                                           net IIP          Percentage af GDP (right axis)

  20 June 2019 - Landsbankinn Economic Research
                                                                                                                                                                                                                                                                             3
Macro note

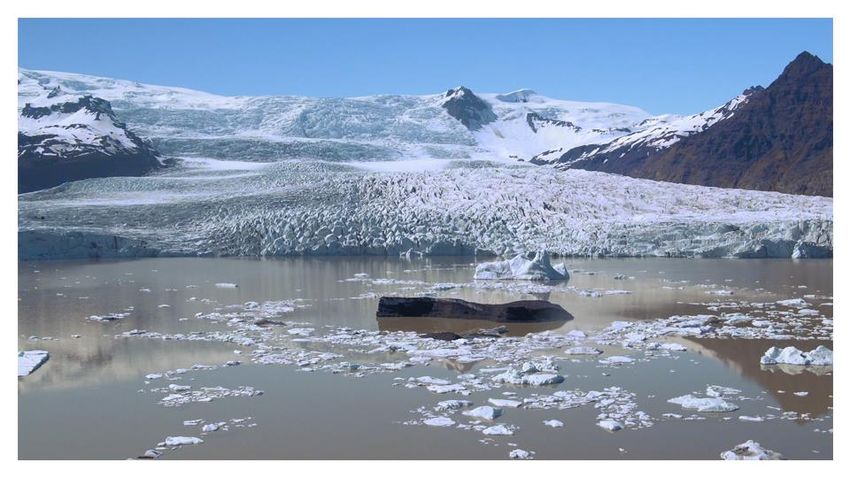
Inflation was 3.6% in May, up from 3.3% in April. We expect the CPI to increase by 0.4% MOM                                 Inflation expectations appear to have peaked in Q4 2018, falling steadily since.

in June, bringing the headline number to 3.4%. The MOM increase is mainly due to seasonal                                   Source: Statistics Iceland, Landsbankinn Economic Research forecast
changes in international airfares.                                                                                             5%

Inflation expectations appear to have peaked in Q4 2018, falling steadily since. The break-even
inflation rate is currently at 3% after going as high as 4.5% in October 2018.                                                 4%

The Monetary Policy Committee (MPC) lowered policy rates by 0.5 percentage points at its
                                                                                                                               3%
meeting in May. All five committee members voted in favour of this change. We expect the MPC
to lower policy rates a further 0,25 percentage points next week.
                                                                                                                               2%

                                                                                                                               1%

                                                                                                                               0%
                                                                                                                                 2017                                                             2018                                                    2019

                                                                                                                                                    Break even inflation rate                        Market agents (after 12M)                       Businesses (after 12M)

  Inflation was 3.6% in May.                                   Headline inflation and CPI exluding housing are              The main components in inflation.                                                80% of subcomponents in the CPI have increased the
                                                               converging.                                                                                                                                   last 12 months.
   Spurce: Statistics Iceland                                   Spurce: Statistics Iceland                                                                                                                     Spurce: Statistics Iceland
                                                                5%
   5%                                                                                                                         5                                                                                100%
                                                                4%
                                                                3%                                                            4
   4%                                                                                                                         3                                                                                 80%
                                                                2%
                                                                                                                              2
                                                                1%
                                                                                                                              1                                                                                 60%
   3%                                                           0%
                                                                                                                              0
                                                               -1%                                                           -1                                                                                 40%
   2%                                                          -2%                                                           -2
                                                               -3%                                                           -3                                                                                 20%
   1%                                                          -4%                                                           -4
                                                                  2017                       2018           2019                  2017                      2018                        2019                      0%
                                                                       Consumer Price Index         CPI excluding Housing                Imported goods                      Petrol                                 2013         2014       2015   2016    2017   2018   2019
   0%                                                                                                                                    Housing                             Domestic goods
     2013        2014       2015   2016   2017   2018   2019                                                                             Services                            Other components                          Increased               Unchanged          Decreased

20 June 2019 - Landsbankinn Economic Research
                                                                                                                                                                                                                                                                                4
The contents and form of this document were produced by employees of Landsbankinn Economic Research (hagfraedideild@landsbankinn.is) and are based on information available to the public
when the analysis was compiled. Assessment of this information reflects the views of Economic Research’s employees on the analysis date, which may change without notice.

Neither Landsbankinn hf. nor its personnel can be held responsible for transactions based on the information and opinions expressed here as the content is not provided as personal advice on
individual transactions.

Attention should be drawn to the fact that Landsbankinn hf. may, at any time, have direct or indirect interests at stake either on its own behalf or through its subsidiaries or customers, for
instance as an investor, creditor or service provider. Nonetheless, all analyses are prepared independently by Landsbankinn Economic Research and in accordance with the Bank’s rules on
separation of activities accessible on the Landsbankinn website.
You can also read