From plague to coronavirus: On the value of ship traffic data for epidemic modeling
←
→
Page content transcription
If your browser does not render page correctly, please read the page content below
From plague to coronavirus:
                                                       On the value of ship traffic data for epidemic modeling
                                                                    Katherine Hoffmann Pham1,2 and Miguel Luengo-Oroz1
                                                              1
                                                                  United Nations Global Pulse, 2 NYU Stern School of Business
                                                                    katherine@unglobalpulse.org, miguel@unglobalpulse.org

                                        Abstract
arXiv:2003.02253v1 [cs.CY] 4 Mar 2020

                                                                                                            has been used in a diverse range of applications, includ-
                                                                                                            ing monitoring for port security, detecting fishing behav-
                                        In addition to moving people and goods, ships can spread            ior, and studying search and rescue operations involving
                                        disease. Ship traffic may complement air traffic as a               migrant and refugee boats [4, 5, 6].
                                        source of import risk, and cruise ships – with large                   Currently, a standard approach to calculating disease
                                        passenger volumes and multiple stops – are potential                import risk at the international level is epidemic mod-
                                        hotspots, in particular for diseases with long incubation           eling using flight network data. However, vessels can
                                        periods. Vessel trajectory data from ship Automatic                 also be global carriers for infected individuals and dis-
                                        Identification Systems (AIS) is available online and it             ease vectors. For example, the “Black Death” plague
                                        is possible to extract and analyze this data. We illus-             outbreak in 1347, which killed an estimated 25 million
                                        trate this in the case of the current coronavirus epidemic,         Europeans, is believed to have been spread throughout
                                        in which hundreds of infected individuals have traveled             Europe by merchant ships, possibly by rats on board and
                                        in ships captured in the AIS dataset. This real time                their parasites [7]. Similarly, the travel of infected civil-
                                        and historical data should be included in epidemiologi-             ians and soldiers along shipping routes is credited with
                                        cal models of disease to inform the corresponding oper-             helping to spread the catastrophic 1918 Spanish flu epi-
                                        ational response.                                                   demic, which killed an estimated 20 - 40 million people
                                                                                                            worldwide [8].
                                                                                                               Although passenger ships have largely been replaced
                                        1     Introduction                                                  by airlines in the modern day, ships still represent a large
                                                                                                            amount of traffic in island nations, and continue to play
                                        Faced with a global epidemic, there is a need to quickly            an important role in international trade. Although ship
                                        estimate potential routes for disease transmission in or-           traffic patterns have transmission potentials that are dis-
                                        der to prepare a public health response. In recent years,           tinct from airline traffic, they are not typically taken into
                                        the growing availability of big data sources has facilitated        account in current epidemic models. Below, we discuss
                                        the modeling of these potential routes. For example, pre-           two case studies in which shipping traffic is relevant to
                                        vious studies have used mobile phone records, commut-               the study of disease transmission.
                                        ing flow data, and airline flight matrices to identify possi-
                                        ble disease hotspots, predict contagion patterns, and/or
                                        estimate import risk [1, 2]. In this research, we high-             2     Analysis
                                        light another dataset – Automatic Identification System
                                        (AIS) data containing historical and real-time ship tra-            2.1    The 2017 Madagascar plague out-
                                        jectories – as a complementary source of information on                    break
                                        possible transmission routes.
                                           AIS data forms a global database of maritime traffic.            In Fall 2017 Madagascar was struck by a plague epi-
                                        All passenger ships, international ships over 300 tons,             demic, affecting an estimated 2,348 individuals and re-
                                        and cargo ships over 500 tons must be equipped with                 sulting in 202 deaths [9]. Since Madagascar is an island
                                        an AIS transceiver, which reports dynamic information               nation, we examined travel patterns in the AIS data
                                        about the ship’s position – such as its location, speed,            to estimate possible transmission routes through com-
                                        and course over ground – as well as static information              mercial and cruise ships. Our methodology consisted of
                                        such as the ship’s identifiers, vessel type, and flag [3].          gathering information from ports and cruise ships and
                                        This data is collected by a network of land- and satellite-         constructing an origin-destination matrix that captured
                                        based receivers and subsequently aggregated by third-               all trips between ports inside Madagascar (∼ 40% of ob-
                                        party providers, which redistribute the data and/or ren-            served trips) and outside Madagascar (∼ 60%).
                                        der it for viewing in a graphical user interface. AIS data             From 26 September to 26 October 2017 we identified

                                                                                                        1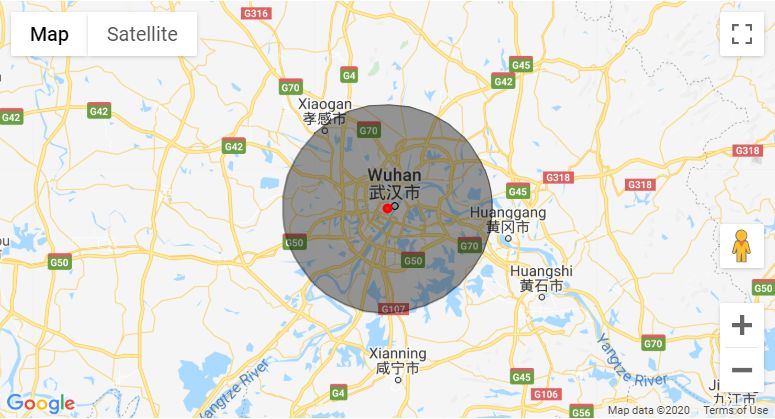
(a) Origin-destination matrix for ships visiting Wuhan from       (b) The tracks of the cruise ship MS Westerdam from 1st
  the 8th to 21st January 2020. Data source: UN Global              January to 19th February 2020. Data source: UN Global
  Platform AIS Database.                                            Platform AIS Database. Basemap source: Stamen Design
                                                                    and OpenStreetMap contributors.

                                       Figure 1: Sample applications of AIS data

126 vessel departures from the main ports in Madagas-                    uary 2020. All told, we identified 1,107 ships con-
car, including cargo vessels, tankers, tugs, and fishing                 necting 34 different ports across China and Japan
vessels. Interestingly from an epidemic risk perspec-                    (see Figure 1a).
tive, long-range trips included destinations as diverse as
Mayotte, Mauritius, Reunion, Mozambique, France, and
China. A further analysis of cruise traffic specifically              • Spain’s first case of the coronavirus was identified
found 6 cruises that were scheduled to arrive in Madagas-               in the Canary Islands, in a traveler who arrived
car over the course of November 2017. Generally, these                  in La Gomera by ferry from Tenerife [10, 11]. In
cruises were scheduled to stop in more than one port, and               addition to the islands’ air traffic connections, AIS
the number of passengers and crew members on board                      data analysis for 8 - 21 January 2020 showed that
was over 1,200 on average. These cruises therefore rep-                 ships passing by the Canary Islands were associated
resent high-volume points of human contact which in                     with ports in 56 different countries, including fre-
this case would have subsequently visited South Africa,                 quent travel to peninsular Spain, Morocco, Senegal,
Mauritius, Mozambique, Reunion, Seychelles, and Italy.                  Gibraltar, the UK, the Netherlands, and Portugal.

2.2    The 2020 coronavirus epidemic
                                                                      • The Diamond Princess cruise ship was quarantined
Given the long incubation period of the disease and the                 off the coast of Japan with approximately 3,700 in-
possibility of mild, asymptomatic cases, maritime traf-                 dividuals on board, and 621 people on the ship were
fic has played a significant role in the current spread                 ultimately infected [12]. A second cruise ship, the
of the coronavirus epidemic. In particular, experience                  MS Westerdam, was repeatedly denied entry at port
has shown that large cruise ships can become important                  for fear that there were infected individuals among
hotspots. Below are three scenarios in which AIS infor-                 the 2,257 people onboard, and a passenger tested
mation could be used to support further investigations                  positive for coronavirus only after the ship docked in
and risk modeling.                                                      Cambodia, leading to fears that other infected but
                                                                        asymptomatic individuals could spread new cases
  • Wuhan, the city at the center of the outbreak, is lo-               (although the passenger has since tested negative)
    cated at the junction of the Yangtze and Han rivers.                [13, 14]. The locations of both ships are available in
    Therefore, shipping traffic is one pathway by which                 real time and their travel paths can be reconstructed
    disease might spread out of the city. Using AIS data                using historical AIS traces (see Figure 1b). Similar
    from Exact Earth, we obtained all traffic from ships                data on positions, historical travel paths, maximum
    that passed within 50km of Wuhan with a speed of                    capacity, and expected ports of arrival could also be
    less than 2 knots for the period between 8 - 21 Jan-                extracted for other cruise ships in the region.

                                                                2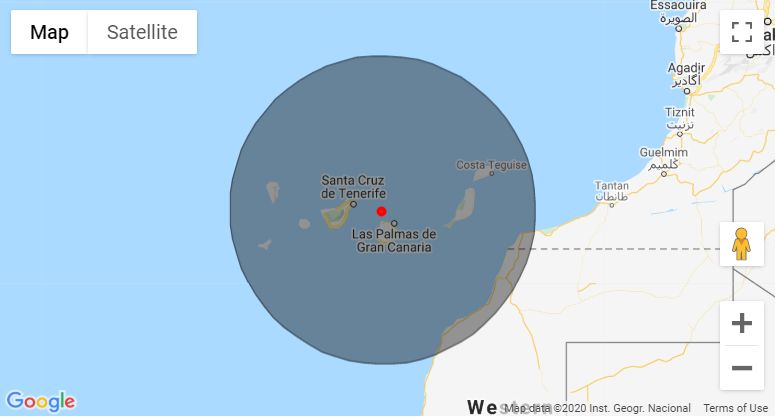
3    Discussion                                                        tifying the Impact of Human Mobility on Malaria,”
                                                                       Science, vol. 338, pp. 267–270, Oct. 2012.
Ships represent a source of epidemic risk which might be
particularly relevant in port cities and island nations or          [3] Raymarine,    “AIS - The Ultimate Guide
for diseases with long incubation periods. Our analysis of              to     Automatic    Identification    Systems.”
data from Madagascar and the Canary Islands illustrates                 http://www.raymarine.com/view/blog/
that island shipping traffic has a broad reach (in these                news/details/?ID=15032385552, Sept. 2016.
cases, reaching three or more continents within a month)            [4] B. J. Rhodes, N. A. Bomberger, M. Seibert, and
and may potentially carry high volumes of passengers.                   A. M. Waxman, “Maritime situation monitoring
Even a landlocked city such as Wuhan saw a considerable                 and awareness using learning mechanisms,” in MIL-
volume of river traffic in the two-week period prior to                 COM 2005 - 2005 IEEE Military Communications
quarantine.                                                             Conference, pp. 646–652 Vol. 1, Oct. 2005.
   AIS data makes it possible to visualize individual ship
trajectories, along with additional ship information such           [5] F. Natale, M. Gibin, A. Alessandrini, M. Vespe, and
as vessel type and size. It is simple to filter out, for in-            A. Paulrud, “Mapping Fishing Effort through AIS
stance, passenger ships that might have stopped in cities               Data,” PLOS ONE, vol. 10, June 2015.
with high risk, as well as to account for their expected
                                                                    [6] K. Hoffmann Pham, J. Boy, and M. Luengo-Oroz,
arrival times in future ports. The ability to acquire such
                                                                        “Data Fusion to Describe and Quantify Search and
information in real time might be of critical relevance for
                                                                        Rescue Operations in the Mediterranean Sea,” in
operational responses to disease outbreaks.
                                                                        IEEE 5th International Conference on Data Sci-
   The approach described in this communication repre-
                                                                        ence and Advanced Analytics (DSAA), pp. 514–523,
sents a first step towards estimating the potential role
                                                                        2018.
of vessel traffic in global disease spread. We assert that
ship origin-destination matrices can offer insights into            [7] Encyclopaedia   Britannica,   “Black   Death.”
travel routes which may be overlooked when focusing on                  https://www.britannica.com/event/Black-Death,
flight path data alone, and should be considered when                   Oct. 2019.
modeling the spread of disease in port cities and island
nations. The availability of real-time and historical data          [8] M. Billings and R. Siegel, “The 1918 Influenza
from commercial providers makes analysis of AIS data                    Pandemic.” https://virus.stanford.edu/uda/, Feb.
feasible. Vessel trajectory data can be enhanced with                   2005.
other sources of data on the number of passengers and
                                                                    [9] World Health Organization, “Plague - Madagas-
crew aboard tourist or commercial ships. Future work
                                                                        car.” http://www.who.int/csr/don/27-november-
should explore how adding shipping traffic to existing
                                                                        2017-plague-madagascar/en/, Nov. 2017.
flight network data changes the outcome of disease sim-
ulations and risk estimates.                                       [10] R. Paniagua, “En unas dos semanas el coronavirus
                                                                        se trasladó desde Wuhan hasta La Gomera,” El
                                                                        Mundo, Feb. 2020.
Acknowledgements
                                                                   [11] Reuters, “UPDATE 1-Spain confirms first case of
We thank Daniela Perrotta for her contributions to the                  coronavirus - Health Ministry,” Reuters, Jan. 2020.
analysis of the Madagascar data. We thank the UN
                                                                   [12] BBC News, “Growing criticism over Japan cruise
Global Platform for access to its AIS database [15].
                                                                        quarantine,” BBC News, Feb. 2020.
United Nations Global Pulse is supported by the Gov-
ernments of the Netherlands, Sweden, and Germany and               [13] BBC News, “How did Cambodia’s cruise ship wel-
by the William and Flora Hewlett Foundation.                            come go wrong?,” BBC News, Feb. 2020.
                                                                   [14] J. Ducharme, “An American Westerdam Cruise
References                                                              Ship Passenger Does Not Have COVID-19,” Time,
                                                                        Feb. 2020.
 [1] W. V. den Broeck, C. Gioannini, B. Gonçalves,
                                                                   [15] UN Statistics Division, “Global AIS Data Feed.”
     M. Quaggiotto, V. Colizza, and A. Vespignani, “The
                                                                        https://marketplace.officialstatistics.org/datasets/ais-
     GLEaMviz computational tool, a publicly available
                                                                        data, 2020.
     software to explore realistic epidemic spreading sce-
     narios at the global scale,” BMC Infectious Dis-              [16] exactEarth, “AIS vessel tracking — maritime ship
     eases, vol. 11, Feb. 2011.                                         monitoring.” http://www.exactearth.com/, 2020.
 [2] A. Wesolowski, N. Eagle, A. J. Tatem, D. L. Smith,            [17] FleetMon, “Live AIS Vessel Tracker with Ship and
     A. M. Noor, R. W. Snow, and C. O. Buckee, “Quan-                   Port Database.” https://www.fleetmon.com/, 2020.

                                                               3
[18] MarineTraffic, “Global Ship Tracking Intelligence.”
https://www.marinetraffic.com/, 2020.
[19] ORBCOMM, “IoT and M2M Tracking, Mon-
itoring and Control Solutions - Satellite,
Cellular and Dual-Mode Communications.”
https://www.orbcomm.com/, 2020.
[20] VesselFinder, “Free AIS Ship Tracking of Marine
Traffic.” https://www.vesselfinder.com, 2020.
[21] VesselTracker, “Terrestrial & Satel-
lite AIS Tracking Service in Realtime.”
https://www.vesseltracker.com/, 2020.
[22] All About AIS, “FAQs.”
http://www.allaboutais.com/index.php/en/faqs,
2020.
[23] National Geospatial-Intelligence Agency,
“Nautical Publications - World Port Index.”
https://msi.nga.mil/Publications/WPI, 2019.
4Appendix: Data and Methods
AIS data
Popular AIS data providers include ExactEarth, Fleet-
Mon, MarineTraffic, OrbComm, VesselFinder, and Ves-
selTracker [16, 17, 18, 19, 20, 21]. The frequency of
AIS readings varies, with some providers offering bet-
ter resolution than others; in our experience, we have
found that this resolution can range from approximately
one reading every two minutes to one reading per hour.
Furthermore, providers differ in their access to land- or
satellite-based receivers; typically, land-based receivers
detect ships within 15 - 20 (and up to 60) nautical miles
away [22], whereas satellite-based receivers are used to
monitor ships further out to sea.
Selecting AIS data for OD matrices
We first queried the AIS database to find the Maritime
Mobile Service Identities (MMSI) of all ships which had
passed within 50km of Wuhan, or 300km of the Canary
Islands, at a speed of less than 2 knots during our period
of interest (8 - 21 January 2020). Examples of observed
traffic in the areas of interest are shown in Figure 2, while
the regions used for the query are shown in Figure 3.
Given the resulting list of ship MMSIs, we then extracted
all trajectory points for these ships during the period
from 8 - 21 January, again retaining only points for which
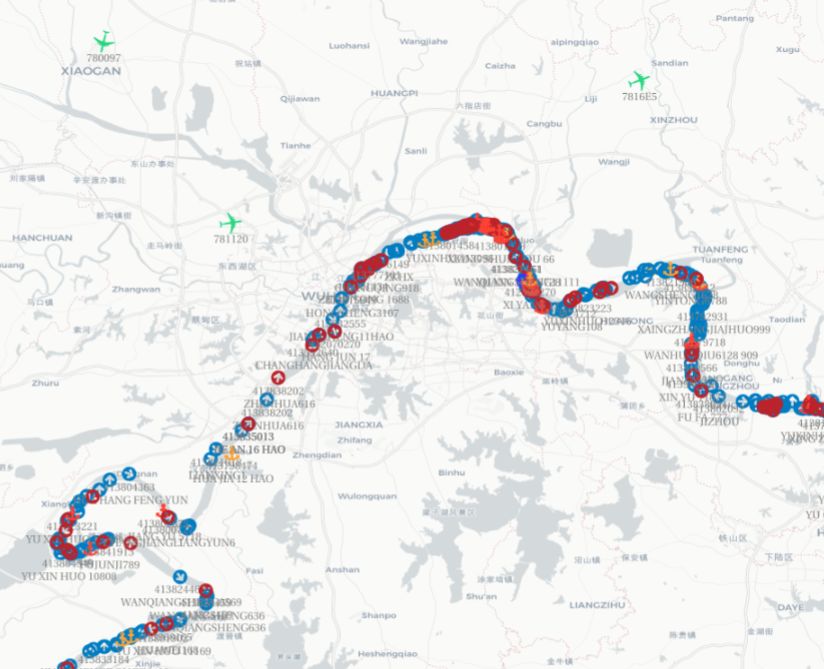
the ships recorded a speed of less than 2 knots. Figure 2: Snapshots of real-time plane and flight traffic
from Wuhan (above) and the Canary islands (below) in
February 2020. Source: UN Global Platform.
Filtering AIS data for OD matrices
We reduced the size of the AIS dataset using several cri-
teria. First, we removed ships with invalid MMSI, drop-
ping MMSI which were less than 9 digits in length and
MMSI which were associated with multiple different ves-
sel types (a sign that more than one ship might be using
the same MMSI). Next, we removed duplicate readings;
readings after which ships had moved less than 0.001 de-
grees in the vertical and horizontal directions from the
previous reading; and ships whose position jumped at a
rate of more than 1.7 degrees per hour (approximately
100 knots) in latitude or longitude between subsequent
position reports (another sign that more than one ship
might be using the same MMSI).
Building OD matrices from AIS data
Using the list of ports supplied by the World Port Index
[23], we next restricted our dataset to position readings
which fell within approximately 50km of a port, and as-
sociated each of the remaining points with its nearest
port. We then retrieved the port associated with the
ship’s previous location reading, dropping any connec- Figure 3: The radii used to select ships visiting Wuhan
tions between a port and itself. Finally, we aggregated (above) and the Canary Islands (below). Basemap
the port-to-port connections of individual ships to yield source: Google Maps.
an origin-destination (OD) matrix.
5You can also read