Gas Prices of America: The Machine-Augmented Crowd-Sourcing Era - Conference on Computer and Robot ...
←
→
Page content transcription
If your browser does not render page correctly, please read the page content below
2020 17th Conference on Computer and Robot Vision (CRV)

                                          Gas Prices of America:
                                The Machine-Augmented Crowd-Sourcing Era

                                     Kevin Dick, François Charih, Jimmy Woo, James R. Green
                                     Systems & Computer Engineering, Institute of Data Science
                                               Carleton University, Ottawa, Canada
                                           Email: {kevin.dick, james.green}@carleton.ca

     Abstract—Google Street View (GSV) comprises the largest                  comprises the most comprehensive source of street-level
  collection of vehicle-based imagery of the natural environment.             imagery (i.e. streetscapes) in the world, lending to its utility
  With high spatial resolution, GSV has been widely adopted                   to investigate and understand the natural environment.
  to study the natural environment despite its relatively low
  temporal resolution (i.e. limited time-series imagery available                Unfortunately, GSV is limited in its temporal resolution;
  at a given location). However, vehicular-based imagery is                   a given spatial location is typically only photographed
  poised to grow dramatically with the prophesied circulation                 once every couple of years thereby reducing its utility for
  of fleets of highly instrumented autonomous vehicles (AVs),                  meaningful longitudinal analyses. Such analyses would be
  producing high spatio-temporal resolution imagery of urban                  tremendously valuable for capturing time-varying events
  environments. As with GSV, leveraging these data presents the
  opportunity to extract information about the lived environment,             observable from the street-level perspective. At present,
  while their high temporal resolution enables the study and an-              satellite photography offers both high spatial and temporal
  notation of time-varying phenomena. For example, circulating                resolution imagery; however it is limited to the bird’s eye
  AVs will often capture location-coded images of gas stations.               view, limiting it’s utility in observing phenomena more
  With a suitable CV system, one could extract the advertised                 readily visible to the first-person perspective. To increase
  numerical gas prices and automatically update crowd-sourced
  applications, such as GasBuddy. To this end, we assemble and                the temporal resolution of GSV-like imagery, the regular
  release the Gas Prices of America (GPA) dataset, a large-scale,             circulation of camera-laden vehicles is required.
  benchmark dataset of advertised gas prices from GSV imagery
  across the 49 mainland United States of America. Comprising                 A. Automating Crowd-Sourcing using Computer Vision
  2,048 high quality annotated images, the GPA dataset enables                   With the prophesied deployment of fleets of autonomous
  the development and evaluation of CV models for gas price
  extraction from complex urban scenes. More generally, this                  vehicles (AVs), we can expect a tremendous influx of such
  dataset provides a challenging benchmark against which CV                   vehicle-based imagery. While these visual data have primary
  models can be evaluated for multi-number, multi-digit recogni-              use for vehicular navigation, they have additional potential
  tion tasks in the wild. For the digit-level classification task, the         secondary use for investigating streetscape environments.
  YOLO digit detection model trained on the Street View House                 More specifically, the collection, aggregation, and analysis
  Numbers dataset performed comparably to a random classifier,
  highlighting the difficulty of this task. Conversely, for the full-          of these data hold considerable potential to extract specific
  sign segmentation task, transfer learning of a DeepLabV3                    information in (near) real-time from the natural environment
  ResNet101 model achieved a test F1 performance of 0.7125,                   in an automated way. To date, the current most reliable
  following 100 epochs. Highly accurate models, when integrated               source of (near) real-time street-level events relies on crowd-
  with AV platforms, will represent the first opportunity to                   sourced information wherein human annotators will update
  automatically update the traditionally human crowd-sourced
  GasBuddy dataset, heralding an era of machine-augmented                     a distributed repository with the most current information.
  crowd-sourcing. The dataset is available online at cu-bic.ca/gpa            Popular examples include the Waze app [5], for traffic-
  and at doi.org/10.5683/SP2/KQ6VNG. Accompanying code can                    related events, and the GasBuddy app, for gas price data.
  be found at github.com/GreenCUBIC/Gas-Prices-of-America.                    Such human crowd-sourcing initiatives depends on the gen-
     Keywords-dataset preparation; remote sensing; character                  erosity of individual data contributors and is further limited
  recognition                                                                 by restrictions on the use of mobile devices whilst driving.
                                                                                 Machine-augmented crowd-sourcing of environmental
                        I. I NTRODUCTION                                      data will first require the development of accurate ma-
     The last decade has seen the widespread adoption of                      chine learning (ML) and computer vision (CV) models,
  Google Street View (GSV) imagery in diverse applications                    suitable for real-time deployment. Generating large-scale
  studying the natural environment. Recent examples include                   and annotated datasets comprising streetscape imagery cap-
  its use in health research [1], neighbourhood auditing [2],                 turing these events would be valuable for the training and
  mapping air pollution [3], and assessing urban greenery                     evaluation of such algorithms (e.g. Convolutional Neural
  [4]. With high spatial resolution and global coverage, GSV                  Networks; CNNs). Resultant models capable of extract-

978-1-7281-9891-0/20/$31.00 ©2020 IEEE                                  158
DOI 10.1109/CRV50864.2020.00029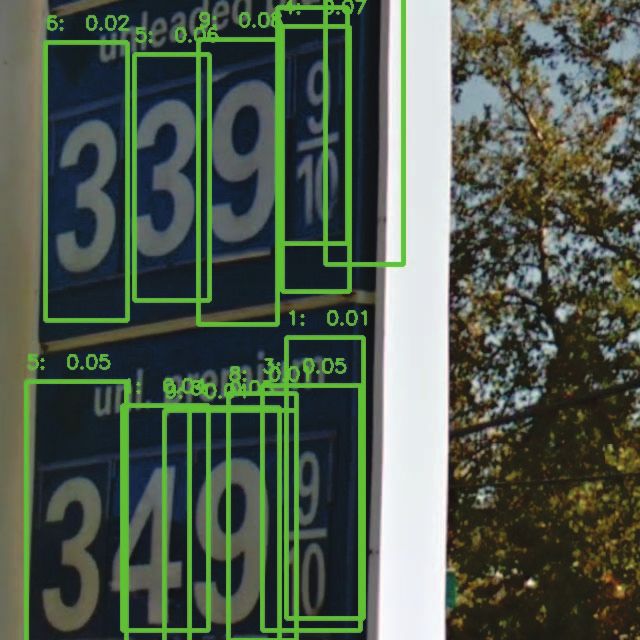
PNG
                                              +
                                                                                                              +
                                                                      Geocoding &
Seed Location Source                 Gas Station                   Seed Augmentation                Price Localization           High-Quality
 allgasstations.com                Address Scrapper                address(lat,lon)          (lat,lon) .PNG        Image Dataset

Figure 1. Overview of the Image Acquisition Pipeline. The published street addresses of known gas stations in the USA were scraped from AGS using a
Selenium-based crawler and were geocoded to (lat,lon) pairs. The Google Places API was used to refine these coarse-grained seed addresses by searching
for known stations within a 2km radius. For each refined seed, AMT Workers localized, segmented, and transcribed the advertised gas prices.

ing information from the natural environment with high                         as the Street View House Number (SVHN) dataset [7],
performance will rival their human annotating counterpart,                     have helped address some of these issues by serving as a
signaling the beginning of a machine-augmented crowd-                          benchmark for development and evaluation of CV models.
sourcing era. Appositely, what reason has a human annotator                    Whereas the MNIST dataset comprises a collection of 28 ×
to update a crowd-sourced app if their vehicle-integrated CV                   28 grey-scaled bitmaps, each depicting a single handwritten
model does so automatically with equivalent (or possibly                       digit, the SVHN dataset represents multiple characters per
superior) accuracy?                                                            image which, when combined, form a single, sequential,
B. Benchmark Dataset for ’Prices in the Wild’                                  multi-digit house number sourced from Google Street View
                                                                               imagery. While the latter is useful to extract multi-digit
   In this work, we focus on the task of automating the ex-                    values “in the wild”, it does not address the challenge of
traction of advertised gas prices of fueling stations through-                 distinguishing characters among several multi-digit numbers.
out the United States of America. To this end, a large-                        The availability of such a dataset would function as a
scale dataset of streetscape imagery of advertised gas prices                  benchmark to evaluate models on their ability to accurately
is required. Beyond its utility in developing automated                        distinguish between multiple numerical values within natural
gas price detection models, the collection, annotation, and                    environments. In this work we introduce the Gas Prices of
publication of such a dataset promises to be a boon to                         America (GPA) dataset, a large-scale collection of advertised
the CV research community as a resource for developing                         gas prices from GSV imagery throughout the United States
and benchmarking methods for the extraction of multi-                          of America. The dataset is available online at cu-bic.ca/gpa
digit, and multi-number information from natural images.                       and in this DataVerse Repository.
Numerous large-scale & high-quality image datasets are
made freely available to the ML community as benchmarks                                                 II. M ETHODS
to evaluate the effectiveness of CV models. One class of
these datasets comprise discrete-type character/digit repre-                      A conceptual overview of the data acquisition pipeline
sentations amenable to classification tasks. Notable examples                   is depicted in Figure 1. The collection of GSV imagery
include the 1998 MNIST dataset of hand-written digits                          depicting advertised gas prices first required a set of “seed”
(one digit per image) [6] and the 2011 Street View House                       coordinates: latitude and longitude (lat,lon) pairs corre-
Numbers (SVHN) dataset (several digits per image) [7].                         sponding to locations sufficiently proximal to known gas
However, to the authors’ knowledge, no benchmark of multi-                     stations to facilitate the localization of the advertised price.
number, multi-digit values in the natural environment exists.                  To restrict our search to locations with a higher density of
   Using CV to read textual information from images has                        gas stations, we identified a database with listed addresses as
been the focus of extensive research in the last decade.                       opposed to performing a systematic grid search, exemplified
Under highly constrained conditions, character recognition                     in [8]. While a systematic grid search would constitute a
is effectively a solved problem (e.g. classification of hand-                   geographically unbiased search strategy, the parameteriza-
written digits as with the MNIST dataset, optical character                    tion of such a search with a dense grid (e.g. very short
recognition of printed documents); however, the recognition                    distance between search points) would result in an exorbitant
of textual characters in unconstrained natural scenes is more                  number of sample points, the majority of which are unlikely
challenging. However, images of text “in the wild” introduce                   to be proximal to a gas station resulting in a high external
a gamut of challenges such as illumination, orientation,                       complexity (first introduced in [8]) and wasteful APIs calls.
blurring, obfuscation, distortion, and scaling, thereby making                    We refined our search strategy by considering a number
the task commensurately more complex. Moreover, combi-                         of publicly available websites that list addresses for known
nations of characters, variations in font faces, and differing                 gas stations throughout the United States. Two notable
styles each exacerbate this problem. Previous datasets, such                   sources are All Gas Stations (AGS; allgasstations.com) and

                                                                         159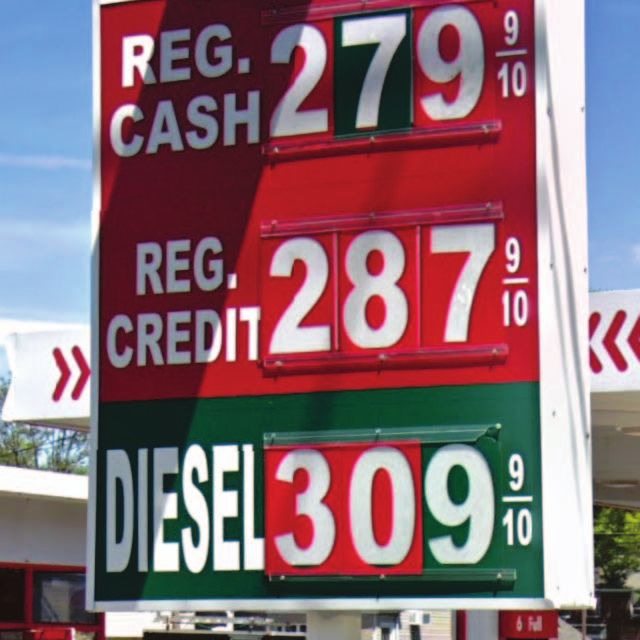
the popular gas price crowd-sourcing platform, GasBuddy
(GB; gasbuddy.com). Neither of these sources supports a
1
machine-friendly interface to access location data. Fortu-
4 2 } 3
nately, the AGS website implemented a navigable hierar-
chical structure, where i ∈ {1, 2, . . . , 50} | ⟨state-code-
i⟩ ∈ {‘AL’,‘AK’,. . .,‘WY’}:
5
allgasstations.com/
/
.
. 6
.
.
.
.
7
.
.
.
8 9 10 11 12
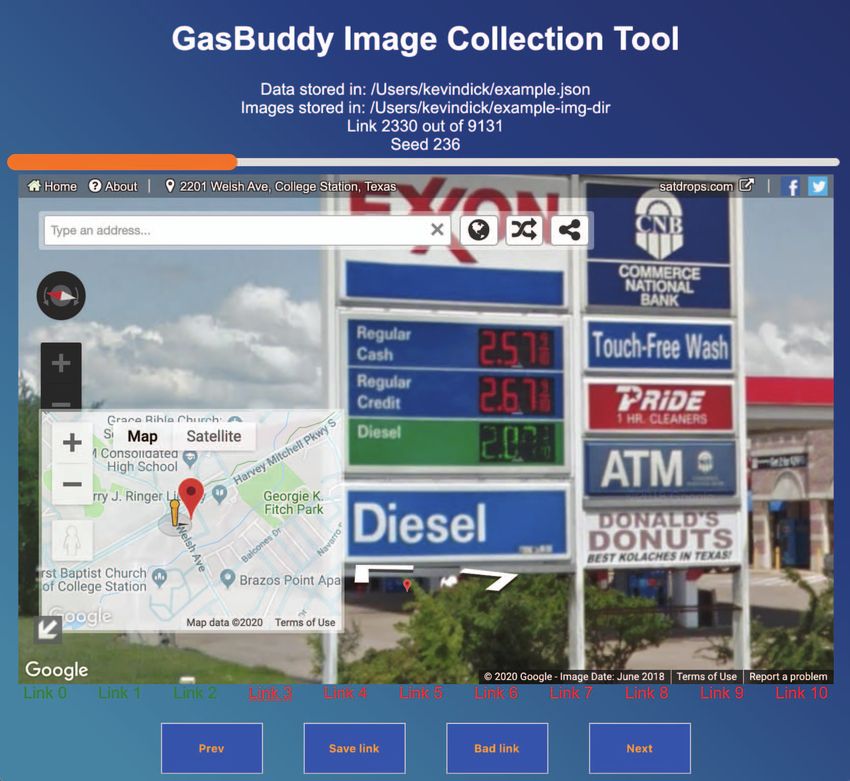
A custom Selenium-based Python scraper was developed Figure 2. Screen-capture of the Image Collection Application interface. (1)
to crawl the domain and extract all listed street-based indicates the input file of seed URLs; (2) indicates the directory to which
images are saved; (3) indicates the current link number among all seeds; (4)
addresses for each of the cities within each of the 50 a progress bar to visually compliment (3); (5) the interactive GSV interface
states, resulting in 50,043 addresses. Unique addresses were to navigate the environment and frame the resultant image; (6) interactive
geocoded to (lat,lon) pairs, providing 34,732 initial coarse- map to teleport the view; (7) a link to the current seed URL; (8) previously
completed seed URLs; (9) button to navigate to the previous set of seed
grained seed locations. To further augment this dataset, we URLs; (10) button to capture the currently framed view and save to file;
leverage the Google Places API to obtain (lat,lon) pairs for (11) button to indicate an invalid seed link and skip to the next; (12) button
all gas stations within a 2km radius of each seed location, to skip to the next set of seed URLs.
resulting in an approximately ten-fold increase in refined
seed locations. A further advantage of using this API was B. Ground Truth Annotation of Gas Prices
the improved quality of the returned seed locations which,
conveniently, almost always localised in near proximity to a From the resultant dataset of images, the ground truth an-
gas station. notation of the contained gas prices is required. The concept
of ground truth in this case is somewhat complex, given
A. Gas Price Localization & the GSV Image Collection App that several types and levels of annotations are possible.
The segmentation of an image associates specific pixels to
The resultant dataset of >300, 000 seed locations was then a given class. For example, a bounding box encapsulating
used to obtain a GSV image of the advertised gas price in the pixel depicting the digit “3” is assigned the class label
the environs of each seed. Each seed represents a geograph- “3”. However, the detection of prices requires that individual
ical location with an available GSV panorama in relative digits be intelligently combined into the price they represent.
proximity to a gas station. The GSV interface was used to Thus, for multi-digit numbers, such as gas prices, a bounding
manually navigate the view to identify the advertised gas box might additionally encapsulate the pixels depicting the
price(s). To perform this at scale, the Amazon Mechanical price “3.14” which, analogously, receives a class label of
Turk (AMT) service was used in combination with a cross- “3.14”. Determining the grade of fuel is also necessary
platform GSV Image Collection application built upon the to relate the correct price to the correct fuel. Segmented
Electron and React frameworks. The application interface regions of the image that encapsulate the pixels depicting
is depicted in Figure 2. Workers were instructed to navigate the grade of a given fuel are also needed. To eliminate
the interactive GSV interface to center and maximally zoom- distracting elements within the image or to ignore unrelated
in the view onto the advertised gas price before capturing digits within the frame, a bounding box over the gas price
the image as a 640×640 pixel scene. Consequently, a given sign would additionally support focusing the attention of
seed location is “transformed” into an image encapsulating a learning model towards pixels relevant to the task of
the desired gas price information. This data collection did extracting prices (Figure 3).
not require research ethics board approval and AMT workers On the other hand, an image can also be assigned a
were compensated for each annotation task in accordance to specific class; the prototypical image of a cat receives the
the AMT best practices for pricing. class “cat”. In this case, a learning algorithm learns to
160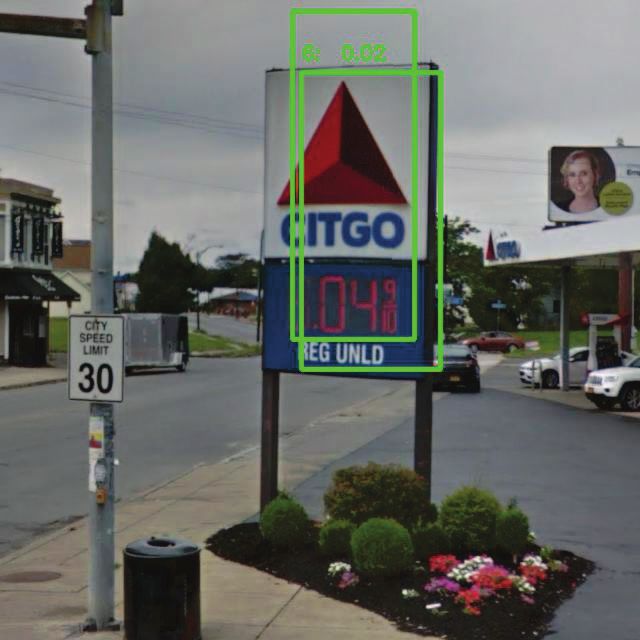
focus on the salient features throughout the entire image                           segmentation tasks, the sign-level masks are currently avail-
to learn “cat-ness” facets. For our purposes, the class label                       able for a subset of images. Collection of digit-, price-
of an image may be assigned the represented price(s). In it’s                       , and label-segmented masks, as depicted in Figure 3, is
simplest form, the ground truth label of an image comprises                         a continuing effort. Progressively, AMT will be leveraged
the most represented element: the cash price of regular,                            to obtain complete ground truth labels for all gas prices
unleaded gasoline. However, to support the extraction of                            depicted in each GPA image.
the variable number of all prices defined in the image,
we devised the following ground truth labelling convention,                         C. Baseline Performance of the GPA
supporting a flexible number of advertised prices, multiple                             To gauge the difficulty of the GPA, we generate baseline
grades of fuel, missing digits, and fractional digits:                              models for both the digit classification and the sign segmen-
                                                                                    tation tasks.
                                                                                       For digit classification, we implemented a YOLO (”You
        ⟨gas-price-1⟩;⟨gas-price-2⟩; . . . ; ⟨gas-price-n⟩              (1)         Only Look Once”) digit detector trained on the SVHN
   where n is the number of gas prices displayed in the                             dataset. Inferences were made for each image and perfor-
image, and the prices are ordered by appearance when                                mance was reported using the average precision and average
processing the image row-by-row and left-to-right from the                          recall of the model across all images. Varying the detection
top-left to bottom-right. Each given gas price ⟨gas-price-i⟩                        threshold parameter of the YOLO model produced a cluster
in the image is assigned a unique price id and its ground                           of such average precision and average recall points.
truth label has the string form:                                                       Recall and precision are defined as:
                                                                                                                |correctly predicted digits|
                           ‘x.xx(x/xx)g’                                (2)                          recall =                                                          (3)
                                                                                                                     |predicted digits|
   where x ∈ {0, 1, . . . , 9} and g ∈ {‘r’,‘m’,‘p’,‘d’}
                                                                                                                 |correctly predicted digits|
as the grade of fuel, representing ‘Regular’, ‘Mid-Grade’,                                     precision =                                                             (4)
‘Premium’, and ‘Diesel’, respectively. The character ‘-’ is                                                         |ground truth digits|
used whenever a given digit or grade value is missing or                               To better understand the expected baseline performance
deemed uninterpretable.                                                             for models predicting a variable number of digits for images
   AMT was used to transcribe the identifiable prices within                         that may contain a variable number of true digits, we
each image using the above convention. In a second round                            ran several Monte Carlo simulations using the algorithm
of AMT annotation, the bounding box of the sign within                              depicted in Algorithm 1. In keeping the number of “target”
each image was determined, generating masks useful for                              values (i.e. y) fixed and varying the number of “predicted”
transfer learning a semantic segmentation model. For digit                          values (i.e x), we repeatedly simulate random predictors,
classification tasks, the GPA currently contains 3-digit an-                         resulting in a curve in the average precision-recall space.
notations for the cash price of regular, unleaded fuel. For                         Repeating the same for different target values produces a

                                                                Digits & Labels Link to a Price ID

                                                                                                                                                    Human Annotation
                                                                                                                                                    Binary Mask

            A: Reference Image

                                         B: Digit-Level Annotation   C: Price-Level Annotation D: Label-Level Annotation E: Sign-Level Annotation

Figure 3. Example segmentation of a reference image (A) at the digit-level (B), price-level (C), label-level (D), and sign-level (E). A mapping based on
a unique price ID is used to relate digit- and label-based information to each multi-digit price.

                                                                              161
family of distinct curves in this space. We simulated values                     of 1,056 images. These images were obtained by applying
for x ∈ [1, 2, . . . , 100] and y ∈ [1, 2, . . . , 10, 20, . . . , 100],         the localization procedure to approximately 3,000 randomly
using i = 1000 iterations for each simulation.                                   sampled, refined seed locations. As this represents only 1%
   Finally, to establish the baseline performance for a                          of all available seed links, ongoing image collection and
segmentation-type task, we used the available sign-                              annotation work is expected to dramatically increase the size
level masks to perform transfer learning using Google’s                          of the GPA dataset.
DeepLabV3 ResNet101 semantic segmentation model im-                                 To ensure that the GPA imagery were not geographically
plemented in PyTorch [9]. Accompanying code can be found                         biased we examined the number of coarse-grained seed
at github.com/GreenCUBIC/Gas-Prices-of-America.                                  locations obtained from AGS for each state v.s. the 2019
                                                                                 population census [10]. As expected, we observe a strong
                 III. R ESULTS & D ISCUSSION                                     positive relation (Spearman 0.876) between the number of
   The preparation of a large-scale image dataset of ad-                         gas stations and state population with a noted exception of
vertised gas prices in America makes contributions to the                        Idaho. Analogously, a moderate positive relationship (Spear-
broader scientific community in three ways:                                       man 0.477) between number of gas stations and population
  1) Enables the development of CV models to automati-                           density, with the noted exception of Washington, DC.
     cally detect and report gas prices as part of AV crowd-                        In addition to depictions of these relationships, the GPA
     sourcing infrastructure.                                                    website additionally illustrates a set of six exemplar images
  2) Provides a benchmark to evaluate the performance of                         representing relatively “easy” cases. Of these, images A-B
     non-integer, multi-number, multi-digit values in natural                    each sport a single price comprising large digits and few
     environments.                                                               environmental distractions. Images C-D depict images for
  3) Enables the development of various CV applications                          which the gas price dominates the view, while exhibiting
     based on the extraction and analysis of various metrics                     multiple prices, either varying in size, or consistently repre-
     in the wild (discussed below).                                              sented. Finally, images E and F depict high contrast and well
                                                                                 defined digital displays. Even among these relatively easy
   The dataset of images is made publicly available at the
                                                                                 images, the diversity of the dataset is clear, with multiple
following locations cu-bic.ca/gpa/ and the GPA DataVerse
                                                                                 font styles, colours, sizes, etc.
Repository. The data are prepared such that minimal data
                                                                                    Conversely, we also selected a set of images to highlight
preprocessing or formatting is required. As with the SVHN
                                                                                 the challenging facets of accurately extracting visible gas
dataset, these images are sourced from the natural environ-
                                                                                 prices within the images. Images A-F depict environmental,
ment; however, given the variability in the number of prices,
                                                                                 spatial, or temporal factors that render the digit recognition
the GPA dataset presents a considerably more challenging,
                                                                                 task more difficult. Blurring artifacts are often due to the
unsolved, real-world problem: the recognition of multi-digits
                                                                                 GSV Licence Plate Anonymization process which appar-
numbers in natural scene images.
                                                                                 ently has mistaken advertised prices as vehicular identifica-
A. Characteristics of the GPA Dataset                                            tion, perhaps due to the aspect ratio of the price. Generally
                                                                                 speaking, price and digit obfuscation were avoided at the
   At present, the GPA dataset comprised 2,048 640 × 640                         price localization step by navigating the street-level view to
pixel images, each averaging 540MB for 1.0GB in total                            a non-obstructing position; however, such a vantage point is
storage. For each image, the single-price, ground truth label                    not always readily available nor should it be expected within
is available and sign-level masks are available for a subset                     all AV-sourced imagery. Variations in lighting, price scale,
                                                                                 backdrop, image resolution, and angle vary considerably
Algorithm 1 Monte Carlo Baseline Simulation                                      throughout the dataset.
                                                                                    Images G-L depict contextual challenges to price ex-
Input: num. of “target” digits, y, num. of “predicted” digits,
                                                                                 traction. Notably, the presence of multiple prices based on
    x, num. of iterations, i
                                                                                 multiple grades of fuel (e.g. regular, mid-grade, premium,
Output: avg. recall, avg. precision, 95% CIs
                                                                                 diesel) and payment method (e.g. cash vs. credit) com-
 1: P ← []
                                                                                 mensurately increase the difficulty in combining individual
 2: R ← []
                                                                                 digits into the extracted price and relating that price to
 3: for i iterations do
                                                                                 the correct fuel grade. This challenge is exacerbated when
 4:     Y ← getRandomDigits(y)
                                                                                 multiple pricing signs appear together (Image I). Inter-price
 5:     X ← getRandomDigits(x)
                                                                                 variations in fonts styles are prevalent throughout the dataset;
 6:     R.append(getRecall(X, Y ))
                                                                                 however, rare instances of intra-price variation in font style
 7:     P .append(getPrecision(X, Y ))
                                                                                 do exist (e.g. Image J). Finally, partial digits or uniterpretable
 8: end for
                                                                                 digits result from partially rendered digital displays, broken
 9: return avg(R), avg(P ), getCIs(R), getCIs(P )
                                                                                 displays, missing values, or distant displays (Images K-L).

                                                                           162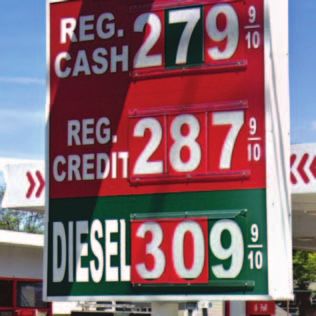
As previously described, the GPA dataset supports mul- benchmark five (Single-Price Classification) and benchmark
tiple levels of ground truth annotations. Contrary to other one (Sign-Level Segmentation).
CV benchmark digit-specific datasets, such as MNIST and For the classification of a single gas price, we im-
SVHN, the GPA can be leveraged in numerous evaluations plemented a vanilla YOLO digit detection model trained
of extracting price information, each presenting an increased on the SVHN dataset and made inferences for each of
level of difficulty. the 2,048 images and reported the average precision and
average recall. We varied the YOLO threshold parameter
B. Multiple Levels of Benchmark Difficulty
and repeated this procedure producing a cluster of points
A distinct advantage of the GPA dataset over other bench- (Figure 4A,C). The performance clusters for three random
mark datasets is the opportunity to extract various informa- digit predictors (predicting x = [1, 3, 10] random digits,
tion, with differing levels of complexity, from the images. respectively) are plotted in comparison along with the MC
The GPA dataset is annotated such that it supports multiple simulation for varying x and fixed y = 3. Interestingly,
levels of difficulty when evaluating a given CV model. The the YOLO model performance does not outperform random
baseline task is the accurate extraction of the multiple gas and may be explained by the discrepancy in training and
prices, which can optionally include the recognition of the evaluation image sizes and complexity (Figure 5).
fractional portion of the price (e.g. 9/10) and determine the The MC simulations for a varying number of target digits
grade of fuel attributed to a given price. The following reveals that even a random model can appear to perform well
prediction tasks are listed in order of difficulty: with an increasingly large number of target digits (Figure
1) Sign-Level Segmentation: Localize the sign which dis- 4B,D). Moreover, the non-uniform distribution of gas price
plays the advertised prices. digits (Figure 5A) suggest that a model biased to predicting
2) Price-Level Segmentation: Localize individual prices. twos, nines, and threes will see improved precision over
3) Digit-Level Segmentation: Localize individual digits one that samples digits at uniform random (Figure 4C).
and group together those contributing to the same price. These results demonstrate the non-trivial nature of detecting
4) Label-Level Segmentation: Perform digit-level segmen- multiple digits among multiple numbers within imagery
tation and grouping label-specific segmentations. sourced from the natural environment.
5) Single-Price Classification: Accurately extract one of The baseline performance for the segmentation-type task,
the listed prices (no fraction) in the image (e.g. the however, demonstrated that transfer learning using Google’s
regular, unleaded, cash price). state-of-the-art DeepLabV3 ResNet101 could rapidly pro-
6) Multi-Price Classification 1: Accurately extract all of duce a near-optimal segmentation model. Following 100
the listed prices (no fractions) in the image. training epochs, we obtained test F1 performance of 0.7125
7) Multi-Price Classification 2: Accurately extract all of (Figure 6A). Interestingly, a quasi-periodic drop in perfor-
the listed prices, including fractions when present, in the mance was observed which we posit to reflect a subset of
image. challenging images. Sample input and model output for a
8) Multi-Price Classification 3: Accurately extract all of
the listed prices, including fractions when present, as
Average Precision-Recall Curve Monte Carlo Simulation for a Varying Number of Digits
well as the grade of fuel (e.g. ‘Regular’, ‘Mid-Grade’, 1.0
A
1.0
B
Predict 10
Predict 3
‘Premium’, ‘Diesel’). 0.8
Predict 1
YOLO Predictions
Monte Carlo Simulation f1=0.8
0.8
Average Precision
y=10
In alignment with the state-of-the-art section of paper-
Average Precision
0.6 0.6 y=9
y=8
f1=0.6
swithcode.com, maintaining a scoreboard of methods and 0.4 0.4
y=7
y=6
y=5
model architectures succeeding in one, multiple, or all cat- 0.2
f1=0.4
0.2
y=4
y=3
f1=0.2
y=2
egories will help establish the state-of-the-art approaches in 0.0 0.0
y=1
0.0 0.2 0.4 0.6 0.8 1.0 0.0 0.2 0.4 0.6 0.8 1.0
the identification of numbers in the wild. A CV model, aptly Average Recall
Average Recall
Average Precision-Recall Curve Monte Carlo Simulation for a Varying Number of Digits
denoted “GasBotty”, capable of achieving a consistently 0.30
0.28
C
1.0
D
high performance on all of these tasks, would be suitable to 0.26
0.8
y=100
Average Precision
y=90
deploy as part of AV infrastructure to automate the process
Average Precision
0.24 0.6 y=80
y=70
of updating the GasBuddy database with the most up-to-date 0.22
0.4
y=60
y=50
0.20 y=40
gas prices. 0.18
Predict 10
Predict 3
Predict 1
0.2
y=30
y=20
YOLO Predictions y=10
0.16 Monte Carlo Simulation y=1
C. Baseline Performance of State-of-the-Art Methods 0.0 0.1 0.2 0.3 0.4
Average Recall
0.5 0.6
0.0
0.0 0.2 0.4 0.6
Average Recall
0.8 1.0
To understand the difficulty of each benchmark, we lever-
aged various state-of-the-art CV models designed to address Figure 4. Digit Classification Baseline Performance. Panels A & C
depict the y = 3 MC simulated baseline performance, the YOLO model
related tasks. Since only the annotated labels for the regular, predictions, and the performance of three random schemas (x = {1, 3, 10})
unleaded, cash price and sign-level masks are available for evaluated for the GPA dataset. Panels B & D depict each of the MC
each image, we establish this baseline performance for the simulated baselines for a variable number of target digits.
163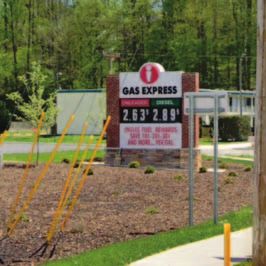
given image is depicted in Figure 6B-D). D DeepLabV3 Fine Tuning GPA Performance
The ongoing collection of digit-, price-, and label-level 1.0
annotated masks will enable determination of baseline per-
formance for the remaining segmentation-type benchmarks.
The combined use of these models is expected to contribute 0.8
to the development of a robust method capable of accurately
identifying metrics in the wild.
0.6
D. GasBotty: Machine-Augmented Crowd-Sourcing
Performance
Effective CV models that successfully localize and extract Train_loss
Test_loss
gas prices represent the first opportunity for leveraging AV
0.4 Train_f1_score
infrastructure to remotely monitor time-varying events in Test_f1_score
the natural environment. When incorporated in the edge/fog Train_auroc
layer of a fleet of AVs, the onus of updating GasBuddy’s Test_auroc
0.2
database will no longer fall to the human, relieving them of
the responsibility to communicate gas price updates.
GasBotty represents the first of what is anticipated to
be many applications wherein AV-based CV models con- 0.0
tribute crowd-sourced information. Conceivably, the crowd- 20 40 60 80
contributed traffic updates of the Waze application might Number of Epochs
eventually be automated from a similar AV-based CV model. C Image A Ground Truth B Segmentation Output
Arguably, the task of identifying dynamic traffic events such
as stalled vehicles, hidden police traps, and traffic accidents
are far more complicated. Inter-vehicle communication sys-
tems have been proposed for alerting vehicles within the
vicinity of a possible hazard [11]. Our proposed vision is
complementary in that the AV-sourced detections would also
be aggregated within a centralized repository and distributed
to all interested parties. Figure 6. Sign Segmentation Baseline Performance using Transfer
Learning with the DeepLabV3 ResNet101 Model.
Further development of AV systems to accommodate this
streetscape crowd-sourced information would foreshadow
the impending era of machine-augmented crowd-sourced
data. It is expected that machine-augmented crowd-sourced
Frequency of Digits in Ground Truth Frequency of Digits in Yolo Predictions
C 1400
A data would increase the quality and consistency of crowd-
1400
1200
1200 sourced data. Furthermore, users of a given platform are
1000
more likely to contribute data if the detection and update
Frequency of Digit
Frequency of Digit
1000
800
800
process is made effortless (i.e. through automation). Promis-
600 600
400
ingly, the data will likely have greater temporal resolution
400
200 200
and, therefore, greater utility.
0 0
0 1 2 3 4 5
Digit
6 7 8 9 - 0 1 2 3 4
Digit
5 6 7 8 9
E. Extracting Metrics in the Wild
B D Beyond its utility as a benchmark for the evaluation of
CV models and development of sophisticated AV-destined
CV models, the GPA dataset promises further application
in the generalized extraction of metrics in the wild. That
is, analogous to the anticipated GasBotty model, capable
of extracting gas prices from the surround environment
with high fidelity, a myriad of similar models able to
extract various metrics from the wild are made possible. As
visual creatures ourselves, urban environments are densely
packed with advertisement and media in subtle pursuit of
Figure 5. Digit Frequency and YOLO Predictions. Panels A & B depict
the GPA digit frequency as compared to those predicted by the YOLO
our attention. Quickly perusing a sample of images from
digit detector. Panels C & D depict two sample YOLO predictions and the GPA dataset reveals widespread pricing information for
emphasize the discrepancy in predicted digit size and actual digit size. commodities other than gas, such as cigarettes, soft drinks,
164
alcohol, and fast food.                                                       [2] A. G. Rundle, M. D. Bader, C. A. Richards, K. M. Neck-
   Businesses for which the advertised commodity is com-                          erman, and J. O. Teitler, “Using google street view to audit
pletely interchangeable (e.g. regular gas from Shell ≈ regular                    neighborhood environments,” American journal of preventive
                                                                                  medicine, vol. 40, no. 1, pp. 94–100, 2011.
gas from Exxon ≈ regular gas from Valero ≈ · · · ) must
uphold their end of an implicit social contract with the                      [3] J. S. Apte, K. P. Messier, S. Gani, M. Brauer, T. W. Kirch-
consumer by advertising their price. A wise consumer is                           stetter, M. M. Lunden, J. D. Marshall, C. J. Portier, R. C.
likely to peruse the competition in search of the lowest gas                      Vermeulen, and S. P. Hamburg, “High-resolution air pollution
price at a given point in time. In their proverbial “race to                      mapping with google street view cars: exploiting big data,”
                                                                                  Environmental science & technology, vol. 51, no. 12, pp.
the bottom”, these businesses are reluctant to advertise their                    6999–7008, 2017.
prices online at the expense of their profits. The demand for
omniscient knowledge of the “current best deal” gave rise                     [4] X. Li, C. Zhang, W. Li, R. Ricard, Q. Meng, and W. Zhang,
to the GasBuddy platform.                                                         “Assessing street-level urban greenery using google street
   Related examples exist; the detection of any time-varying,                     view and a modified green view index,” Urban Forestry &
                                                                                  Urban Greening, vol. 14, no. 3, pp. 675–685, 2015.
visually advertised value from a streetscape can benefit
from the GPA dataset. From the perspective of healthcare,                     [5] C. Guo, T. H. Kim, A. Susarla, and V. Sambamurthy, “Un-
the road-side advertisement of a clinic’s wait time can                           derstanding content contribution behavior in a geo-segmented
be extracted and updated. Entirely new applications may                           mobile virtual community: The context of waze,” Available
result from the increased temporal resolution and accuracy                        at SSRN 3065303, 2019.
of such machine-augmented crowd-sourcing. For example,                        [6] Y. LeCun, C. Cortes, and C. J. Burges, “The mnist
prior to and following a natural disaster, crowd-sourced                          database of handwritten digits, 1998,” URL http://yann. lecun.
information about local resources is often provided by fellow                     com/exdb/mnist, vol. 10, p. 34, 1998.
citizens through platforms such as Twitter. Moving into
the machine-augmented crowd-sourcing era, a fleet of AVs                       [7] Y. Netzer, T. Wang, A. Coates, A. Bissacco, B. Wu, and
                                                                                  A. Y. Ng, “Reading digits in natural images with unsupervised
capable of the high-temporal vision-based detection of the                        feature learning,” 2011.
(un)availability of a specific resources would revolutionize
crisis management for the betterment of humanity.                             [8] K. Dick, F. Charih, Y. S. Dosso, L. Russell, and J. R. Green,
                                                                                  “Systematic street view sampling: High quality annotation of
                       IV. C ONCLUSION                                            power infrastructure in rural ontario,” in 2018 15th Confer-
                                                                                  ence on Computer and Robot Vision (CRV). IEEE, 2018,
   Leveraging the high spatio-temporal resolution imagery                         pp. 134–141.
from circulating fleets of AVs with state-of-the-art CV
methods promises to revolutionize our ability to crowd-                       [9] L.-C. Chen, G. Papandreou, F. Schroff, and H. Adam, “Re-
                                                                                  thinking atrous convolution for semantic image segmenta-
source time- and space-varying events within the natu-                            tion,” arXiv preprint arXiv:1706.05587, 2017.
ral environment. The GPA dataset described in this work
represents a first step towards the development of highly                     [10] United States Census Bureau, “National population
accurate CV models with utility as part of AV infrastruc-                         totals   and   components      of    change:     2010-2019,”
ture. The dataset further serves as a benchmark against                           https://www.census.gov/data/datasets/time-series/demo/
                                                                                  popest/2010s-national-total.html.
which the CV community might evaluate their models for
variable numbered multi-digit, multi-number classification                    [11] C. Brenzel, C. Passmann, and R. Meschenmoser, “Wireless
tasks. The GSV Image Annotation app described, herein,                            inter-vehicle communication for hazard warning,” IFAC Pro-
also contributes a useful tool for the rapid localization                         ceedings Volumes, vol. 34, no. 9, pp. 275–277, 2001.
of desirable GSV imagery from a set of seed locations.
In summary, the secondary use of these AV-sourced data
heralds a new era of machine-augmented crowd-sourcing
when fused with state-of-the-art machine learning methods.
The GPA dataset is available online at cu-bic.ca/gpa and at
doi.org/10.5683/SP2/KQ6VNG. Accompanying code can be
found at github.com/GreenCUBIC/Gas-Prices-of-America.

                          R EFERENCES
 [1] A. Rzotkiewicz, A. L. Pearson, B. V. Dougherty, A. Short-
     ridge, and N. Wilson, “Systematic review of the use of
     google street view in health research: major themes, strengths,
     weaknesses and possibilities for future research,” Health &
     place, vol. 52, pp. 240–246, 2018.

                                                                       165
You can also read


