General Motors Metrics for Sustainable Manufacturing - LABORATORY FOR SUSTAINABLE BUSINESS
←
→
Page content transcription
If your browser does not render page correctly, please read the page content below
General Motors
   Metrics for Sustainable Manufacturing

             LABORATORY FOR SUSTAINABLE BUSINESS

Jonathan Dreher, Maureen Lawler, Jeremy Stewart, Giovanni Strasorier, Malaika Thorne

                                   May 14, 2009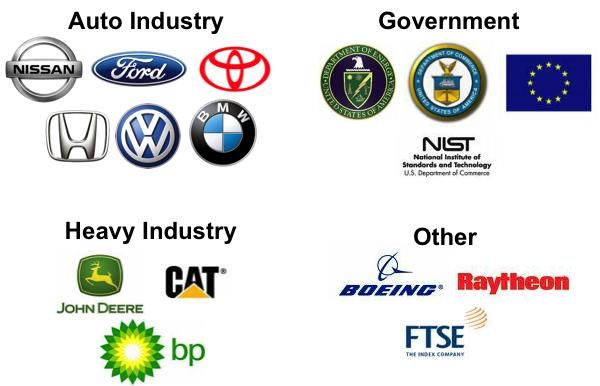
15.992 – Strategies for Sustainable Business
Sustainability Metrics for General Motors

                                                                           Table of Contents
Introduction ............................................................................................................................................................................................ 3

     Objectives .......................................................................................................................................................................................... 3

     Company and Project Background ..................................................................................................................................................... 3

     Approach to Analysis.......................................................................................................................................................................... 5

Sustainable Manufacturing Metrics ......................................................................................................................................................... 5

     Regional Standards ............................................................................................................................................................................ 7

     Industrial Standards ........................................................................................................................................................................... 7

     Metrics by Scope ................................................................................................................................................................................ 9

Determining the Suitability of Metrics .................................................................................................................................................. 10

     Effort Required and Effectiveness of Metrics ................................................................................................................................... 10

     Comparisons .................................................................................................................................................................................... 10

     Background ...................................................................................................................................................................................... 11

     General Recommendations.............................................................................................................................................................. 12

     Environmental Impact ...................................................................................................................................................................... 12

          Suggested Metrics ...................................................................................................................................................................... 12

     Energy Consumption ........................................................................................................................................................................ 13

          Suggested Metrics ...................................................................................................................................................................... 13

          Employee involvement ............................................................................................................................................................... 13

     Personal Health ................................................................................................................................................................................ 13

          Metrics to Adopt From Others .................................................................................................................................................... 14

          Suggested Metrics ...................................................................................................................................................................... 14

     Occupational Safety ......................................................................................................................................................................... 15

          Metrics to Adopt from Others .................................................................................................................................................... 15

          Suggested Metrics ..................................................................................................................................................................... 16

     Waste Management......................................................................................................................................................................... 16

          Suggested Metrics ...................................................................................................................................................................... 16

     Manufacturing Costs ........................................................................................................................................................................ 16

Summary and Conclusion ...................................................................................................................................................................... 17

References ............................................................................................................................................................................................. 20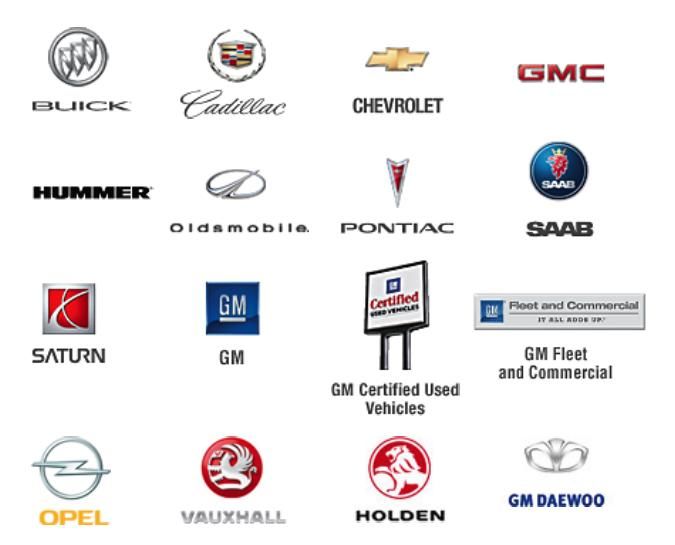
15.992 – Strategies for Sustainable Business
Sustainability Metrics for General Motors

Introduction

Objectives
General Motors defined the project as a review of state-of-the art metrics used in green or
sustainable manufacturing. Their request was for a survey of available literature, best practices
by other manufacturing firms in automotive manufacturing as well as other industries, and
metrics proposed or adopted on a regional basis. Following the survey of existing and proposed
metrics, the MIT Sloan team was asked to determine the suitability of the metrics by comparing
the effort and effectiveness of each, and suggesting the best of these to implement at GM’s
various manufacturing operations. The criterion given was to maximize the positive
environmental impact relative to the other needs of a large public company.

Company and Project Background
General Motors Corp. (NYSE: GM), one of the world's largest automakers, was founded in 1908,
and today manufactures cars and trucks in 34 countries. With its global headquarters in Detroit,
GM employs 234,500 people in every major region of the world, and sells and services vehicles
in some 140 countries. In 2008, GM sold 8.35 million cars and trucks globally under various
brands (see figure 1). 1

                                               Figure 1: GM Brands

The company currently has seven sub-groups working on metrics2:

       1. GM’s Global Environmental Metrics Team
       2. GM’s Global Environmental Issues Team

1
    General Motors. (2009, 5 13). GM Website. Retrieved 5 13, 2009, from GM Website: http://www.gm.com/
2
    GM CR Report, 2008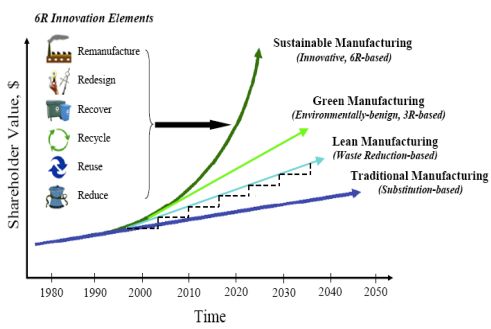
15.992 – Strategies for Sustainable Business
Sustainability Metrics for General Motors

       3. GM’s Energy & Utility Services Group (EUSG)
       4. GM Energy Cost Council
       5. GM's Global Energy Team (GET)
       6. The Energy and Environment Strategy Board (EESB)
       7. The GM Worldwide Facilities Group
The goal of this specific project, sponsored by the company’s R&D – Manufacturing Systems
Research (MSR) Lab in Detroit, MI, was to determine which metrics for sustainable
manufacturing should be recommended for later implementation by the Worldwide Facility
Group of GM. The metrics are to be focused on manufacturing and operations, the areas where
this group is active.

The drivers for sustainability metrics include:

       1. Pending regulation in the areas of energy consumption and environment impact (i.e.
          CO2 cap-and-trade): general world-wide acceptance of climate change and pending
          environmental regulation and pending standards may impact manufacturing. Europe
          and Japan have moved aggressively in areas such as emission, waste, and environmental
          regulations, often in directions different from North America.

       2. Energy security: a large operation such as an automobile plant requires some security
          against extreme energy price fluctuations, which can severely impact margins and
          render capital planning extremely difficult.

       3. Change in public awareness and branding: perceived sustainability of a brand’s
          operations is becoming more and more relevant in purchasing decisions. Changing
          customer preferences and increased sensitivity to sustainability-related issues.

       4. Improved manufacturing methods and technology maturation: improved process
          efficiencies that have a positive environmental impact are possible now due to
          technological advancement and lower costs.

A multinational corporation cannot ignore large differences such as those found in
sustainability-related normative in the different business environments it operates in.

Energy efficiency, renewable energy sources, reductions of energy and water consumption are
of special interest, and the company has set a company-wide target of an 8% reduction in
greenhouse gas emissions by 2020 that would return it to 2005 levels. 3

In 2008, GM approved three sustainability metrics: an energy use index, a water index, and a
carbon ndex to calculate the company’s performance and targets.

3
    General Motors. (2009, 5 13). GM Website. Retrieved 5 13, 2009, from GM Website: http://www.gm.com/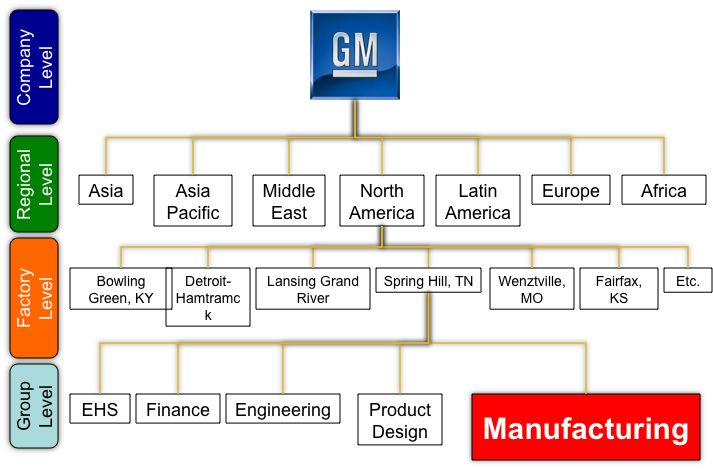
15.992 – Strategies for Sustainable Business
Sustainability Metrics for General Motors
Approach to Analysis
The team identified companies and government entities to target for sustainability
benchmarking (see figure 2)
Figure 2: List of Benchmarked Firms and Government Agencies
In addition to the firms chosen to benchmark against, the team also used the following
resources to gain further insight when thinking about this problem:
1) MIT Engineering Faculty
2) Course 15.992 Staff
3) Class Discussions
4) Industry Contacts
5) Literature Review
Sustainable Manufacturing Metrics
Although our focus has been on sustainable metrics for manufacturing, the systemic
considerations that follow are general in nature and can be applied to all metrics within a firm.
To be effective, metrics have to, as a guideline, satisfy the following criteria or characteristics4:
Address the needs of all stakeholders (community, government, and business)
Facilitate innovation and growth; continuous improvement must be the cornerstone
Harmonize local, state, national, and international levels of business units and
operations
Be fully compatible with existing business systems (add value)
Measure the right things – what is measured is what gets managed
4
Eaton, R. J. (2009, 5 1). Getting the Most out of Environmental Metrics. Retrieved 5 1, 2009, from NAE:
http://www.nae.edu/nae/bridgecom.nsf/weblinks/NAEW-4NHM8815.992 – Strategies for Sustainable Business
Sustainability Metrics for General Motors
A process to build systemic (companywide), as well as local (i.e. manufacturing) set of
meaningful sustainability metrics is proposed as follows:
1. Create a list of “reference metrics” for each level, by examining what peer organizations
are tracking and listing (at high level). Deduce what must be measurable in order to
quote any of these metrics (which experience shows tend to be somewhat aggregated);
2. Consider additional metrics stakeholders are likely to care about and inquire with them;
3. Provide proposed metrics for each level; this could be a good time to get a small
number of committed individuals from each level in question with effective intra-
company network standing to participate in the debate. They can become very effective
ambassadors for the program at a later implementation stage. Involving employees
(who are often a part of surrounding communities as well) also reinforces point two
above by listening to a part of the stakeholders;
4. Examine all the proposed metrics and come up with a list that at least evaluates all
major aspects of sustainability;
5. Cross-check the edited list for completeness and coherence; determine which metrics
personnel within each level can alter;
6. Work out the detail of what must be measured and how in order to be able to have
consistent, meaningful numbers on each metric; ensure comparability across sites and,
possibly, to industry standard measurements;
7. Devise ways to normalize the measured quantities, so as to have indexes independent
of actual production numbers. This ensures that large fluctuations in production do not
substantially alter year-by-year results, helping in benchmarking toward goals;
8. Set achievable but high-bar goals, along each metric, ensuring a milestone path to
achieve them. These can be different for specific locations based on the realities on the
ground, but must average out to the corporate goals;
9. Enable employees at all levels, especially on the ground, by educating them about
sustainability and how they can improve not just the firm’s sustainability metrics, but by
doing so they improve efficiency;
Given the above, the team developed a few additional criteria and observations it would like to
propose as being potentially useful in building a GM-wide systematic approach to sustainability:
1. Metrics at different levels should be:
a. Consistent with the level of abstraction from operational detail relative to the
particular level of the firm;15.992 – Strategies for Sustainable Business
Sustainability Metrics for General Motors
b. Coherent at the different company levels, so as to push the entire company
toward common objectives;
c. Interconnected, so as to check each other out and encourage companywide
adoption;
2. Systematic measurement should monitor progress and quantify improvement, savings,
efficiency gains, etc.
3. Measurement should be complemented by regular and irregular audit, by internal and
third party independent auditors
4. Metrics and goals should be set following accepted third party or industry-wide
practices, to allow meaningful benchmarking and gain credibility
5. Cross-flow of information is fundamental to spread the progress across the company’s
operations, across geographies, divisions and sub-divisions, subsidiaries, groups, etc.
6. Independent certification and auditing would give the entire process added credibility to
the outside (customers, community, shareholders)
Regional Standards
We identified a list of existing regionally or internationally accepted manufacturing standards, as
shown in Table 1. GM can use regional standards to develop a strategy in which regions target
pilot programs within their operations, given that the compliance mandate already exists in
some areas. Given the global reach of GM, it may be most sensible to implement international
(i.e. ISO) standards everywhere for all fields they cover. This would provide standardization
across the company.
Industrial Standards
The standards listed in Table 1 are widely recognized by industry and customers alike and
certified by third-parties. Although some of the standards differ by region, there are
international standards. None of these encompass every aspect of sustainable manufacturing
(i.e. one regulates electronic waste, another building codes, etc.) however. To be sustainable in
all aspects of a complex manufacturing, a company like GM must select several norms covering
different aspects of its operations. A global company should use international norms and
standardize practices across regions. Basing GM’s metrics on these metrics avoids reinventing
and ensures widespread acceptance.15.992 – Strategies for Sustainable Business
Sustainability Metrics for General Motors
5
Table 1. International and regional standards affecting sustainability
Standard Year Region Application
BS 8900 2006 British managing sustainable development
ELV 2000 Europe automotive vehicles
Energy Star 1992 USA products, buildings
EPA’s AP-42 1995 USA emissions factors for stationary sources
IEEE 1680 2006 USA personal computer products
IMDS 2000 International automotive industry material data system
IPC 1752 2007 USA materials declaration in products
ISO 14000 series 1992 International processes
ISO 19011 2002 International environmental management systems
JIG-101 2005 International materials declaration in products
LEED 1998 USA buildings, homes
NSF-140 2007 USA carpet industry
REACH 2006 Europe products with hazardous materials
RoHS 2003 Europe new electrical and electronic equipments
WEEE 2002 Europe all waste electrical and electronic equip.
6
Table 2: International and regional standards affecting sustainability
Category Description Similar Indicators or Examples
Individual indicators Measure single aspects individually Core set of indicators
Minimum set of indicators
Key performance indicators A limited number of indicators for
(KPIs) measuring key aspects that are defined
according to organizational goals
5
The National Institute of Standards and Technology (NIST). (n.d.). Retrieved May 14, 2009, from www.nist.gov
6
Ibid15.992 – Strategies for Sustainable Business
Sustainability Metrics for General Motors
Composite indices Synthesis of groups of individual
indicators that is expressed by only a
few indices
Material flow analysis (MFA) A quantitative measure of the flows of Material balance
materials and energy through a Input-output analysis
production process Material flow accounting
Exergy; MIPS
Environmental accounting Calculate environmental-related costs Environmental management
and benefits in a similar way to financial accounting
accounting system Cost-benefit analysis
Material flow cost accounting
Eco-efficiency indicators Ratio of environmental impacts to Factor
economic value created
Lifecycle assessment (LCA) Measure environmental impacts from Ecological footprint
indicators all stages of production and Carbon footprint
consumption of a product/service
Sustainability reporting A range of indicators for corporate non- GRI Guidelines
indicators financial performance to stakeholders Carbon Disclosure Project
Socially responsible Indices set and used by the financial Dow Jones Sustainability Indexes
investment (SRI) indices community to benchmark corporate FTSE4Good
sustainability performance
Metrics by Scope
Some organizations have decided to organize their sustainability efforts by business units, or to
expand it beyond one specific group function. An example implemented by BRE is shown in
Figure 3.
7
Figure 3: Example of Sustainability Reporting: BRE-Breakdown per Employee
7
BRE. Sustainability Report 2006/2007. BRE:
http://www.bre.co.uk/filelibrary/corporate/BRE/KN2960_Sustainability_Report_080807.pdf.15.992 – Strategies for Sustainable Business
Sustainability Metrics for General Motors
Determining the Suitability of Metrics
We determined that the best criteria for choosing which metrics to implement depend on
identifying the specific “hotspots”8 for a company and industry. These are the process stages
that have the highest environmental and social impacts. We also determined that the effort
required to implement the metrics depended on the existence of at least one of the following:
Reason for the assessment
Scope of the tool
Resources for the assessment
Time frame
Data availability9
Effort Required and Effectiveness of Metrics
The effort to accurately collect data and the effectiveness of measuring that data are important
considerations when choosing and prioritizing sustainable manufacturing metrics. For example,
if expensive new sensors are required to measure trace amounts of a fairly benign chemical by-
product that is already estimated to be well within compliance, the installation of the sensors
should receive low priority. It is important to objectively weigh these considerations, however,
and not use them as an excuse for re-prioritizing projects that may not be popular or have
positive results.
Comparisons
Comparison of analyzed companies shows that the best metrics have to be clearly measurable,
goals objectively expressed quantitatively and on a time scale, and status clearly communicated.
Examples can be seen in Table 3.
Table 3. Sample Metrics from Several Auto Manufacturers
COMPANY METRIC GOAL STATUS
TOYOTA Manufacturing Reduce energy usage of manufacturing / facilities / operations Ongoing
(energy) in North America to 6.3 MMBTU/vehicle produced
Manufacturing Reduce water usage to 0.98 kgal / vehicle Achieved
(water)
2
Manufacturing Reduce body painting VOC’s to a corporate average of 14 g/m Achieved
(air quality)
BMW Manufacturing Increase (keep) high percentage (>55%) of shipments of new 2007
(Logistics) vehicles from plants using low-emissions transportation (i.e.
rail)
Manufacturing Switch to vehicle distribution without surface protection. By 2008
(logistics & start of 2008, 95% of Group’s vehicles shipped without extra
environment) surface protection
8
Unger, N., Schneider, F. and Salhofer, S. (2008)
9
Ibid.15.992 – Strategies for Sustainable Business
Sustainability Metrics for General Motors
A comparative analysis of the companies was performed, resulting in several strong general
conclusions:
1. German and Japanese companies have the longest traditions in the sustainability arena
2. Sustainability has translated into an ingredient of competitive advantage in the
marketplace and, in the long run, improved the efficiency of companies that integrate
its criteria into their operation
3. Companies that have most success at sustainability are those that adopted a
comprehensive, systemic approach to it. This includes all operations of the firm, at all
locations, from product design to manufacturing operations, to the way offices and
plants are built and operated. In order to achieve this, all successful players have
implemented a combination of technological measures and employee awareness,
training, and action
Background
To determine which metrics should be included in a sustainable manufacturing strategy, a
literature review was performed. As shown in Figure 4, manufacturing that is performed in a
sustainable manner, using the “6R Innovation Elements” has the potential to yield much higher
shareholder value than both traditional and lean manufacturing. The next question the team
researched was “what defines sustainable manufacturing?” It was immediately obvious from
reviewed research that for a company to achieve truly sustainable manufacturing practices, it
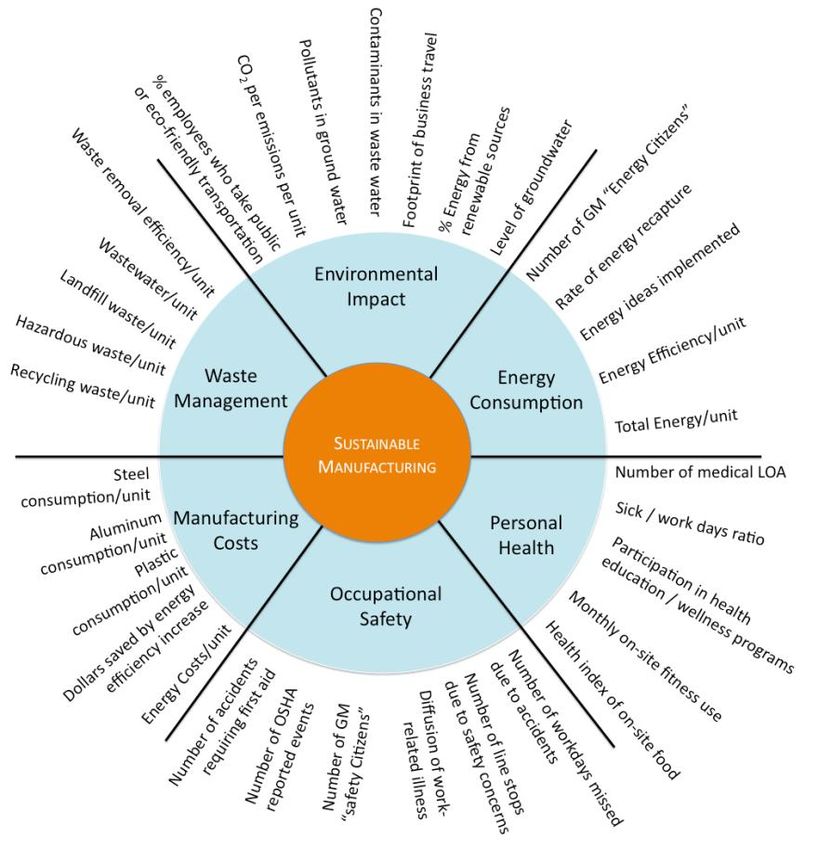
had to take a holistic approach. The six categories listed in Figure 5 are recognized as important
components of sustainable manufacturing. The following sections of the paper will go into each
of the six metric categories and provide suggestions on what new metrics GM should consider
tracking in their manufacturing processes.
10
Figure 4: Theoretical Effect of Sustainable Manufacturing on Shareholder Value
10
Jawahir, I. S. (2007). Sustainable Manufacturing Processes: New Challenges for Developing Predictive Models and
Optimization Techniques. First International Conference on Sustainable Manufacturing (pp. 1-19). Montreal:
Aerospace Manufacturing Technology Centre.15.992 – Strategies for Sustainable Business
Sustainability Metrics for General Motors
11
Figure 5: Six Metric Categories Resulting in Sustainable Manufacturing
Recommendations
Environmental Impact
Environmental impact metrics can be broken down into two levels. The first level addresses
pollutants released directly by GM operations and the second level measures the effects of
these pollutants on the local environment. It is important for GM to not only know what it is
releasing into the environment but also how its operations affect existing local air and water
quality. Suggested goals are based on cutting-edge industry standards and measurements
should be normalized to prevent artificial success caused by decreased production.
Suggested Metrics
Continue to measure the amount of volatile organic compounds (VOCs) emitted
(kg/vehicle)
Continue testing the level of contaminants in wastewater, such as Biological Oxygen
Demand (BOD5), Chemical Oxygen Demand (COD), pH, oil and grease, and heavy
metals
Expand upon five-year target of an 8% reduction in CO2 emissions from 2005-2010
by increasing the company’s goal for 2010-2015 to achieve an additional 20%
reduction
Normalize all greenhouse gas emissions (GHGs) to lbs/vehicle
Calculate carbon footprint of common business practices (such as travel) and aim
for a 20% reduction by 2015
Measure all employees using public transit/walking/biking
Measure of pollutant levels in local air and downwind areas
Gauge the concentration of contaminants in local and downstream surface and
ground waters
Monitor local ground and surface water levels
Calculate the volume of water used by source with a goal of 100% water re-use at all
facilities
11
Ibid.15.992 – Strategies for Sustainable Business
Sustainability Metrics for General Motors
Determine the emissions from vehicles manufactured
Energy Consumption
Recently, energy consumption and generation has been getting much attention around the
world. GM has demonstrated that it is a leader in many aspects of energy generation at its
manufacturing facilities. However, there is always room for improvement, and the team
determined that the following metrics should be adopted and tracked at GM facilities.
Suggested Metrics
Percentage of energy generated from renewable sources at each facility
Rate of internal recycling/energy recapture
Amount of energy generated from recapture and reuse
Dollars saved in energy efficiency investment
Degree of perfection for each unit produced (ratio of energy that actually went into
production of final product to the amount of energy actually used).
Total energy used annually per unit produced
Employee Involvement
In order to identify the most energy-intensive processes and devise ways, workarounds,
alternatives to improve efficiency, worker engagement is required. The team studied Raytheon,
who has recently implemented a program to increase their worker involvement. Highlights of
their program are as follows12:
Launched an Energy Citizen campaign to engage employees in energy conservation;
qualified almost 12,000 employees in the first quarter of 2009. This is 16.6% of
Raytheon’s total 72,000 employees
Further engaged employees through Energy Awareness Month and Earth Day
awareness events
Increased the Energy Champion network to more than 2,000 employees. This is
2.8% of Raytheon’s employees.
Applied Six Sigma focus to energy challenges through the Enterprise Energy Team
We believe that GM could benefit from a similar program.
Personal Health
Maintenance of a healthy workforce is another key necessity for a sustainable company. While
many industrialized countries have strict regulations that protect workers and ensure
compliance, companies must also develop their own goals and values in this area. This is
particularly important for companies with operations and/or suppliers in developing countries
where government regulation may not be as stringent or enforceable.
12
Raytheon. (2009, 5 13). Raytheon Sustainability. Retrieved 5 14, 2009, from Raytheon:
http://www.raytheon.com/responsibility/stewardship/sustainability/energy/index.html15.992 – Strategies for Sustainable Business
Sustainability Metrics for General Motors
Metrics to Adopt From Others
Timberland’s Human Rights Code of Conduct13
Timberland has adopted a Code of Conduct that is provided to all factories they have contracts
with, translated into the local language. The Code of Conduct includes the right to un-
announced visits to verify that the following guidelines are being followed:
Voluntary Employment
Freedom of Association
Fair and equal treatment for workers: environment free of corporal punishment and
discrimination based on social origin, social status, heritage, disability, age, marital
status, genetic features, sexual orientation, race, color, gender, religious preference,
political opinion and nationality
Child labor prohibitions for individuals younger than 16 years old
Compensation for regular work hours at a minimum to meet governing standards
Working Hours not exceeding 48 hours per six day period
Health and Safety workplace safety based on recognized standards of the ILO and
national laws, employee training on safe workplace practices
Other Timberland best practices include quarterly tracking the Lost Work Days due to Injury and
Illness rate (LWDII), and a full time Environmental Health and Safety (EHS) specialist. Other
Personnel Health initiatives include literacy and General Education Diploma (GED) classes,
employee hours served in community engagement, and charitable donations14.
HARBEC Plastics15 measures air safety, and holds regular safety training sessions and employs a
safety committee to minimize any work related injuries. They have a party to celebrate every
time that they reach 180 days with no loss time due to work related injuries.
Suggested Metrics
Employee blood lead levels (µg/100 mL)
Participation in health education and wellness programs, health certification-related
courses completed, and monthly on-site fitness equipment use
Percentage of employees trained in sustainability initiatives (the number
trained/the number to be trained)
Number of employee days away due to injury per shift and per manager
Number of employee days away due to exposure to toxins
Ratio of safety gear and safety showers to employees
Ratio of sick days to work days per facility
Number of safety measures adopted, safety/fail-safe equipment installations and
improvements per year and ROI per improvement
13
See Timberland’s website, http://www.timberland.com/corp/english_feb02.pdf
14
See Timberland’s Facility Report, http://www.timberland.com/include/COR34119-DR_Mini_fff.pdf
15
HARBEC Plastics, http://www.harbec.com/index.html15.992 – Strategies for Sustainable Business
Sustainability Metrics for General Motors
Health index of onsite food (cafeteria)
Number of paid days off per facility
Percentage of employees commuting, participating in subsidized public
transportation, or car-pooling to work per facility
Number of peer nominations for health and safety improvements per month
Number of complaints from public or employees (#/year)
Occupational Safety
Just like personal health, occupational safety requires close attention to ensure the quality of a
workforce.
Metrics to Adopt from Others
Many metrics around occupational safety are required to be measured and reported by
government agencies, such as OHSA. These include those that GM is already measuring and
reporting on their public website:
Recordable injury rate
Lost workday case rate
Looking at the OSHA 2007 report, GM has lower rates than the industry average of 6.9
recordable injuries and 1.4 days away cases in their sector of manufacturing transportation
equipment.16 Figure 6 shows the current rate and the impressive trend to reducing injury rate
year after year.
Figure 6: Recordable Injury Rate and Lost Workday Case Rate –
17
GM North American Facilities (2001-2007)
Some other metrics GM might want to consider reporting are:
Injury rate based on injury type, such as puncture, laceration, or strain
“safety champion” program
1-3 employees identified in each of the natural work groups
16
(United States Department of Labor, 2008)
17
Motors, G. (2009, 5 13). GM Website. Retrieved 5 13, 2009, from GM Website: http://www.gm.com/15.992 – Strategies for Sustainable Business
Sustainability Metrics for General Motors
Potential benefits:
Empower the employees with the knowledge to make safer choices for
themselves and coach their peers to do the same.
Revitalization of employee suggestions for improvement and for one
month or one week a month, the focus could be on safety
improvements.
Suggested Metrics
In addition to the metrics previously mentioned, another metrics to consider is the number of
times the line stops for a safety concern. There are numerous reasons the line might be
stopped by an employee, however tracking how many times it stops for a safety concern or
more immediate accident prevention. This metric would give some visibility to how many “near
misses” are occurring which is a much more difficult metric to mention.
Waste Management
This category accounts for the recycling and the disposal of all types of manufacturing wastes,
during and after the manufacturing process is complete.18
Suggested Metrics
Introduce company-wide waste management system, separating and recycling so as
to achieve zero waste in all plants and offices; extend to dealerships to provide
coherent company image.
Reuse all production wastewater through filtering. Saves water and reduces
chemical compounds (waste) discharged.
Spread dry or near-dry machining to all processes where feasible to reduce waste
generated by machining fluids and metal scrap.
Reduce compensated waste (nonhazardous waste plus what company pays to be
recycled) to 30 kg/vehicle.
Reduce waste by avoiding it. Rethink and redesign processes to reduce waste.
Reuse organic and other suitable waste by generating landfill gas.
Actively encourage suppliers to put in place active waste management, exploiting if
necessary synergies of scale with GM.
Engage specialists inside the plants to systematically explore ways to reduce waste
by optimizing and rethinking manufacturing processes, analyzing sources of waste,
and exploring alternative ways of doing things.
Find applications for waste or byproducts, suitability to sell them into scrap markets.
Manufacturing Costs
Reduced manufacturing costs can be provided by optimal use of machines and tooling including
jigs and fixtures.19 Additionally, measurements of key resources and consumables are required
to track efficiency and meet goals.
18
Jawahir, I. S. (2007).15.992 – Strategies for Sustainable Business
Sustainability Metrics for General Motors
Suggested Metrics
Monitor machine power consumption and optimize machine usage patterns; define
metrics to describe and drive machine power usage relative to parts production;
Track amount of scrap metal machined away by design, driving engineers to
optimize design and fabrication processes;
Track consumption of compressed air, operating fluids (actuator oils, etc.),
identifying and repairing leaks
Reuse or recycle parts packaging; track reduction
Reduce or eliminate protective coatings for transport (wax, etc); track reduction
Collect and recycle process material (i.e. sandblasting, cooling fluids, etc.); track
reuse
Summary and Conclusion
The team proceeded in thinking how the recommended metrics could be implemented in an
organization as large as GM, with the knowledge that companies that have most success at
sustainability are those that adopted a comprehensive, systemic approach to it.
First, an example of GM’s organizational structure was developed, as shown in Figure 7. Clearly,
different types of sustainability-related decisions and mandates are most appropriate for each
of the levels indicated on the left hand side. For example, while a plant might decide to increase
the amount of purchased energy that is from renewable sources in its vicinity, clearly the
decision of large capital outlays to build an efficient co-generation power station or a large solar
panel or wind installation is a corporate decision. Besides ensuring that among all branches and
regions of GM are measuring the same thing and striving towards the same goal, it is also
important to make those goals aggressive and widely communicated. Again, without engaging
the workforce at all levels, this effort will not endure and runs the risk of becoming the “newest
program” and not something the company is committed to at the core of its business.
19
Ibid.15.992 – Strategies for Sustainable Business
Sustainability Metrics for General Motors
Figure 7: Example of GM's Organizational Structure
The focus of this project was the development of metrics to ensure sustainable manufacturing.
As such, the team used the analysis performed to determine which metrics should be used by
GM, and built the image shown in Figure 8.
Figure 8: Proposed metrics for each major category in sustainable manufacturing15.992 – Strategies for Sustainable Business
Sustainability Metrics for General Motors
Finally, the team brainstormed the following list of recommendations for GM as they go forward
with choosing and implementing the metrics:
1. Choose a minimum number of relevant standards to cover every aspect of car
productions activity. We have provided an extensive list of potential metrics to use;
however, too many metrics can dilute the value of the important metrics, and decrease
the broad understanding of the strategy amount the workforce.
2. Educate the workforce to the chosen standards, and establish active implementation
groups. A realistic goal is for every UAW partner to be able to describe which metrics
are tracked, and why the metric is tracked both in manufacturing and by the GM
Corporate Office.
3. Systematic measurement to monitor progress and quantify improvement. By monitoring
progress, a continuous improvement mentality for sustainability can be established
throughout the manufacturing organization.
4. Complement measurement by regular and short-notice internal and external audit. To
both build credibility and encourage UAW participation and education, audits should be
performed.
5. Set metrics and goals following accepted third party or industry-wide practices. One of
the biggest challenges for metric tracking is the setting of goals in both the short and
long term. The team reviewed recommended metrics that are tracked by many of GM’s
competitors to establish any specific goals that were mentioned in this paper.
Additional research should be performed by GM, and the use of third party non-
governmental organizations (NGOs) could be consulted to determine the exact goal for
each metric.
Spread progress across the company’s operations, across geographies, divisions and sub-
divisions, subsidiaries, groups, etc. By disseminating information on goals, progress, and best
practices to multiple manufacturing facilities, GM can ensure that they become a best in class
manufacturing in term of sustainability.15.992 – Strategies for Sustainable Business Sustainability Metrics for General Motors References BRE. Sustainability Report 2006/2007. BRE: http://www.bre.co.uk/filelibrary/corporate/BRE/KN2960_Sustainability_Report_080807.pdf Eaton, R. J. (2009, 5 1). Getting the Most out of Environmental Metrics. Retrieved 5 1, 2009, from NAE: http://www.nae.edu/nae/bridgecom.nsf/weblinks/NAEW-4NHM88 General Motors. (March 10, 2009). Corporate Responsibility Report. Detroit, MI: GM Communications. General Motors. (April 20, 2009). General Motors Redefining Environmental Sustainability of its Plants. Detroit, MI: GM Communicatioins. General Motors. (2009, 5 13). GM Website. Retrieved 5 13, 2009, from GM Website: http://www.gm.com/ Jawahir, I. S. (2007). Sustainable Manufacturing Processes: New Challenges for Developing Predictive Models and Optimization Techniques. First International Conference on Sustainable Manufacturing (pp. 1-19). Montreal: Aerospace Manufacturing Technology Centre. Raytheon. (2009, 5 13). Raytheon Sustainability. Retrieved 5 14, 2009, from Raytheon: http://www.raytheon.com/responsibility/stewardship/sustainability/energy/index.html The National Institute of Standards and Technology (NIST). (n.d.). Retrieved May 14, 2009, from www.nist.gov
You can also read