Genetic and morphological variation of Vespa velutina nigrithorax which is an invasive species in a mountainous area
←
→
Page content transcription
If your browser does not render page correctly, please read the page content below
www.nature.com/scientificreports
OPEN Genetic and morphological
variation of Vespa velutina
nigrithorax which is an invasive
species in a mountainous area
Yuno Do1, Woong‑Bae Park1, Jun‑Kyu Park1, Chang‐Jun Kim2* & Moon Bo Choi3*
The yellow-legged hornet (Vespa velutina nigrithorax) is an invasive species in South Korea with
negative economic, ecological, and public health impacts. We investigated genetic and morphological
variation in the species populations on Mt. Jiri, the tallest mountain in South Korea. We hypothesized
that a high-altitude would be negatively correlated with the genetic diversity of the hornet
population, and hornet wing morphology would change with an increase in altitude. Our results
showed that the genetic diversity of yellow-legged hornets did not decrease as altitude increased.
Regardless of the altitude, the inbreeding coefficient was high at the newly colonized sites. A single
genetic population occurred in the mountainous areas examined and gradually expanded its range.
Wing morphology, especially shape, did not change with an increase in altitude or decrease in
temperature. Although snow cover and cool temperatures at high altitudes could limit nest-building
activities, they did not prevent the extension of the range of the species. Therefore, the yellow-legged
hornet cannot be controlled naturally by climate or topography; combined approaches, including
chemical control, nest removal, and bait-trapping techniques should be implemented.
The yellow-legged hornet (Vespa velutina nigrithorax), native to China, was introduced in South Korea in 2 0031
and it has rapidly colonized a large part of the c ountry2. The spread of V. velutina nigrithorax has had negative
economic, ecological, and public health effects3–5. However, approaches to control the species are still lacking
and need to be studied c ontinuously6.
High-altitude mountainous areas could serve as biogeographical barriers, as high altitudes may be negatively
correlated with the occurrence of the yellow-legged hornet7,8. In particular, low-temperature conditions and snow
cover in mountainous areas prevent the overwintering of mated queens. Nevertheless, the hornet is still found at
high altitudes in mountain sites in South Korea. The country has a high proportion of mountainous areas when
compared with other countries where the yellow-legged hornet successfully colonized, such as France, the UK,
and Spain. Human-mediated transportation may explain the nest distribution at considerable distances from
the invasion front; however, this dispersal may not be responsible for range expansion at high-altitude sites on
mountains9. Nests of the yellow-legged hornet are more frequently observed at the edges of the mountains than
at high-altitude sites; however, the hornet tends to gradually expand its range toward mountainous areas4. Inves-
tigating whether the yellow-legged hornet is genetically and morphologically responded to elevation gradients
in mountainous ranges could facilitate the establishment of effective control strategies for this invasive species.
In this study, we examined genetic and morphological variations in yellow-legged hornet populations that
have successfully colonized in the mountainous area in South Korea. We hypothesized that hornets at high-
altitude sites have less genetic variation than hornets that have colonized low-altitude sites because those popula-
tions would have colonized the areas relatively recently, and the low temperatures and snow cover may interrupt
overwintering and primary nesting after overwintering. This phenomenon can lead to isolated populations and
low genetic diversity, which may destabilize the population and act as a mechanism to control the distribution or
maintenance of the p opulation10–13. In addition, we hypothesized that hornets that have colonized high-altitude
sites have distinct wing morphology. Cold temperatures lower the wing beating frequency and thus power output,
resulting in reduced flight performance. If flight is vital for colony maintenance, and wing loading increases at
1
Department of Biological Sciences, Kongju National University, Gongju, Republic of Korea. 2Research Panning
and Coordination Team, Korea National Arboretum, Pocheon, Gyeonggi, Republic of Korea. 3Institute of Plant
Medicine, Kyungpook National University, Daegu, Republic of Korea. *email: changjunkim@korea.kr; kosinchoi@
hanmail.net
Scientific Reports | (2022) 12:4737 | https://doi.org/10.1038/s41598-022-08756-2 1
Vol.:(0123456789)
www.nature.com/scientificreports/
Group Na Ne Ho He I FIS h
G1 3.286 2.896 0.857 0.619 1.069 − 0.419 0.743
G2 2.857 2.365 0.619 0.54 0.903 − 0.203 0.562
G3 3.286 2.708 0.762 0.587 1.035 − 0.294 0.695
G4 2.571 2.188 0.762 0.532 0.838 − 0.45 0.648
G5 2.571 2.21 0.81 0.524 0.832 − 0.529 0.695
G6 2.429 2.19 0.619 0.468 0.758 − 0.329 0.686
G7 2.857 2.441 0.714 0.579 0.945 − 0.208 0.714
G8 2.714 2.39 0.619 0.54 0.882 − 0.116 0.61
G9 3 2.571 0.81 0.579 0.975 − 0.412 0.705
G10 2.857 2.42 0.714 0.571 0.933 − 0.199 0.648
G11 3 2.563 0.81 0.595 0.991 − 0.396 0.705
G12 2.571 2.363 0.714 0.508 0.826 − 0.36 0.638
G13 3 2.469 0.524 0.587 0.978 0.121 0.629
Overall 2.846 2.444 0.718 0.667 0.92 − 0.292 0.668
Table 1. Genetic diversity and diversity indices of yellow-legged hornets (Vespa velutina nigrithorax) based
on seven nuclear microsatellite loci estimated in 13 sampling sites: mean number of alleles ( NA), number
of effective alleles (NE), observed (HO) and expected (HE) heterozygosity, Shannon’s information index (I),
inbreeding coefficient relative to the population (FIS), and molecular diversity (h).
Figure 1. Correlation between the linearized pairwise FST and geographical distance for the 13 yellow-legged
hornet sampling sites in Mt. Jiri. The Mantel test revealed no significant genetic isolation based on geographical
distances among 13 sampling sites.
low temperatures, hornets could reduce wing loading by increasing wing s ize14. These morphological variations
interact with the population structure and must be elucidated to understand the distribution of species.
Results
Genetic diversity and diversity indices among hornets. The overall allele frequency (NA) across
seven loci and 39 yellow-legged hornet samples was 2.846 (2.49–3.286); the overall number of effective alleles
(NE) was 2.444 (2.188–2.896); overall observed heterozygosity (HO) was 0.718 (0.524–0.857); overall expected
heterozygosity (HE) was 0.667 (0.468–0.619); overall Shannon’s information index (I) was 0.920 (0.758–1.069);
overall inbreeding coefficient relative to the population was 0.292 (− 0.529 to 0.121); and overall molecular diver-
sity indices (number of different alleles, h) was 0.639 (0.562–0.743). In addition, overall inbreeding coefficient to
the population was − 0.292 (− 0.419 to 0.121, Table 1).
Genetic distances and population structures. The Mantel test showed no significant genetic isola-
tion (Mantel statistic r = − 0.006, p = 0.538) based on geographical distances among yellow-legged hornets from
the 13 sampling sites (Fig. 1). According to the constructed unweighted pair-group method with arithmetic
(UPGMA) tree, yellow-legged hornets from G13 were clearly separated from the other groups (Fig. 2a). How-
ever, the STRUCTURE analysis revealed that the population genetic structures of the yellow-legged hornets
Scientific Reports | (2022) 12:4737 | https://doi.org/10.1038/s41598-022-08756-2 2
Vol:.(1234567890)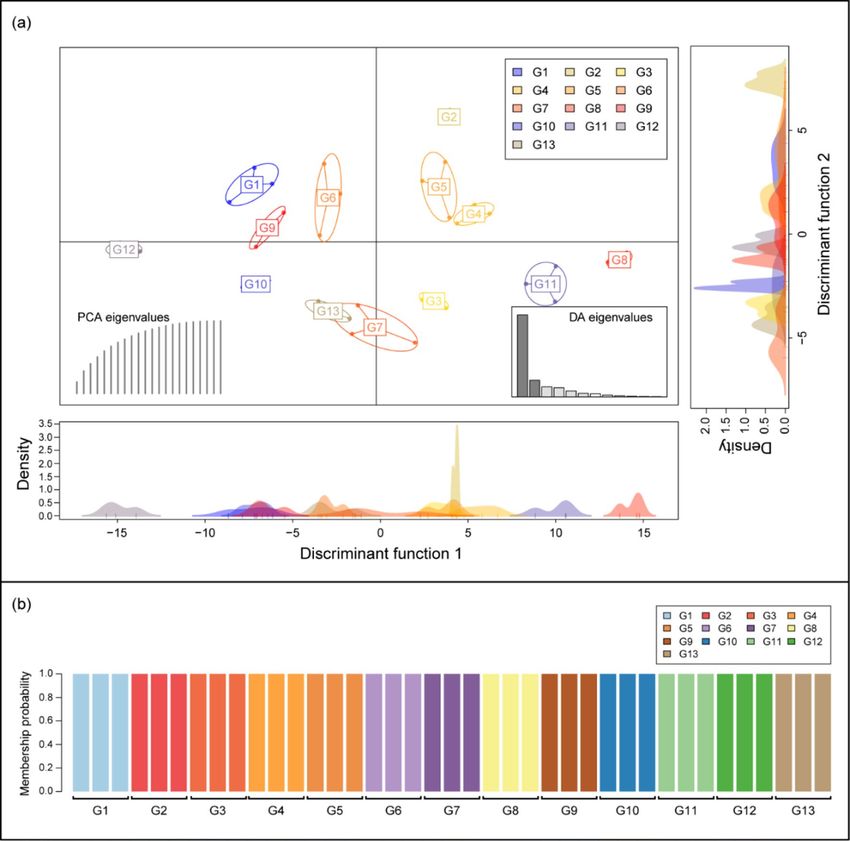
www.nature.com/scientificreports/
Figure 2. Results of Nei’s genetic distance and Bayesian clustering analysis in 39 yellow-legged hornets from 13
sites: (a) unweighted pair group method with arithmetic mean (Euclidean distance) tree among yellow-legged
hornets from 13 sampling sites; (b) population clusters obtained by STRUCTURE analysis in yellow-legged
hornets from 13 sampling sites.
were not different among the 13 sampling sites. The 39 yellow-legged hornets from all sites were grouped into
the same K-cluster (Fig. 2b). In Discriminant analysis of the principal components (DAPC), discriminant func-
tion 1 (DF1) explained 61.30%, and discriminant function 2 (DF2) explained 12.38% of the total genetic vari-
ation in the hornets. DF 1 indicated that yellow-legged hornets in G8, G11, and G12 were separated from the
other groups, and the rest were grouped into three clusters (G1, G9, G10/G6, G7, G13/G2, G3, G4, and G5).
Conversely, DF2 indicated that the hornets associated with G2 were isolated, whereas all the other groups were
grouped into successive clusters (Fig. 3a). Finer-scale structures detected through DAPC separated the yellow-
legged hornets from the 13 sites into 13 distinct groups (Fig. 3b).
Morphological differences in wing shape. Centroid size, which is a proxy for wing size, was signifi-
cantly different (one-way analysis of variance (ANOVA), F = 2.304, p = 0.036) among the hornets from the 13
sampling sites (Fig. 4). Wing size in G4 was significantly larger (Tukey test, p < 0.05) than wing size in G10. There
were no significant differences in wing size among the other groups.
Canonical variate analysis (CVA) results revealed two major morphological variations among the hornets
from 13 sampling sites based on the two major axes CV1 and CV2 (Fig. 5a, b). CV1 explained 32.11% of wing
morphological variance, and CV2 explained 20.20% of wing morphological variance. Changes in CV1 repre-
sent major variations in landmarks 3, 13, 8, and 9. As CV1 increases, the wing margin shape slightly changes.
Changes in CV2 represent the major variations in landmarks 3, 4, 9, 10, 13, and 16. The shape of the wing slightly
enlarges as CV2 increases. The wing shapes of hornets at each site were separated by CV1 and CV2 (Fig. 5c). CV1
(F = 45.22, p < 0.0001) and CV2 (F = 28.44, p < 0.0001) were significantly different among yellow-legged hornets
from the 13 groups. Hornets in groups G3, G5, G8, and G9 were distinct (Tukey test, p < 0.05) from all the other
groups based on CV1 (Fig. 5d). Based on CV2 (Tukey’s test, p < 0.05), hornets of groups at seven sites (G2, G4,
G6, G8, G9, G10, G13) were separated from those of other groups (Fig. 5e).
The morphological distance is expressed based on Procrustes distance from CVA (Table 2). Unlike direct
comparison of CV1 axis and CV2 axis, most of group did not have a significant morphological distance overall.
Significant morphological distances were found only in some groups. Wing shape in G7 was significantly distant
(p < 0.05) from that in G8. Wing shape in G10 was significantly distant (p < 0.05) from that in G11 and wing shape
in G13 was significantly distant (p < 0.05) from those in G7 and G8.
Discussion
The yellow-legged hornet is expanding its range in mountainous areas, regardless of altitude2. In the present study,
adult hornets were collected at altitudes as high as 1100 m a.s.l. in mountainous areas. In Italy, adult hornets
have been found at altitudes of 1200 m a.s.l, however, most nests of the yellow-legged hornet have been reported
within 700 m a. s. l.15. The yellow-legged hornet can be observed at such high altitudes because its colony foraging
radius is greater than 700 m 16. Furthermore, in autumn, when foraging activity is the greatest, workers are found
at sites relatively far from their n ests17. Although snow cover and cool temperatures at high altitudes could limit
Scientific Reports | (2022) 12:4737 | https://doi.org/10.1038/s41598-022-08756-2 3
Vol.:(0123456789)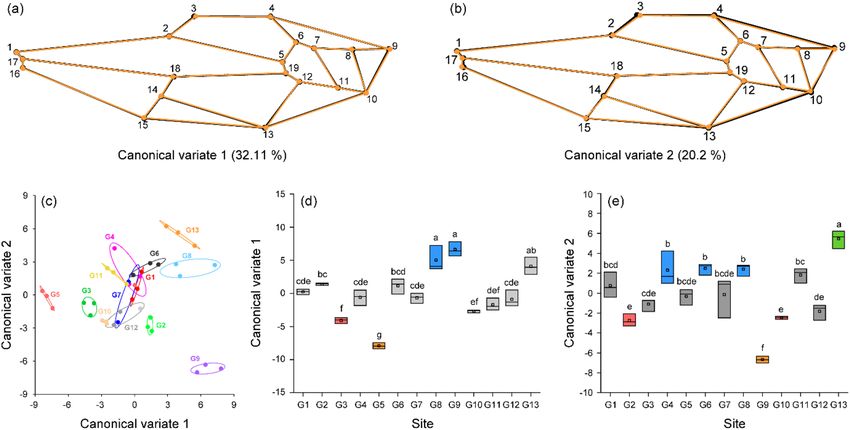
www.nature.com/scientificreports/
Figure 3. Results of population clustering by discriminant analysis of principal components (DAPC): (a) the
discriminant functions 1 (DF1) explained 61.30% of the genetic variation in yellow-legged hornets from 13
sites and DF 2 explained 12.38% of the variation. Each node represents the genotype of a yellow-legged hornet
connected to a centroid was assigned based on the clustering of the DAPC scores. (b) Membership probability of
DAPC determined that the sampled individuals were optimally clustered into 13 groups.
hornet nest-building activities, Mt. Jiri, the highest mountain in South Korea, has not prevented the extension
of the range of the yellow-legged hornet.
In this study, yellow-legged hornet genetic diversity did not decrease significantly with an increase in eleva-
tion. Yellow-legged hornet only exhibited a high inbreeding coefficient at a specific site. The high level of inbreed-
ing is consistent with the genetic bottleneck experienced by hornets following their introduction in South K orea18.
The genetic bottlenecks were not drastic enough to limit the expansion of the ranges of the yellow-legged hornet
into mountainous areas. In addition, the hornets are likely to experience temporary genetic bottlenecks at the
local level when expanding their colonies annually. In South Korea, there is a debate on whether the yellow-legged
hornet invaded from a single or several s ites19. In our study, although many hornets and nests were observed at
relatively lower altitudes, their genetic structure did not show altitude-specific patterns. The yellow-legged hornet
on Mt. Jiri appeared as a single population. The single genetic population is spreading at a slightly slower rate
than in other countries, without being restricted by mountainous areas as geographical barriers.
Yellow-legged hornets that expand their ranges across or into mountainous areas may have no morpho-
logical adaptations. Although intraspecific minor variability in wing morphology may exist in the population
investigated in the present study, wing morphology was not correlated with altitude. Additionally, yellow-legged
hornets prefer cooler highlands and mountains in their original habitats20. A decrease in temperature due to an
increase in altitude does not seem to be sufficient to alter wing shape. However, our study might be limited due
to insufficient number of samples at high altitudes. We conducted permutation tests to resolve this limitation.
Nevertheless, no altitude-specific pattern of morphological variation was observed. Our results demonstrated
Scientific Reports | (2022) 12:4737 | https://doi.org/10.1038/s41598-022-08756-2 4
Vol:.(1234567890)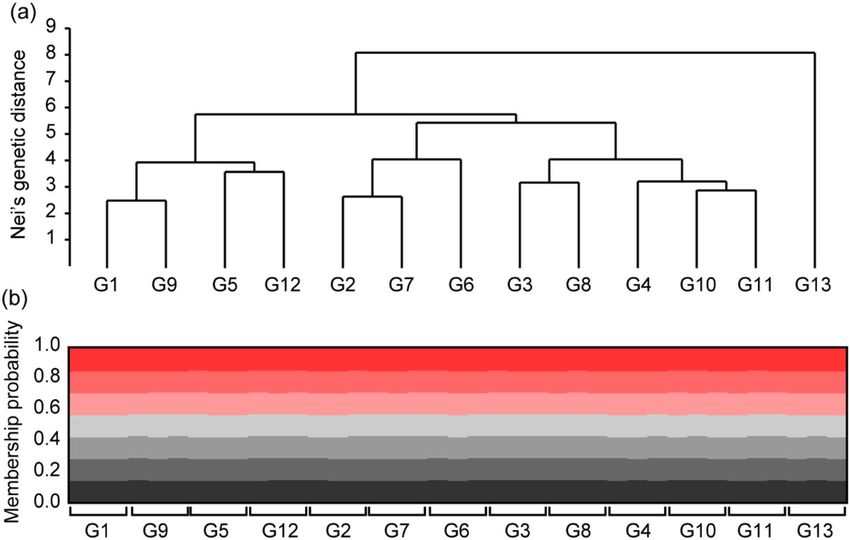
www.nature.com/scientificreports/

                                  Figure 4.  Comparison of centroid sizes in yellow-legged hornets based on landmark morphometrics analysis.
                                  The lines of the box graph represent the first quartile, median, and third quartile of the yellow-legged hornet.
                                  The transparent boxes represent average values. Lowercase letter and box color indicate differences (p < 0.05) in
                                  centroid size based on Tukey’s post-hoc tests.

                                  Figure 5.  Canonical variate analysis (CVA) and wireframe graph with 19 landmarks illustrating morphological
                                  variance in wing shape among yellow-legged hornet from 13 sites: (a) wireframe graph illustrating minor
                                  morphological differences based on canonical variate 1 (CV1). (b) Wireframe graph illustrating minor
                                  morphological variation based on CV2. The wireframe of black circle and line represents shape with minimum
                                  CV value in CV wireframe graph, and the wireframe of orange circle and line represents shape with maximum
                                  CV value. Morphological variations in the major axes CV1 and CV2 were hardly detected. (c) Scatterplots
                                  of CV1 and CV2 from CVA of 19 landmarks for 39 yellow-legged hornets from 13 sites. (d) Comparison of
                                  CV1 values among yellow-legged hornets from the 13 sampling sites. (e) Comparison of CV2 values among
                                  yellow-legged hornets from the 13 sampling sites. Lowercase letter and box color indicate significant differences
                                  (p < 0.05) in CV1 and CV2 based on Tukey’s post hoc test.

                                  genetic and morphological adaptations specific to altitude in the hornets of Mt. Jiri; however, an extension of
                                  these results may be dangerous.
                                     In conclusion, South Korea does not have a climate or topography that can naturally prevent the spread of
                                  wasps. In the early stages of the invasion of the yellow-legged hornet, the spread and establishment of the hornet
                                  in mountainous habitats was hampered by competition with an ecologically similar hornet, Vespa simillima4.

Scientific Reports |   (2022) 12:4737 |                https://doi.org/10.1038/s41598-022-08756-2                                                     5

                                                                                                                                              Vol.:(0123456789)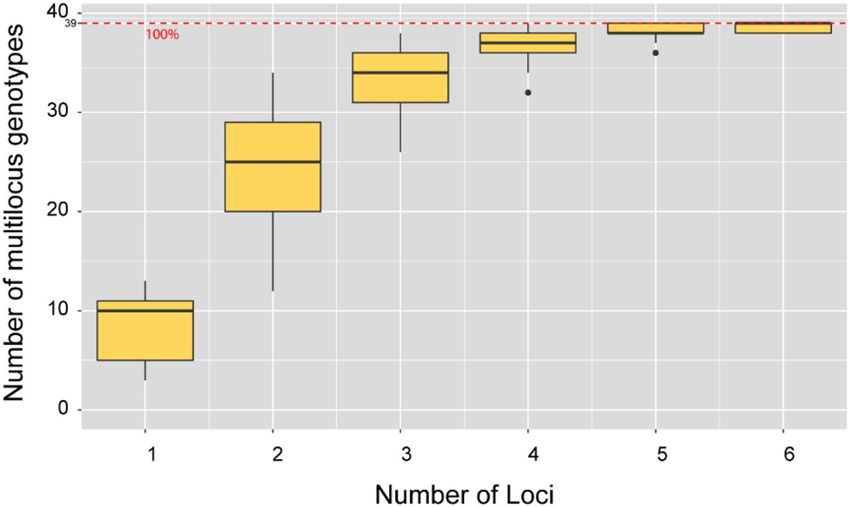
www.nature.com/scientificreports/

                                             G1      G2      G3        G4      G5       G6       G7          G8      G9      G10     G11     G12     G13

                                     G1              0.902   0.295     0.543   0.399    0.796    0.125       0.498   0.103   0.101   0.471   0.504   0.097

                                     G2      0.009           1.000     0.608   0.738    0.579    0.398       0.430   0.575   0.678   0.566   0.730   0.302

                                     G3      0.011   0.008             0.398   0.486    0.798    0.364       0.197   0.297   0.846   0.546   0.448   0.167

                                     G4      0.008   0.008   0.009             0.497    0.988    0.194   0.512       0.375   0.055   0.333   0.476   0.196

                                     G5      0.01    0.009   0.01      0.008            0.580    0.453   0.100       0.459   0.179   0.894   0.679   0.201

                                     G6      0.008   0.01    0.009     0.006   0.009             0.252   0.452       0.202   0.076   0.688   0.498   0.193

                                                                                                                                                              p-value
                                     G7      0.011   0.01    0.01      0.009   0.008    0.01                 0.034   0.398   0.290   0.641   0.468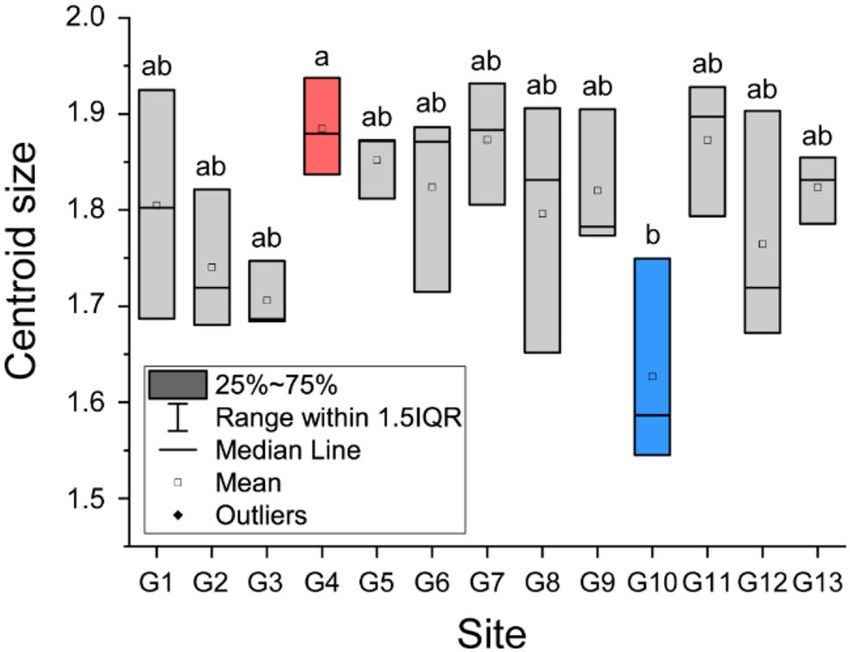
www.nature.com/scientificreports/
Figure 6. Thirteen yellow-legged hornet (Vespa velutina nigrithorax) sampling sites in Mt. Jiri National Park,
South Korea. White line represents the boundary of Mt. Jiri National Park. The colors on the map represent
elevation.
Group N Altitude Temperature
G1 3 385 13.2
G2 3 437 12.7
G3 3 523 12.1
G4 3 526 12.1
G5 3 542 11.8
G6 3 583 11.6
G7 3 650 11.1
G8 3 660 10.9
G9 3 726 10.5
G10 3 848 9.9
G11 3 962 9.4
G12 3 1042 8.9
G13 3 1185 8.1
Mean 3 697 10.9
Table 3. Sample size, elevations and temperatures of 13 sampling sites where yellow-legged hornets (Vespa
velutina nigrithorax) were collected. Avg. temperature indicates the average annual temperature in 2020 at the
sites, measured by the National Park Office of Jiri Mt.
The MS Excel add-in, GenAlEx version 6.524, and Arlequin version 3.525, were used to calculate genetic
diversity and diversity indices, namely mean number of alleles ( NA), effective number of alleles ( NE), observed
heterozygosity (HO), expected heterozygosity ( HE), Shannon’s information index (I), molecular diversity (h), and
inbreeding coefficient relative to the sub-population (FIS) of each population. The UPGMA based on Euclidean
distances was used to construct a dendrogram based on Nei’s genetic distances obtained using GenAlEx version
6.5, using PAST 326. Paired population differentiation (FST) was performed using Arlequin version 3.5. The lin-
earized FST value (FST/[1 − FST]) with geographic distance was used in the Mantel test (number of permutations:
999) to find evidence of genetic isolation by distance from the hornet using the ‘vegan’ package in R 27.
Bayesian clustering was performed using STRUCTURE version 2.3.428. STRUCTURE is an admixture model,
which allows us to confirm whether ancestors in population k have passed a portion of their genetic material to
individual i. Simulations (100,000) were performed in each analysis after an initial burn-in of 100,000 simula-
tions. We used the ΔK method29 in STRUCTURE H arvester30, which supported the estimation of the best‐identi-
fied k value. The range of one to 14 possible clusters with three independent runs each was employed in STRU
CTURE Harvester. In the STRUCTURE harvest analysis results, the best-supported K value among hornets
across 13 populations was identified as 7 (Fig. 8).
DAPC31, which is a multivariate clustering algorithm, was used to analyze the population structures of 39
hornets from 13 sites using the “adegenet” package in R 32. The analysis describes the greatest amount of variation
through a discriminant function representing a linear combination of correlated alleles in a linear discriminant
analysis based on principal components generated after reducing the dimension of the genetic variation using
Scientific Reports | (2022) 12:4737 | https://doi.org/10.1038/s41598-022-08756-2 7
Vol.:(0123456789)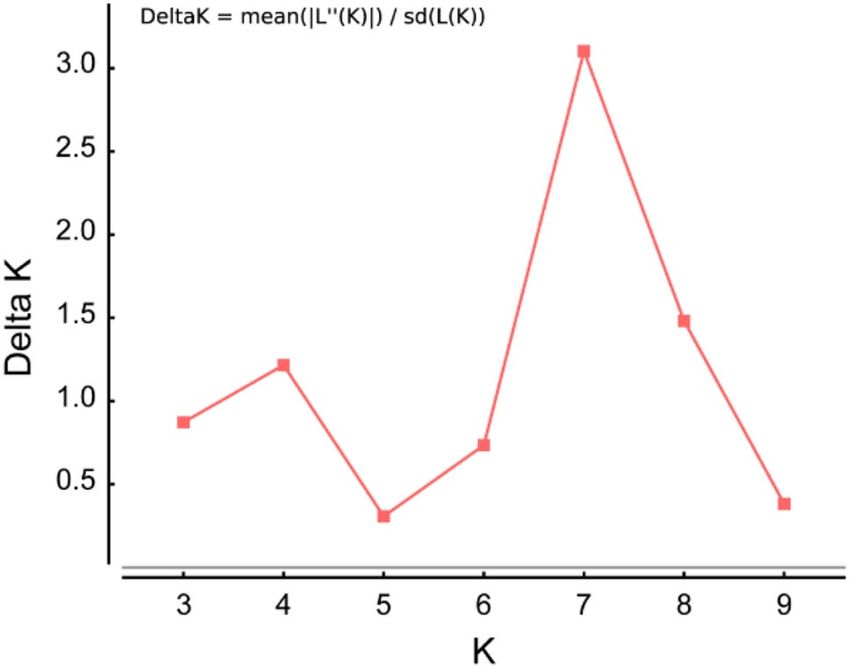
www.nature.com/scientificreports/
Figure 7. Number of multilocus genotypes based on number of loci from 39 individual of yellow-legged
hornet. When the number of loci was 6 or more, the 39 individuals could be separated about 100%.
Figure 8. Optimal k-means for STRUCTURE analysis obtained by the ΔK (delta K) method in STRUCTU
RE harvest. Here, 100,000 simulations after burn-in of 100,000 simulations were used to obtain the three
independent runs for range of 2 to 14 possible clusters. The highest delta K value was 7 (3.102).
principal component a nalysis33. The method was used to determine how distinct each population among the
13 sites was.
Morphological analysis. Landmark-based geometric morphometrics were used to analyze the wing
shapes of the hornets. T psDig34 was used to digitize the 19 landmark points in the wing vein (Fig. 9). Morpho J
version 1.07a (Manchester, UK) was used to convert the digitized landmark coordinates into Procrustes coordi-
nates. Centroid size, which used the size proxy in landmark m orphometrics35, was measured to compare wing
sizes among the 13 groups. CVA was used to compare morphological differences among the 13 groups and to
calculate the f contribution (%) of each canonical variate (CV) in CVA. Variation in wing shape among the hor-
nets from 13 sites was visualized in a wireframe graph along the first two (CV1 and CV2) axes. We also identified
the values and significant distances of the Procrustes from CVA to explore the morphological similarity between
groups. Significant morphological distances were obtained using CVA after 10,000 permutation rounds. One-
way ANOVA was used to test significant differences in centroid size, CV1, and CV2, among the hornets using
GraphPad Prism version 7.0 for Windows (GraphPad Software, San Diego, USA). When significant differences
were found in the ANOVA test, Tukey’s post hoc tests were performed. All differences were considered signifi-
cant at p < 0.05.
Scientific Reports | (2022) 12:4737 | https://doi.org/10.1038/s41598-022-08756-2 8
Vol:.(1234567890)www.nature.com/scientificreports/
Figure 9. Locations of the landmark coordinates in the right forewings of a yellow-legged hornet. Nineteen
landmarks were designated in the wing vein.
Received: 21 September 2021; Accepted: 15 February 2022
References
1. Kim, J. K., Choi, M. B. & Moon, T. Y. Occurrence of Vespa velutina Lepeletier from Korea, and a revised key for Korean Vespa
species (Hymenoptera: Vespidae). Entomol. Res. 36, 112–115 (2006).
2. Choi, M. B., Martin, S. J. & Lee, J. W. Distribution, spread, and impact of the invasive hornet Vespa velutina in South Korea. J.
Asia-Pac. Entomol. 15, 473–477 (2012).
3. Do, Y. et al. Quantitative analysis of research topics and public concern on V. velutina as invasive species in Asian and European
countries. Entomol. Res. 49, 456–461 (2019).
4. Kwon, O. & Choi, M. B. Interspecific hierarchies from aggressiveness and body size among the invasive alien hornet, Vespa velutina
nigrithorax, and five native hornets in South Korea. PLoS ONE 15, e0226934 (2020).
5. Choi, M. B. Foraging behavior of an invasive alien hornet (Vespa velutina) at Apis mellifera hives in Korea: Foraging duration and
success. Entomol. Res. 51, 143–148 (2021).
6. Turchi, L. & Derijard, B. Options for the biological and physical control of Vespa velutina nigrithorax (Hym.: Vespidae) in Europe:
A review. J. Appl. Entomol. 142, 553–562 (2018).
7. Bessa, A. S., Carvalho, J., Gomes, A. & Santarém, F. Climate and land-use drivers of invasion: Predicting the expansion of Vespa
velutina nigrithorax into the Iberian Peninsula. Insect Conserv. Divers. 9, 27–37 (2016).
8. Rodríguez-Flores, M. S., Seijo-Rodríguez, A., Escuredo, O. & del Carmen Seijo-Coello, M. Spreading of Vespa velutina in northwest-
ern Spain: Influence of elevation and meteorological factors and effect of bait trapping on target and non-target living organisms.
J. Pest Sci. 92, 557–565 (2019).
9. Robinet, C., Darrouzet, E. & Suppo, C. Spread modelling: A suitable tool to explore the role of human-mediated dispersal in the
range expansion of the yellow-legged hornet in Europe. Int. J. Pest Manag. 65, 258–267 (2019).
10. Saunders, D. A., Hobbs, R. J. & Margules, C. R. Biological consequences of ecosystem fragmentation: A review. Conserv. Biol. 5,
18–32 (1991).
11. Ellstrand, N. C. & Elam, D. R. Population genetic consequences of small population size: Implications for plant conservation.
Annu. Rev. Ecol. Evol. Syst. 24, 217–242 (1993).
12. Young, A., Boyle, T. & Brown, T. The population genetic consequences of habitat fragmentation for plants. Trends Ecol. Evol. 11,
413–418 (1996).
13. Hughes, A. R. & Stachowicz, J. J. Genetic diversity enhances the resistance of a seagrass ecosystem to disturbance. Proc. Natl. Acad.
Sci. 101, 8998–9002 (2004).
14. Dudley, R. The Biomechanics of Insect Flight: Form, Function, Evolution (Princeton University Press, 2002).
15. Porporato, M., Manino, A., Laurino, D. & Demichelis, D. Vespa velutina Lepeletier (Hymenoptera Vespidae): A first assessment 2
years after its arrival in Italy. Redia 97, 189–194 (2014).
16. Sauvard, D., Imbault, V. & Darrouzet, É. Flight capacities of yellow-legged hornet (Vespa velutina nigrithorax, Hymenoptera:
Vespidae) workers from an invasive population in Europe. PLoS ONE 13, e0198597 (2018).
17. Monceau, K., Bonnard, O., Moreau, J. & Thiéry, D. Spatial distribution of Vespa velutina individuals hunting at domestic honeybee
hives: Heterogeneity at a local scale. Insect Sci. 21, 765–774 (2014).
18. Choi, M. B., Lee, S. A., Suk, H. Y. & Lee, J. W. Microsatellite variation in colonizing populations of yellow-legged Asian hornet,
Vespa velutina nigrithorax, South Korea. Entomol. Res. 43, 208–214 (2013).
19. Jeong, J. S. et al. Tracing the invasion characteristics of the yellow-legged hornet, Vespa velutina nigrithorax (Hymenoptera: Vespi-
dae), in Korea using newly detected variable mitochondrial DNA sequences. J. Asia-Pac. Entomol. 24(2), 135–147 (2021).
20. Villemant, C. et al. Predicting the invasion risk by the alien bee-hawking Yellow-legged hornet Vespa velutina nigrithorax across
Europe and other continents with niche models. Biol. Conserv. 144, 2142–2150 (2011).
21. Kishi, S. & Goka, K. Review of the invasive yellow-legged hornet, Vespa velutina nigrithorax (Hymenoptera: Vespidae), in Japan
and its possible chemical control. Appl. Entomol. Zool. 52, 361–368 (2017).
22. Arca, M. et al. Development of microsatellite markers for the yellow-legged Asian hornet, Vespa velutina, a major threat for Euro-
pean bees. Conserv. Genet. Resour. 4, 283–286 (2012).
23. Rousset, F. genepop’007: A complete re-implementation of the genepop software for Windows and Linux. Mol. Ecol. Res. 8, 103–106
(2008).
24. Peakall, P. & Smouse, R. GenAlEx 6.5: Genetic analysis in Excel. Population genetic software for teaching and research—An update.
Bioinformatics 28, 2537 (2012).
25. Excoffier, L. & Lischer, H. E. Arlequin suite ver 3.5: A new series of programs to perform population genetics analyses under Linux
and Windows. Mol. Ecol. Resour. 10, 564–567 (2010).
Scientific Reports | (2022) 12:4737 | https://doi.org/10.1038/s41598-022-08756-2 9
Vol.:(0123456789)www.nature.com/scientificreports/
26. Hammer, Ø., Harper, D. A. & Ryan, P. D. PAST: Paleontological statistics software package for education and data analysis. Palae-
ontol. Electron. 4, 9 (2001).
27. Oksanen, J. et al. The vegan package. 10, 719 (2007).
28. Pritchard, J. K., Stephens, M. & Donnelly, P. Inference of population structure using multilocus genotype data. Genetics 155,
945–959 (2000).
29. Evanno, G., Regnaut, S. & Goudet, S. Detecting the number of clusters of individuals using the software STRUCTURE: A simula-
tion study. Mol. Ecol. Resour. 14, 2611–2620 (2005).
30. Earl, D. A. STRUCTURE HARVESTER: A website and program for visualizing STRUCTURE output and implementing the Evanno
method. Conserv. Genet. Resour. 4, 359–361 (2012).
31. Jombart, T., Devillard, S. & Balloux, F. Discriminant analysis of principal components: A new method for the analysis of genetically
structured populations. BMC Genet. 11, 94 (2010).
32. Jombart, T. Adegenet: A R package for the multivariate analysis of genetic markers. Bioinformatics 24, 1403–1405 (2008).
33. Waraniak, J. M., Fisher, J. D., Purcell, K., Mushet, D. M. & Stockwell, C. A. Landscape genetics reveal broad and fine-scale popula-
tion structure due to landscape features and climate history in the northern leopard frog (Rana pipiens) in North Dakota. Ecol.
Evol. 9, 1041–1060 (2019).
34. Rohlf, F. J. tpsDig, version 2.10. http://life.bio.sunysb.edu/morph/index.html (2006).
35. Zimmermann, G. et al. Geometric morphometrics of carapace of Macrobrachium australe (Crustacea: Palaemonidae) from Reunion
Island. Acta Zool. 93, 492–500 (2012).
Acknowledgements
This research was supported by the National Research Foundation of Korea (NRF) grant funded by the Korean
government (MSIT) (no. 2018R1C1B3008645). This research was funded by the Korea National Arbore-
tum, (Project No. KNA 1-1-25, 19-1), Korea Forest Service and Korea National Park Research Institute (No.
NPRI-2018-45).
Author contributions
Y.D.: conceptualization, methodology, project administration, validation, roles/writing—original draft. W.-B.P.:
formal analysis, software, visualization, roles/writing—original draft. J.-K.P.: formal analysis, data curation, soft-
ware, visualization, roles/writing—original draft. C.‐J.K.: funding acquisition, project administration, resources,
writing—review and editing. M.B.C.: investigation, methodology, supervision, writing—review and editing.
Competing interests
The authors declare no competing interests.
Additional information
Correspondence and requests for materials should be addressed to C.K. or M.B.C.
Reprints and permissions information is available at www.nature.com/reprints.
Publisher’s note Springer Nature remains neutral with regard to jurisdictional claims in published maps and
institutional affiliations.
Open Access This article is licensed under a Creative Commons Attribution 4.0 International
License, which permits use, sharing, adaptation, distribution and reproduction in any medium or
format, as long as you give appropriate credit to the original author(s) and the source, provide a link to the
Creative Commons licence, and indicate if changes were made. The images or other third party material in this
article are included in the article’s Creative Commons licence, unless indicated otherwise in a credit line to the
material. If material is not included in the article’s Creative Commons licence and your intended use is not
permitted by statutory regulation or exceeds the permitted use, you will need to obtain permission directly from
the copyright holder. To view a copy of this licence, visit http://creativecommons.org/licenses/by/4.0/.
© The Author(s) 2022
Scientific Reports | (2022) 12:4737 | https://doi.org/10.1038/s41598-022-08756-2 10
Vol:.(1234567890)You can also read