Forensic and genetic characterizations of diverse southern Thai populations based on 15 autosomal STRs
←
→
Page content transcription
If your browser does not render page correctly, please read the page content below
www.nature.com/scientificreports
OPEN Forensic and genetic
characterizations of diverse
southern Thai populations based
on 15 autosomal STRs
Metawee Srikummool1,8, Suparat Srithawong2,8, Kanha Muisuk3, Sukrit Sangkhano4,
Chatmongkon Suwannapoom5, Jatupol Kampuansai6,7 & Wibhu Kutanan2*
Southern Thailand is home to various populations; the Moklen, Moken and Urak Lawoi’ sea nomads
and Maniq negrito are the minority, while the southern Thai groups (Buddhist and Muslim) are the
majority. Although previous studies have generated forensic STR dataset for major groups, such
data of the southern Thai minority have not been included; here we generated a regional forensic
database of southern Thailand. We newly genotyped common 15 autosomal STRs in 184 unrelated
southern Thais, including all minorities and majorities. When combined with previously published data
of major southern Thais, this provides a total of 334 southern Thai samples. The forensic parameter
results show appropriate values for personal identification and paternity testing; the probability of
excluding paternity is 0.99999622, and the combined discrimination power is 0.999999999999999.
Probably driven by genetic drift and/or isolation with small census size, we found genetic distinction
of the Maniq and sea nomads from the major groups, which were closer to the Malay and central Thais
than the other Thai groups. The allelic frequency results can strength the regional forensic database in
southern Thailand and also provide useful information for anthropological perspective.
Southern Thailand lies on the Malay Peninsula, bordering the Gulf of Thailand to the East, the Andaman Sea to
the West, and Malaysia to the South. A census size of ~ 9.16 million in southern Thailand is about 13.35% of the
total census size of the country (68.61 million in 2020)1. Most people are southern Thai Buddhists (66%) and
southern Thai Muslims (33%), while the minorities, e.g. sea nomad and Maniq groups account for about 0.33%2.
The populations of the three groups of sea nomads are 4000, 2000 and 3000 for Moklen, Moken and Urak Lawoi’,
respectively, while only 250 were recorded for the Maniq1,2. The languages spoken in southern Thailand belong-
ing to three linguistic families: Tai-Kadai (TK), Austroasiatic (AA) and Austronesian (AN). The AA-speaking
Maniq who are scattered through the jungle are regarded as the indigenous people of Southeast Asia or often
referred to “negritos” because of their phenotypic difference and traditional mode of subsistence practice that is
hunter-gatherers3. The AN-speaking sea nomads were used to subsist through maritime foraging in most of the
year, although nowadays they prefer to settle in the coastal area of Thailand and Myanmar4. Both Maniq and sea
nomads were minority groups and thought to be native in southern Thailand since prehistorical time, together
with the other groups, e.g. AA-speaking Mon and Khmer before the occupation of the AN-speaking Malays
and TK-speaking Thais, thought the Mon and Khmer people are nowadays disappear in southern Th ailand5.
The autosomal short tandem repeats (STRs) show a number of advantages for both population genetic and
forensic studies, i.e. distribution across the human genome which led to escape from natural selection, highly
polymorphism and informativeness to distinguish recently diverged populations6,7. In Thailand, studies on foren-
sic microsatellites and also other markers have focused on northern, northeastern and central Thailand leaving
the southern region understudied8–12. The only one study on autosomal STRs in southern Thailand indicated
1
Department of Biochemistry, Faculty of Medical Science, Naresuan University, Phitsanulok 65000,
Thailand. 2Department of Biology, Faculty of Science, Khon Kaen University, Khon Kaen 40002,
Thailand. 3Department of Forensic Medicine, Faculty of Medicine, Khon Kaen University, Khon Kaen 40002,
Thailand. 4School of Public Health, Walailak University, Nakhon Si Thammarat 80161, Thailand. 5School of
Agriculture and Natural Resources, University of Phayao, Phayao 56000, Thailand. 6Department of Biology, Faculty
of Science, Chiang Mai University, Chiang Mai 50202, Thailand. 7Research Center in Bioresources for Agriculture,
Industry and Medicine, Chiang Mai University, Chiang Mai 50202, Thailand. 8These authors contributed equally:
Metawee Srikummool and Suparat Srithawong. *email: wibhu@kku.ac.th
Scientific Reports | (2022) 12:655 | https://doi.org/10.1038/s41598-021-04646-1 1
Vol.:(0123456789)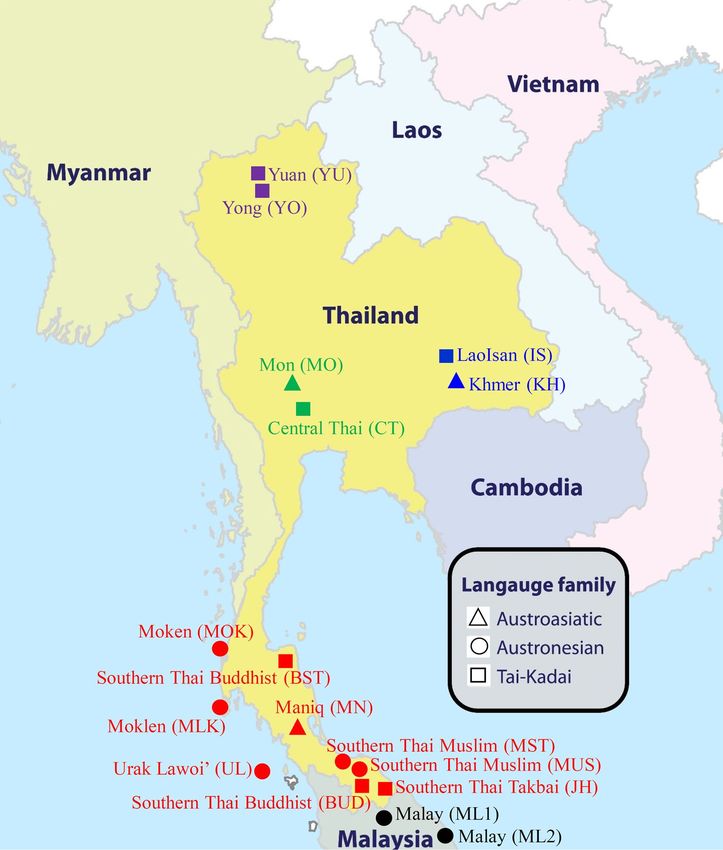
www.nature.com/scientificreports/
Gene
diversity
Population Code Sample size Location Language References Average HE Total allele (S.D.)
Southern Thai Southern
JH 40 Tai-Kadai Present study 0.7826 117 0.7786 (0.3949)
Takbai Thailand
Southern Thai Southern
MST 22 Austronesian Present study 0.7903 109 0.7759 (0.3994)
Muslim Thailand
Southern Thai Southern
BST 52 Tai-Kadai Present study 0.7963 125 0.7943 (0.4012)
Buddhist Thailand
Southern
Maniq MN 15 Austroasiatic Present study 0.6742 73 0.6742 (0.3526)
Thailand
Southern
Moklen MLK 22 Austronesian Present study 0.7535 97 0.7535 (0.3869)
Thailand
Southern
Urak Lawoi’ UL 29 Austronesian Present study 0.7532 102 0.7469 (0.3816)
Thailand
Southern
Moken MOK 4 Austronesian Present study 0.7238 55 0.7238 (0.4202)
Thailand
Southern Thai Southern
MUS 104 Austronesian 13
0.7876 137 0.7860 (0.3953)
Muslim Thailand
Southern Thai Southern 13
BUD 46 Tai-Kadai 0.7858 121 0.7837 (0.3966)
Buddhist Thailand
14
Malay ML1 110 Malaysia Austronesian 0.7942 144 0.7942 (0.3991)
14
Malay ML2 246 Malaysia Austrone sian 0.7962 163 0.7962 (0.3990)
Northern 8
Yuan YU 135 Tai-Kadai 0.7839 136 0.7839 (0.3939)
Thailand
Northern 8
Yong YO 55 Tai-Kadai 0.7758 125 0.7758 (0.3922)
Thailand
Central Thai- 12
Central Thai CT 246 Tai-Kadai 0.7916 151 0.7854 (0.3939)
land
Central Thai- 12
Mon MO 92 Austroasiatic 0.7913 137 0.7745 (0.3901)
land
Northeastern 11,37
Khmer KH 48 Austroasiatic 0.7589 114 0.7589 (0.3846)
Thailand
Northeastern 11
Lao Isan IS 272 Tai-Kadai 0.7844 167 0.7669 (0.3851)
Thailand
Table 1. General information and results on genetic diversities of the studied and compared populations.
that the Thai-Malay Muslim and Thai Buddhist who lived in the five deep Southern Thai provinces had non-
ifference13.
significant genetic d
In addition, there were some other genetic studies on southern Thai populations using uni-parentally inher-
ited markers3,4. The mitochondrial (mt) DNA investigation of the Moken showed ancient basal mtDNA hap-
logroup M21d and M46 with very low genetic diversity4. The basal mtDNA haplogroup M21a, R21 and M17a
and Y chromosomal haplogroup K were also observed in the Maniq as well as close genetic affinity between the
Maniq and other indigenous people of Southeast Asia in Malaysia, reflecting an ancient ancestry of the Maniq
and common genetic ancestry of indigenous people of Southeast Asia in the Malay P eninsula3.
To expand the genetic studies in southern Thailand, we reported genotypes of 15 autosomal STRs of seven
southern Thai populations: one AA-speaking Maniq, four AN-speaking Moklen, Moken, Urak Lawoi’ and south-
ern Thai Muslim and two TK-speaking southern Thai Buddhist and southern Thai Takbai. We explored genetic
structure and relationships of southern Thai populations with other Thai and Malaysian populations8,10–14. In
addition, because the forensic database combined diverse southern Thai populations has not yet been established,
we created a regional DNA database of 15 autosomal STRs of southern Thailand.
Results and discussions
Genetic diversities and forensic parameters. Raw genotypic data of 15 STRs of 334 southern Thai
samples are provided in Table S1. Total genetic diversity of all southern Thai samples was 0.7871 ± 0.3945,
whereas that in individual populations ranged from 0.6742 ± 0.3526 in the Maniq to 0.7943 ± 0.4012 in southern
Thai Buddhist (Table 1). The reduced genetic diversity of the Maniq is possibly driven by genetic drift associated
with geographic isolation and very small population sizes, as reported previously3. When the genetic diversity
calculated form the same marker set was compared between two hunter-gatherer groups in Thailand, the Maniq
from the South had diversity value greater than the Mlabri from the North (0.547 ± 0.288)15 although the sample
size of Maniq (n = 15) is lower than the Mlabri (n = 19). Also the genetic diversity results of these 15 STRs of ~ 70
Thai populations8–13,15 revealed that the Mlabri had the lowest genetic diversity, indicating a strong genetic drift
of the Mlabri. Regarding the sea nomads and excluding the Moken due to their small sample size, the Moklen
and Urak Lawoi’ showed lower genetic diversity than other Thai and Malaysian populations (Table 1), reflecting
certain degree of genetic drift.
Scientific Reports | (2022) 12:655 | https://doi.org/10.1038/s41598-021-04646-1 2
Vol:.(1234567890)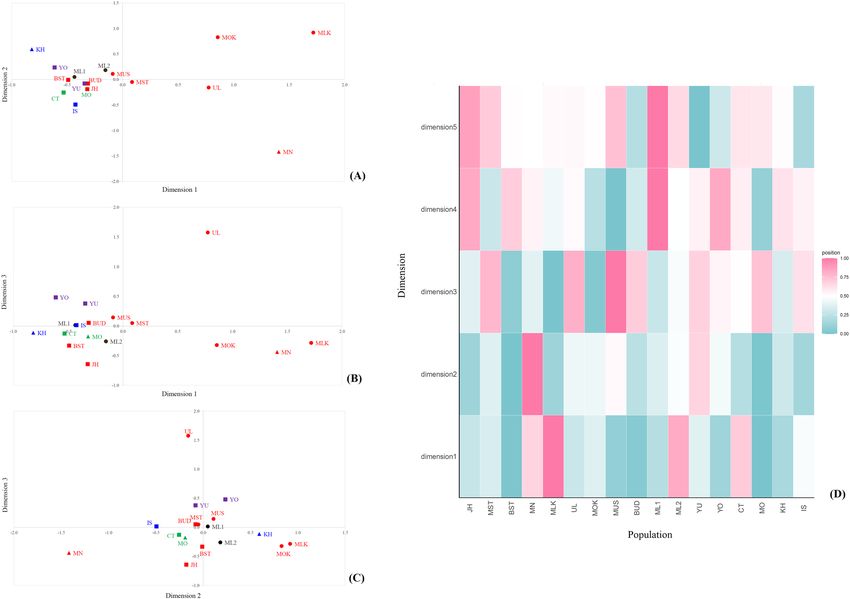
www.nature.com/scientificreports/
Allele D8S1179 D21S11 D7S820 CSF1PO D3S1358 THO1 D13S317 D16S539 D2S1338 D19S433 VWA TPOX D18S51 D5S818 FGA
6 0.1199
7 0.0195 0.2849 0.0015 0.0180
8 0.0060 0.2628 0.0015 0.1229 0.3584 0.0135 0.5472 0.0390
9 0.0766 0.0150 0.3613 0.1009 0.1512 0.0075 0.1439
9.3 0.0570
10 0.1362 0.1757 0.2096 0.0495 0.1431 0.1347 0.0405 0.0045 0.2444
11 0.0734 0.2808 0.2859 0.0045 0.2063 0.3220 0.0060 0.0030 0.2429 0.0045 0.2684
12 0.1332 0.1547 0.3982 0.0030 0.1566 0.2246 0.0510 0.0240 0.1078 0.2729
12.2 0.0075
13 0.1826 0.0255 0.0704 0.0015 0.0301 0.1287 0.2144 0.0045 0.1228 0.1409
13.2 0.0390
14 0.1991 0.0015 0.0105 0.0526 0.0030 0.0210 0.2594 0.2054 0.1542 0.0165
14.2 0.1005
15 0.1677 0.0030 0.0090 0.3083 0.0015 0.0045 0.0960 0.0420 0.2500 0.0015
15.2 0.1694
16 0.0793 0.3353 0.0075 0.0270 0.1319 0.1632 0.0015
16.2 0.0195
17 0.0210 0.2211 0.1124 0.0015 0.3253 0.0644
17.2 0.0015
18 0.0015 0.0767 0.0930 0.1829 0.0434 0.0060
19 0.0015 0.2069 0.0855 0.0269 0.0663
20 0.1139 0.0180 0.0284 0.0738
20.2 0.0045
21 0.0225 0.0015 0.0105 0.1852
21.2 0.0120
22 0.0570 0.0150 0.1807
22.2 0.0045
23 0.1814 0.0030 0.1446
23.2 0.0075
24 0.1214 0.1581
24.2 0.0105
25 0.0660 0.0015 0.0904
25.2 0.0015
26 0.0180 0.0316
26.2 0.0015
27 0.0060 0.0136
28 0.0465 0.0030
28.2 0.0015
29 0.2549
30 0.2369
30.2 0.0300
30.3 0.0015
31 0.0705 0.0015
31.2 0.0840
32 0.0165
32.2 0.1574
32.3 0.0015
33 0.0015
33.2 0.0765
34.2 0.0150
No. alleles 10 15 9 8 8 7 8 8 11 14 10 6 15 7 21
HO 0.8204 0.8198 0.7598 0.6856 0.7078 0.7147 0.7613 0.7934 0.8499 0.8168 0.7898 0.6547 0.8264 0.7598 0.8852
HE 0.8517 0.8342 0.7916 0.7115 0.7363 0.7543 0.7737 0.7889 0.8683 0.8348 0.7932 0.6201 0.8537 0.7730 0.8690
HWE 0.1551 0.5497 0.4782 0.0452 0.7972 0.3155 0.1199 0.2903 0.7775 0.0004 0.0414 0.0060 0.0027 0.9449 0.1458
MP 0.0592 0.0543 0.0738 0.1392 0.1787 0.0953 0.0874 0.0821 0.0327 0.0754 0.0879 0.2037 0.0487 0.0888 0.0374
PD 0.9408 0.9457 0.9262 0.8608 0.8213 0.9047 0.9126 0.9179 0.9673 0.9246 0.9121 0.7963 0.9513 0.9112 0.9626
Continued
Scientific Reports | (2022) 12:655 | https://doi.org/10.1038/s41598-021-04646-1 3
Vol.:(0123456789)www.nature.com/scientificreports/
Allele D8S1179 D21S11 D7S820 CSF1PO D3S1358 THO1 D13S317 D16S539 D2S1338 D19S433 VWA TPOX D18S51 D5S818 FGA
PIC 0.8020 0.8069 0.7578 0.6533 0.5884 0.7164 0.7393 0.7538 0.8529 0.7760 0.7415 0.5672 0.8317 0.7348 0.8492
PE 0.6462 0.6224 0.5241 0.3978 0.3121 0.4514 0.5281 0.5834 0.6946 0.5757 0.5455 0.3616 0.6873 0.5306 0.7588
TPI 2.8571 2.6667 2.0688 1.5619 1.3065 1.7526 2.0886 2.3986 3.3300 2.3509 2.1786 1.4478 3.2500 2.1013 4.2368
Table 2. Allele frequencies of total southern Thais based on the 15 autosomal STR loci (n = 334). No. alleles,
number of allele; HO, observed heterozygosity; HE, expected heterozygosity; HWE, Hardy–Weinberg p value;
MP, matching probability; PD, power of discrimination; PIC, po ly mo r p h ic i nformation content; power of
discrimination; TPI, total paternity index; GD, gene diversity; CMP, combined matching probability; CPD,
combine power d isc rim in ation; CPE, combined pow er discrimination.
When genotype data of total 334 southern Thai samples were combined and calculated the allelic frequency
for the 15 STR loci (Table 2), there are two loci (D19S433 and D18S51) that depart from the Hardy–Weinberg
equilibrium (HWE) even after applying Bonferoni adjustment (p < 0.0033). Although the forensic parameters
show that both loci are highly discriminating (power of discrimination (PD) = 0.9246 for D19S433 and 0.9513
for D18S51) and power of exclusion (PE) = 0.5757 or D19S433 and 0.6873 for D18S51)), the lack of HWE must
be taken into account in forensic investigation. A total of 157 alleles were detected, ranging from 6 alleles at
TPOX to 21 alleles at FGA. The maximum allele frequencies is observed in TPOX (0.5472). The lowest expected
heterozygosity (HE) was observed in the TPOX (0.6201), while the highest HE was in the FGA (0.8690) (Table 2).
The polymorphic information content (PIC) ranged from 0.5672 (TPOX) to 0.8529 (D2S1338) and matching
probability (MP) values are from 0.0374 (FGA) to 0.2037 (TPOX) (Table 2). The power of discrimination (PD)
ranged from 0.7963 (TPOX) to 0.9673 (D2S1338) (Table 2), with a value of 0.9999999999999999 for the combined
PD. The power of exclusion (PE) ranged from 0.3121 (D3S1358) to 0.7588 (FGA) (Table 2), with a combined
PE value of 0.99999622.
Genetic relatedness and genetic structure of southern Thai populations. One measure of genetic
relationship among populations was a genetic distance value. The result of genetic distance (Rst) among 17 Thai
and Malaysian populations showed that the Maniq (MN) and Urak Lawoi’ (UL) were genetically different from
each other and from other populations (Fig. 1) whereas the Moklen (MLK) showed significantly difference from
almost all comparisons (p > 0.05), except with the pairs of newly generated southern Thai Muslim (MST) and
Moken. However, due to the effect of very small sample size, the Moken did not differ from almost populations.
In general, the Maniq and sea nomads from southern Thailand exhibited genetic differentiation from the other
groups. Then, the matrix of Rst were constructed to multi-dimensional scaling (MDS) plots. The three-dimen-
sional MDS result based on dimension 1 and 2 showed genetic distinction of Maniq (MN) and three sea nomads,
i.e. Moklen (MLK), Moken (MOK) and Urak Lawoi’ (UL) from the other groups from Thailand and Malaysia.
The MDS analysis based on dimensions 3 showed genetic differences of Urak Lawoi’ from other populations
(Fig. 2A–C). The heat plot of the MDS indicated genetic distinction of Moklen and Maniq in dimension 1 and 2,
respectively and genetic difference of Urak Lawoi’ from other sea nomads in dimension 3 (Fig. 2D).
To further explore cryptic population structure and genetic relationship among 16 populations without
the Moken by STRUCTURE, we present the result of K from 2 to 8 (Fig. 3A) and at K = 5 which is the suitable
cluster (Fig. 3B)16. The first cluster was in the Maniq (MN), as represented by orange, while the second clusters
(purple) stood out in the sea nomads: Moklen (MLK) and Urak Lawoi’ (UL), supporting their genetic uniqueness
(Fig. 3A). The other three clusters (dark blue, light blue and green) were distributed in all populations at different
proportions: (1) the dark blue component greatly emerged in southern Thais (MST, MUS, BST and BUD), Malays
(ML1 and ML2), populations from central Thailand (MO and CT), (2) light blue strongly emerged in the other
Thais from northern (YO and YU) and northeastern regions (IS and KH) and the green component was roughly
distributed in all populations, except for a reduction in the Maniq and Urak Lawoi’. Interestingly, although the
Moklen and Urak Lawoi’ occupy their own cluster (purple), the Moklen exhibited mixed ancestries compared to
the Urak Lawoi’ (Fig. 3A), indicating stronger interactions between Moklen and the other populations.
Overall, there were three main observations according to genetic relationship results. First, the Maniq and sea
nomads exhibited extremely genetic differences from other Thai and Malaysian populations. The distinct genetic
structure coupled with low genetic diversity (Table 1) is probably driven by genetic drift and/or inbreeding due to
their geographical isolation and small census size. Reduced genetic diversity of the Maniq was also observed in
previous study of mtDNA and Y chromosomal v ariations3. Second, among the sea nomad groups (excluding the
Moken), the Urak Lawoi’ and Moklen showed genetic dissimilarity with the latter displaying genetic admixture
with other populations. According to ethnolinguistic background, the Moklen are more closely related to the
Moken and both of them are more distant from Urak Lawoi’4. Although languages of sea nomads were grouped
within Austronesian family and Malayo-Polynesian sub-family, different in dialects were spoken; the Urak Lawoi’
or Orang Laut speak Malayic that distantly related to both Moken and Moklen who shared many cultural con-
nections. In addition, the Urak Lawoi’ was culturally isolated but the Moklen had frequently interacted with
and influenced by other southern Thais1,17,18. Therefore, the unique genetic signature of Urak Lawoi’ and mixed
ancestries of Moklen could be described by ethnolinguistic and cultural evidence. Third, we found more genetic
similarity between major southern Thais and populations from central Thailand than other regions. The present
result was in agreement with a recent genome-wide study19 that could be explained by historical evidence; there
were movements from the central region to the south during the Ayutthaya Period (during 1350–1767 A.D.)20
and genetic admixture between the southern Thai and Malays after the settlement period might be possible13.
Scientific Reports | (2022) 12:655 | https://doi.org/10.1038/s41598-021-04646-1 4
Vol:.(1234567890)www.nature.com/scientificreports/
Figure 1. Heat plot of Rst values between total 17 populations. The “ = ” symbol indicates non-significance
of Rst values (p > 0.05).
Genetic relationships between southern Thai populations and other Asian populations. A
neighbor-joining (NJ) tree based on allele frequencies of 15 STR loci among 29 Asian populations reveals four
clusters of populations. Cluster 1 consists of populations from Island Southeast Asia and Malaysia while the
South Asian populations occupy cluster 2. Cluster 3 comprises of Mainland Southeast Asian populations and
cluster 4 belongs to the Thai sea nomads, Maniq from Thailand and Indonesians from Bali, with the extreme
divergence of Maniq (Fig. 4). Interestingly, both southern Thai Muslim populations (MST and MUD) and south-
ern Thai Takbai are positioned close to cluster 2 of South Asian. One southern Thai Buddhist population (BUD)
is grouped with other Mainland Southeast Asian populations of cluster 3, while another southern Thai Bud-
dhist population (BST) is clustered with southern Thai sea nomads in cluster 4 (Fig. 4). Several archaeological
evidence indicated prehistorical contacts between India and present-day Thailand (and Cambodia) during the
Iron Age that brought exotic goods and Buddhist and Hindu religions; early states in this area, e.g. Dvara-
vati in central Thailand and Langkasuka in Malay Peninsular were influenced by Indian cultures during initial
establishment5. South Asian connections of southern Thai populations could be possibly driven by previous
admixture, in agreement with previous study on genome-wide data19.
Conclusion
We generated and analysed forensic STR loci in diverse ethnolinguistic groups from southern Thailand. In
general, the Maniq and sea nomads are highly diverged from the other Thai groups, while the southern Thai
populations are closer to the Malays and populations from central Thailand, reflecting different genetic structures
of major Thais in each region that emphasize the importance of generating a database of allelic frequencies in
Scientific Reports | (2022) 12:655 | https://doi.org/10.1038/s41598-021-04646-1 5
Vol.:(0123456789)www.nature.com/scientificreports/
Figure 2. The three-dimensional MDS plots for 17 populations (A–C) (stress = 0.0030) and the heat plot of
standardized values of MDS with five dimensions (D). See population abbreviation in Table 1. Red, purple,
green, blue and black indicate populations from southern Thailand, northern Thailand, northeastern Thailand,
central Thailand and Malaysia, respectively. Circle, square and triangle indicate Austronesian, Tai-Kadai,
Austroasiatic families, respectively.
southern regions of Thailand. Therefore, the allelic frequency generated here from combined STRs data from
several populations is useful for further forensic investigation in the region. In anthropological genetic perspec-
tive, although the resolution of STRs to elucidate population history is lower than those of genome-wide data,
several results here are concordant to previous genome-wide data, e.g. close relationship between southern and
central Thais, reflecting certain usefulness of this set of markers. In addition, the Moklen and Urak Lawoi’ sea
nomads have not been genetically investigated yet; this study initially provides basic genetic background of these
enigmatic groups from southern Thailand. We found genetic distinction among Urak Lawoi’ and Moklen; the
former had unique genetic perspective while the latter exhibited mixed ancestries, reflecting more population
interaction with other populations. The limitations in this study is the limited sample size of the Moken which
cannot be able to compare the results with other populations. Additional studies of sea nomads from other
locations of southern Thailand coupled with further details from other genetic markers will be provided more
insights into the genetic ancestry of AN speaking people in the Malay Peninsula.
Materials and methods
Sample. We newly collected 184 samples belonging to seven populations: AA-speaking Maniq, AN-speaking
Moklen, Moken, Urak Lawoi’ and southern Thai Muslim and TK-speaking southern Thai Buddhist and southern
Thai Takbai, using buccal swabs with written informed consent. Prior to the collection of samples, all volunteers
were interviewed to screen for subjects unrelated for at least two generations. The rights of participants and
their identity have been protected during the whole process of this research. All experiments were performed
in accordance with relevant guidelines and regulations based on the experimental protocol on human subjects
which was approved by the Khon Kaen University Ethic Committee (Protocol No. HE622223) and Naresuan
University Institution Review Board (COA No. 0464/2017). When combined with previously published south-
ern Thai Buddhist and southern Thai Muslim d ata13, this provides a total raw genotype data of 334 southern Thai
samples (Table S1).
Scientific Reports | (2022) 12:655 | https://doi.org/10.1038/s41598-021-04646-1 6
Vol:.(1234567890)www.nature.com/scientificreports/
Figure 3. STRUCTURE result at K = 2–8 (A). Each individual is represented by a single column that is divided
into segments whose size and color correspond to the relative proportion of a particular cluster. Populations
are separated by black lines and population codes are listed in Table 1. Number of populations with the highest
posterior probability expressed as the Delta K (B).
Data collection. Genomic DNA was extracted from buccal swabs using the Gentra Puregene Buccal Cell
Kit (Qiagen, Hilden, Germany) according to the manufacturer’s instructions. Each DNA sample was amplified
for 15 STR loci in a multiplex PCR using a commercial AmpFlSTR Identifiler kit (Applied Biosystem, Foster
City, CA, USA) according to the manufacturer’s protocols. The amplicons were genotyped by multi-capillary
electrophoresis on an ABI 3130 DNA sequencer (Applied Biosystem), and allele calling was performed by the
software GeneMapper v.3.2.1 (Applied Biosystem).
Statistical analysis. Arlequin v.3.5.2.221 was used to calculate allele frequency, Hardy–Weinberg equi-
librium (HWE) P values, observed heterozygosity (HO), expected heterozygosity (HE), total alleles, and gene
diversity (GD). Significant levels for the HWE were adjusted according to the sequential Bonferroni correction
(α = 0.05/15)22. We used the Excel PowerStats s preadsheet23 to compute several forensic parameters, including
power of discrimination (PD), matching probability (MP), polymorphic information content (PIC), power of
exclusion (PE), and typical paternity index (TPI) as well as the combined PD (CPD), combined MP (CMP),
and combined PE (CPE). To reveal population relationships and population structures, we also combined geno-
Scientific Reports | (2022) 12:655 | https://doi.org/10.1038/s41598-021-04646-1 7
Vol.:(0123456789)www.nature.com/scientificreports/
Figure 4. Neighbor-joining (NJ) tree. The NJ tree based on Fst computation from allele frequency of 15 STR
loci from 29 populations, including southern Thai populations (indicated by dots) and other comparative Thai
and Asian populations.
typing data of additional eight populations from northern Thailand (Yuan and Yong), northeastern Thailand
(Khmer and Lao Isan) and central Thailand (Mon and central Thai)8,10–12,37, and Malaysia (two Malay popula-
tions)14 (Table 1; Fig. 5). A genetic distance matrix based on sum of square difference (Rst) was generated by
Arlequin, and the matrix was then plotted in two dimensions by means of multidimensional scaling (MDS)
using Statistica v.10 demo (StatSoft, Inc., USA). The heatmap visualization of Rst and MDS values were obtained
using R package (R Development Core Team).
To delineate cryptic population structure using the Bayesian clustering method, we performed STRUCTU
RE version 2.3.4 under the following prior parameters: admixture, correlated allele frequencies, and assistance
of sampling locations (LOCPRIOR model)24–26. We ran ten replications for each number of clusters (K) from
1 to 11 and used a burn-in length of 100,000 iterations, followed by 200,000 iteration running length. We used
STRUC TUR E Harvester27 to compute a second-order rate of change logarithmic probability between subsequent
K values (△K) in order to identify the optimal K value in the d ata16. We used CLUMPAK28 and DISTRUCT29
to generate the final results of STRUCTURE. To evaluate genetic relatedness with other Asian populations, we
used POPTREE v.230 to generate a neighbor-joining (NJ) tree based on Fst computation by allele frequency of 15
STR loci of 29 populations from South and Southeast Asia8,9,11,12,14,31–39.
Ethics statement. The rights of participants and their identity have been protected during the whole pro-
cess of this research. All experiments were performed in accordance with relevant guidelines and regulations
based on the experimental protocol on human subjects which was approved by the Khon Kaen University Ethic
Committee (Protocol No. HE622223) and Naresuan University Institution Review Board (COA No. 0464/2017).
Scientific Reports | (2022) 12:655 | https://doi.org/10.1038/s41598-021-04646-1 8
Vol:.(1234567890)www.nature.com/scientificreports/
Figure 5. Map of the sampling locations of the 17 populations in analyses of genetic diversity and genetic
structure, color-coded according to geographic region/country: red, purple, blue, green, and black indicating
populations from southern Thailand, northern Thailand, northeastern Thailand, central Thailand and Malaysia,
respectively while symbol-coded according to language family: Circle, square and triangle representing
Austronesian, Tai-Kadai, Austroasiatic families, respectively. (Adob e Illustrat or CS4 14.0.0. http://www.adobe.
com/sea/).
Data availability
Raw genotype data of 334 southern Thai samples are provided in Table S1.
Received: 21 September 2021; Accepted: 23 December 2021
References
1. Eberhard, D.M., Simons, G.F. & Fennig, C.D. Ethnologue: languages of the World. 23rd eds. (SIL International, 2020).
2. Premsrirat, S. Language map of ethnic groups in Thailand. J. Lang. Cult. 21, 5–35 (2002) ((in Thai)).
3. Kutanan, W. et al. Contrasting maternal and paternal genetic variation of hunter-gatherer groups in Thailand. Sci. Rep. 8, 1536.
https://doi.org/10.1038/s41598-018-20020-0 (2018).
4. Dancause, K. N., Chan, C. W., Arunotai, N. H. & Lum, J. K. Origins of the Moken Sea Gypsies inferred from mitochondrial
hypervariable region and whole genome sequences. J. Hum. Genet. 54, 86–93 (2009).
5. Higham, C. & Thosarat, R. Early Thailand from prehistory to Sukhothai (River Books, 2012).
6. Rosenberg, N. A. et al. Genetic structure of human populations. Science 298, 2381–2385 (2002).
7. Silva, N. M., Pereira, L., Poloni, E. S. & Currat, M. Human neutral genetic variation and forensic STR data. PLoS One 7, e49666
(2012).
Scientific Reports | (2022) 12:655 | https://doi.org/10.1038/s41598-021-04646-1 9
Vol.:(0123456789)www.nature.com/scientificreports/
8. Kutanan, W. et al. Genetic affinity and admixture of northern Thai people along their migration route in northern Thailand:
Evidence from autosomal STR loci. J. Hum. Genet. 56, 130–137 (2011).
9. Kutanan, W. et al. Geography has more influence than language on maternal genetic structure of various northeastern Thai ethnici-
ties. J. Hum. Genet. 59, 512–520 (2014).
10. Srithawong, S. et al. Genetic and linguistic correlation of the Kra-Dai speaking groups in Thailand. J. Hum. Genet. 60, 371–380
(2015).
11. Srithawong, S. et al. Genetic structure of the ethnic Lao groups from mainland Southeast Asia revealed by forensic microsatellites.
Ann. Hum. Genet. 84, 357–369 (2020).
12. Srithawong, S. et al. Close genetic relationship between central Thai and Mon people in Thailand revealed by autosomal micros-
atellites. Int. J. Legal Med. 135, 445–448 (2021).
13. Kutanan, W., Kitpipit, T., Phetpeng, S. & Thanakiatkrai, P. Forensic STR loci reveal common genetic ancestry of the Thai-Malay
Muslims and Thai Buddhists in the deep Southern region of Thailand. J. Hum. Genet. 59, 675–681 (2014).
14. Seah, L. H. et al. STR data for the AmpFlSTR Identifiler loci in three ethnic groups (Malay, Chinese, Indian) of the Malaysian
population. Forensic Sci. Int. 138, 134–137 (2003).
15. Mawan, A. et al. Autosomal microsatellite investigation reveals multiple genetic components of the highlanders from Thailand.
Genes 12, 383 (2021).
16. Evanno, G., Regnaut, S. & Goudet, J. Detecting the number of clusters of individuals using the software STRUCTURE: A simula-
tion study. Mol. Ecol. 14, 2611–2620 (2005).
17. Hoogervorst, T. G. Ethnicity and aquatic lifestyles: Exploring Southeast Asia’s past and present seascapes. Water Hist. 4, 245–265
(2012).
18. Zimmerman, O. Becoming Indigenous: A Story of the Moklen People. (WWU Honors Program Senior Projects 87, 2018).
19. Kutanan, W. et al. Reconstructing the Human Genetic History of Mainland Southeast Asia: Insights from Genome-Wide data
from Thailand and Laos. Mol. Biol. Evol. 38, 3459–3477 (2021).
20. Baker, C. & Phongpaichit, P. A history of Ayutthaya (Cambridge University Press, 2017).
21. Excoffier, L. & Lischer, H. E. Arlequin suite ver 3.5: A new series of programs to perform population genetics analyses under Linux
and Windows. Mol. Ecol. Resour. 10, 564–567 (2010).
22. Rice, W. R. Analyzing tables of statistical tests. Evolution 43, 223–225 (1989).
23. Promega. Powerstats version 1.2 tools for analysis of population statistics. (1999). at https://www.promega.com.cn/products/genet
icidentity.
24. Pritchard, J. K., Stephens, M. & Donnelly, P. Inference of population structure using multilocus genotype data. Genetics 155,
945–959 (2000).
25. Falush, D., Stepheas, M. & Pritchard, J. K. Inference of population structure using multilocus genotype data: Linked loci and cor-
related allele frequencies. Genetics 164, 156–187 (2003).
26. Hubisz, M., Falush, D., Stephens, M. & Pritchard, J. Inferring weak population structure with the assistance of sample group
information. Mol. Ecol. Resour. 9, 1322–1332 (2009).
27. Earl, D. A. & von Holdt, B. M. STRUCTURE HARVESTER: A website and program for visualizing STRUCTURE output and
implementing the Evanno method. Conserv. Genet. Resour. 4, 359–361 (2012).
28. Kopelman, N. M., Mayzel, J., Jakobsson, M., Rosenberg, N. A. & Mayrose, I. CLUMPAK: a program for identifying clustering
modes and packaging population structure inferences across K. Mol. Ecol. Resour 15, 1179–1191 (2015).
29. Rosenberg, N. A. DISTRUCT: a program for the graphical display of population structure. Mol. Ecol. Notes 4, 137–138 (2003).
30. Takezaki, N., Nei, M. & Tamura, K. POPTREEW: webersion of POPTREE for constructing population trees from allele frequency
data and computing some other quantities. Mol. Biol. Evol. 31, 1622–1524 (2014).
31. Dobashi, Y. et al. STR data for the AmpFLSTR Identifiler loci in Bangladeshi and Indonesian populations. Leg. Med. 7, 222–226
(2005).
32. Shepard, E. M. et al. Autosomal STR variation in five Austronesian populations. Hum. Biol. 77, 825–851 (2005).
33. De Ungria, M. C. A. et al. Allele frequencies of 19 STR loci in a Philippine population generated using AmpFlSTR multiplex and
ALF singleplex systems. For. Sci. Int. 152, 281–284 (2005).
34. Maruyama, S., Minaguchi, K., Takezaki, N. & Nambiar, P. Population data on 15 STR loci using AmpF/STR Identifiler kit in a
Malay population living in and around Kuala Lumpur Malaysia. Leg. Med. 10, 160–162 (2008).
35. Untoro, E., Atmadja, D. S., Pu, C. E. & Wu, F. C. Allele frequency of CODIS 13 in Indonesian population. Leg. Med. 11, S203–S205
(2009).
36. Shrivastava, P., Jain, T. & Trivedi, V. B. Genetic polymorphism study at 15 autosomal locus in central Indian population. Springerplus
4, 566 (2015).
37. Chantakot, P. et al. Genetic divergence of Austroasiatic speaking groups in the Northeast of Thailand: A case study on northern
Khmer and Kuy. Chiang Mai J. Sci. 44, 1279–1294 (2017).
38. Guo, F., Li, J., Wei, T., Ye, Q. & Chen, Z. Genetic variation of 17 autosomal STR loci in the Zhuang ethnic minority from Guangxi
Zhuang Autonomous Region in the south of China. For. Sci. Int. Genet. 28, e51–e52 (2017).
39. Tran, H. L. et al. Allele frequencies for 22 autosomal STRs in the Kinh population in Vietnam. Int. J. Legal Med. 133, 1761–1762
(2019).
Acknowledgements
We would like to thank coordinators who assisted with sample recruitment and we thank all participants who
donated their biological samples. This work has received scholarship under the Post-Doctoral Training Program
from Khon Kaen University, Thailand (PD-2564-10). J.K. acknowledges partial support provided by Chiang
Mai University, Thailand. C.S. acknowledges the Unit of Excellence 2022 on Biodiversity and Natural Resources
Management, University of Phayao (FF65-UoE003). M.S. was supported by Naresuan University (Grant No.
R2561B029).
Author contributions
W.K. Conceived and designed the project. W.K., M.S., C.S., S.Sa. and J.K. Collected samples. M.S., S.Sr., K.M.
Generated data. W.K. and S.Sr. Carried out the data analyses. M.S., S.Sr. and W.K. Wrote the article.
Competing interests
The authors declare no competing interests.
Scientific Reports | (2022) 12:655 | https://doi.org/10.1038/s41598-021-04646-1 10
Vol:.(1234567890)www.nature.com/scientificreports/
Additional information
Supplementary Information The online version contains supplementary material available at https://doi.org/
10.1038/s41598-021-04646-1.
Correspondence and requests for materials should be addressed to W.K.
Reprints and permissions information is available at www.nature.com/reprints.
Publisher’s note Springer Nature remains neutral with regard to jurisdictional claims in published maps and
institutional affiliations.
Open Access This article is licensed under a Creative Commons Attribution 4.0 International
License, which permits use, sharing, adaptation, distribution and reproduction in any medium or
format, as long as you give appropriate credit to the original author(s) and the source, provide a link to the
Creative Commons licence, and indicate if changes were made. The images or other third party material in this
article are included in the article’s Creative Commons licence, unless indicated otherwise in a credit line to the
material. If material is not included in the article’s Creative Commons licence and your intended use is not
permitted by statutory regulation or exceeds the permitted use, you will need to obtain permission directly from
the copyright holder. To view a copy of this licence, visit http://creativecommons.org/licenses/by/4.0/.
© The Author(s) 2022
Scientific Reports | (2022) 12:655 | https://doi.org/10.1038/s41598-021-04646-1 11
Vol.:(0123456789)You can also read