Geography and Other Indispensable Points of View A Synoptic Approach to Modelling and Visualizing Arts and Humanities Topics
←
→
Page content transcription
If your browser does not render page correctly, please read the page content below
Geography and Other Indispensable Points of View
A Synoptic Approach to Modelling and Visualizing Arts and Humanities Topics

Florian Windhager, Saminu Salisu, Nicole High-Steskal & Eva Mayr
Department for Arts and Cultural Studies, Danube University Krems
Geography meets DH, Neue Ansätze raumbezogener Modellierung. March 12 & 13, 2021

All models are wrong, but some are useful.
historically newer, non-geographic
spatialization techniques
multi-perspectival / paradigmatic 2 chronography time & moving targets? 2
hypertext of Adacemia / Society * Priestley, 1765
Andrews, 2017
cultural categories? 3
?
?
human relations? 4
- whether verbal or visual -
3 categography ?
* Shneiderman, 1999
Hidalgo et al. 2013+
All models are wrong, but some are useful.
? ?
? 4 relatiography
* Moreno, 1933 1 geography and its known
Ng & Soo, 2016 imitations
* 500 BCE
A bigger picture of your complex DH subject matter -

     do you also sometimes struggle to assemble coherent
    representations for your multi-faceted research topic?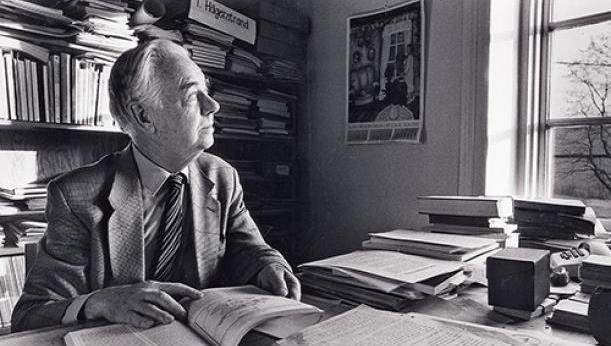
The Case of Cultural Collections
TIME

Digitization endeavors trans-                                                                                                 VIS 1: TIMELINE

late cultural collections
                                                                                               time of origin
into multi-dimensional
datasets, which become                                                                                place of origin

increasingly visualized
                                                                              digital object
by multiple methods of                                                                                    creator of object   VIS 2: MAP

distant reading and viewing.*
                                                                                                           type of object

                                                                              metadata entry              style of object
                                                    cultural collection

                                                                                                                              VIS 3: SETS
                                                                                                 relations to
                                                                                               other objects

 * Survey Study (2018): Visualization of Cultural Heritage Collection Data:
   State of the Art and Future Challenges. DOI: 10.1109/TVCG.2018.2830759
                                                                                                                              VIS 4: NETWORKS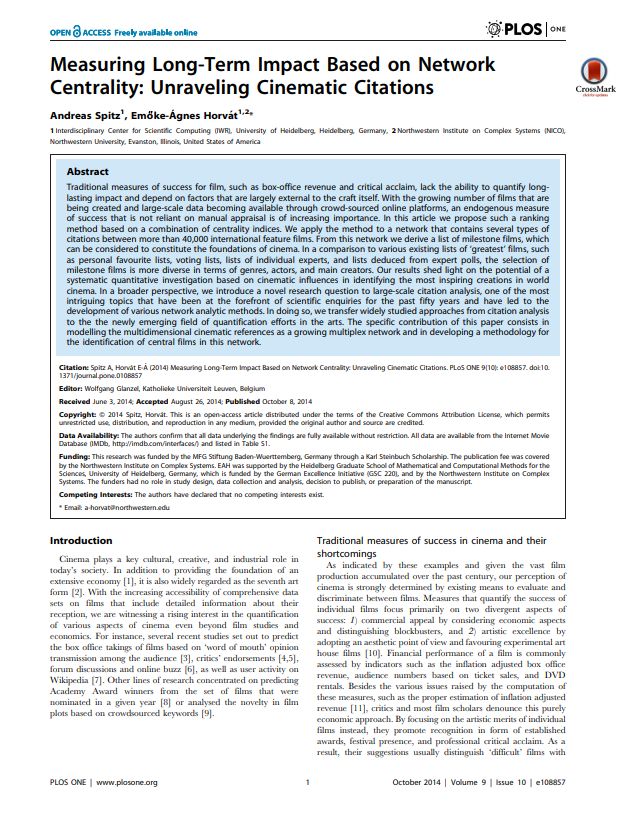
Looking at the multi-faceted interfaces of visual analysis,
we feel reminded of the ancient fable with the
elephant and the blind men * – and wonder:

  Is there a synoptic design strategy to
  draw multiple visualization perspectives
  together into a bigger picture of a
  complex dataset, to better integrate
  some of the fragmented standard
  perspectives of visual cultural analytics?

  In other words: shouldn‘t we also conceive
  visual synthesis technologies, when
  working with complex DH data to support
  information integration and synoptic reasoning?

                                                              Image: http://www.sexandquantumphysics.com/2011/07/paradigms-shift/
As an early reflection on complex subject matters, the
fable emphasizes that complexity allows only selective
and partial observations, which can even contradict each
other, but the fable finds solace and a solution in either

   a) communication between the blind men, or in the
   b) visual synthesis of a seeing man, who can resolve
   the conflict between the conflicting local perspectives
   by re-assembling them as adjacent pieces in 3 dimensions.

 Unfortunately, this cannot be done with information visualizations,
 which are non-naturalistic representations of mostly non-spatial data.
 So how can visualizations be interconnected to bigger pictures?

Excursus:

      Six blind elephants were discussing what men were like.
      After arguing they decided to find one and determine what
      it was like by direct experience. The first blind elephant
      felt the man and declared, 'Men are flat.' After the other
      blind elephants felt the man, they agreed.
We consider “coherence techniques” to support the integration of information from multiple visualizations
and strive for their systematic collection* - and their orchestrated use, e.g. by the “PolyCube” framework.
utilizing space utilizing time
• Coordinated Multiple Views (Roberts, 2007, link) • Narrative Visualization (Segel & Heer, 2010, link)
• Synoptic Encoding (Mayr et al., 2018, link) • Sequential Presentation (standard technique)
• Rich Pictures (Monk & Howard, 1998, link) • Film / Animation (standard technique)
• Data Comics (Bach et al., 2017, link) • Interaction (standard technique)
• Polycubism (Windhager et al., 2020, link) • Animated transitions (Heer & Robertson, 2007, link)
* Concept Paper (2019): Designing for a Bigger Picture: Towards a Macrosyntax for Information Visualizations. osf Preprint. DOI: 10.31219/osf.io/q9kdtWhen dealing with complex phenomena, arguably “One view is not enough!” (Dörk et al., 2018, link)
The use of multiple views is a well-established and relevant design principle “in order to maximise insight,
balance the strengths and weaknesses of individual views, and avoid misinterpretation” (Kerracher, 2014, link)
interface design strategy of “multiperspectivity”
• “generosity” (Whitelaw, link)
• “parallax” (Drucker, link)
• “triangulation” (Brandes et al., link) every visualization method has its strengths,
• “plurality” (Dörk et al., link) every visualization method has its limitations
Thus advanced interface design is well advised to combine multiple views and representation techniques –
and to utilize further coherence techniques, as exemplified by the prototypical PolyCube framework (link).Torsten Hägerstrand
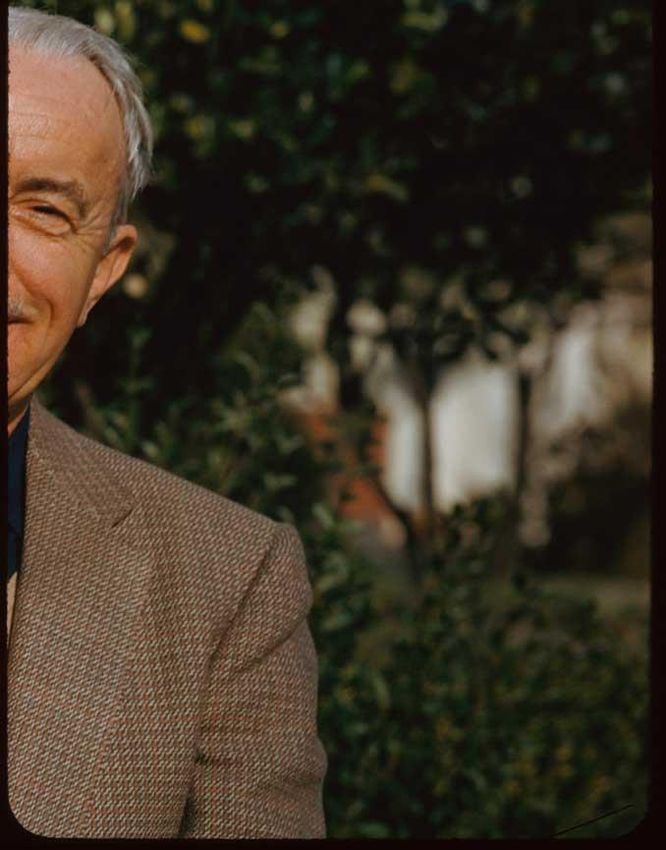
1916 – 2004
Swedish Geographer
Work on migration, cultural diffusion, and time-geography
Image: Claes Hall / Hagblom FotoTIME
TIME
Chronography Geography “Chronogeography / Time Geography”Building on the space-time cube, we introduce an integrated multi-perspective approach to the
visualization of event-based data. The PolyCube visualization framework is a web-based
visualization system, which draws together multiple perspectives to convey a bigger picture for
complex, time-oriented data, and to support synoptic exploration of the data, as well as
navigation between specific perspectives for expert and casual users alike. The system provides:
• multiple spatialized (i.e. geographic and non-geographic) overview perspectives
(including a map-based, a set-based, and a network-based view),
• multiple perspectives on the temporal data dimension (including space-time cube
representation, juxtaposition, animation and superimposition views)
• close-up access to single events or objects on demand, together with
• animated canvas transitions, supporting the switching between various views.By the use of multiple coordinated cubes (= „PolyCube“), it generates a synoptic representation for event-based data and
displays development patterns for geo-temporal, categorial-temporal, and relational-temporal information which would
remain scattered across multiple views otherwise. Thus it is one design strategy, to put the whole elephant onto the screen.
relational-temporal VIS
categorial-temporal VIS
geo-temporal VISdemo & case studies
System architecture and implementation by a team of Visual Analytics specialists

                Saminu Salisu              Velitchko Filipov                 Roger A. Leite                    Silvia Miksch

                                                               CVAST, Vienna University of Technology (link)
Case Study No. 1: A Photography Collection
Charles Weever Cushman
(1896-1972)
The Photography Collection: https://webapp1.dlib.indiana.edu/cushman/index.jsp
Preprocessing by Miriam Posner: https://miriamposner.com/blog/getting-started-with-palladio/
Case Study: Visualizing Biographical Trajectories by Historical Artifacts. DOI: 10.17605/OSF.IO/E62X4
Image: http://webapp1.dlib.indiana.edu/collections/cushman/full/P09034.jpgcategorical-temporal perspective
showing categories of photographs over time
time axis
geo-temporal perspective relational-temporal perspective
showing calculated similarity of photographs
showing geo-temporal distribution of photographs
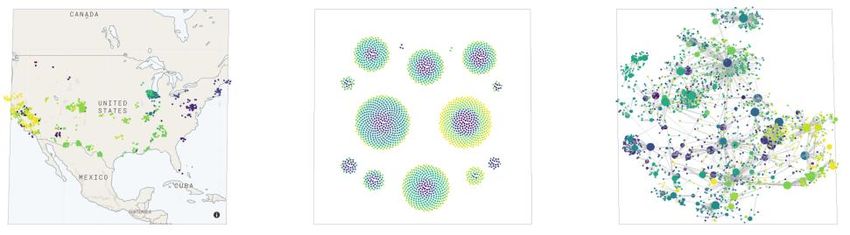
Interactive Demo: https://danubevislab.github.io/polycube/cga2020/Case Study No.2: Highly Cited IMDB Movies *
metadata dimensions
movie title
date of production
country of origin
‘is referenced’
movie genre ‘is featured in’
’is version of’
plot description ‘is a sequel of’
‘is a spin-off’
movie poster
Charles Weever Cushman
(1896-1972)
cinematic citations
* movie corpus extracted from the IMDB by Spitz & Horvat (2014)
DOI: 10.1371/journal.pone.0108857
for about 55,000 movies, reduced to the most influential 2,000 moviesdetails on demand
showing poster * plot synopsis for selected films
categorical-temporal perspective
showing movie genres over time
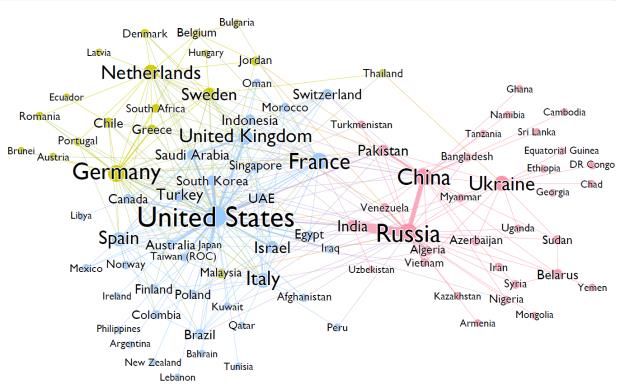
geo-temporal perspective relational-temporal perspective
showing geo-temporal origin of movies showing references between movies
genre filter
Interactive Demo: https://danubevislab.github.io/polycube/cga2020/PolyCube offers three additional encodings for the temporal data dimension
TIME
TIME
i) color coding
TIME
iii) data comics
(juxtaposition)
ii) animationTransitions between temporal views are mediated by
animated canvas transitions, based on space-time cube operations
TIME
GEO SET NET
juxtaposition
animation
TIME
GEO SET NET
TIME
space-time cube
superimpositionoutlook
Aside from cultural collection data, we
consider a wide variety of further
humanities topics and subject matters              Ort E
                                                                           Ort B
                                                                                                               Interaktion B2

to benefit from multi-spatiotemporal
                                                                                      Ort E   Interaktion C2
                                                                                                                                                  Werk 7
                                                                                                               Interaktion A2

representations - and want to adapt                                        Ort B                                                         Werk 6

                                                                                                                                         Werk 5

the PolyCube framework for that matter.                Ort A                       Ort D      Interaktion D2
                                                                                                               Interaktion B1            Werk 4

                                                                                                                                Werk 3
                                                                    Ort B
                                           Ort C                                              Interaktion D1

Transcending the point-like character-                             Ort B                                                        Werk 2

istics of cultural collection data,                                Ort B                      Interaktion C1                                Werk 1
                                                                                                               Interaktion A1

                                                           Ort A

actor and object biographies appear
as a valuable analytical topic area.

Polycubistic visualizations of traces
and trajectories thus can make the
movements of historical entities
visually accessible in geographic,
categorical and relational space-times.
                                                                                      Concept Paper (20018) Beyond One-Dimensional Portraits.
                                          A Synoptic Approach to the Visual Analysis of Biography Data http://ceur-ws.org/Vol-2119/paper11.pdf
By connecting and contextualizing
these morphological elements,
data on the trajectories of
political territories, on manifold
actor networks, on innovation,
translation and modernization
processes can be remediated
and rendered visible within 10y 5
y
1d 100y
the polycubistic framework. A
event & object collections individual biographies collective biographies political territories
By creating appropriate line-ups
of cubistic representations for
each topic, combinatorial “meta- 2000
shapes” can appear for scholarly 10y
or public audiences, which offer
1m 1900
5
y
bigger historical pictures for a 1800
whole spectrum of analytical
or pedagogical scenarios, and network dynamics genealogies & trees innovation & diffusion modernization processes
around which traditional
narrative accounts and argu-
mentations can be organized.https://intavia.eu
intavia In/Tangible European Heritage -
Visual Analysis, Curation & Communication
November 2020 – October 2023Associated Cultural Heritage Institutions
● Europeana (EU)
Danube University Free University Slovenian Academy of
● prometheus Bilddatenbank (DE)
Krems Amsterdam Sciences & Arts
● Time Machine Organization (EU)
● Royal Library of the Netherlands (NL)
● Oxford Dictionary of National Biography (UK)
● Albertina Museum (AT)
● Deutsches Museum Munich (DE)
Austrian Center Aalto University of Southern
for DH & CH University Denmark ● Edith Cowan University (AU)
● Austrian Gallery Belvedere (AT)
● Huygens ING KNAW (NL)
● NIOD Institute for War, Holocaust & Genocide (NL)
● German Literature Archive Marbach (DE)
● Ghent Centre for Digital Humanities (BE)
Stuttgart Fluxguide University of
University GesmbH Helsinki
● and others
● plus 12 national biography projectsSynoptic Visualization of Object & Biography Data
geotime.com
mockup made withVisualizing Socio-Historical Aggregates
Polycube Prototype & Paper: https://danubevislab.github.io/polycube/cga2020/
                          InTaVia project: https://intavia.eu

          Interested in collaborative case studies? – Please get in touch!
          mail: florian.windhager@donau-uni.ac.at               twitter: @windhagr

            This work was partly funded by a grant from the Austrian Science Fund (FWF),
project No. P28363-24 and the H2020 research and innovation action InTaVia, project No. 101004825.
You can also read