Global patterns of nitrate isotope composition in rivers and adjacent aquifers reveal reactive nitrogen cascading
←
→
Page content transcription
If your browser does not render page correctly, please read the page content below
ARTICLE
                  https://doi.org/10.1038/s43247-021-00121-x                 OPEN

                  Global patterns of nitrate isotope composition
                  in rivers and adjacent aquifers reveal reactive
                  nitrogen cascading
                  Ioannis Matiatos 1 ✉, Leonard I. Wassenaar1, Lucilena R. Monteiro 1, Jason J. Venkiteswaran 2,
                  Daren C. Gooddy 3, Pascal Boeckx 4, Elisa Sacchi 5, Fu‐Jun Yue6, Greg Michalski7,
                  Carlos Alonso-Hernández8, Christina Biasi 9, Lhoussaine Bouchaou10,11, Nandana V. Edirisinghe12,
                  Widad Fadhullah13, Joseph R. Fianko14, Alejandro García-Moya8, Nerantzis Kazakis15, Si-Liang Li6,
                  Minh T. N. Luu16, Sakhila Priyadarshanee12, Viviana Re 5,24, Diego S. Rivera 17, Asunción Romanelli18,
                  Prasanta Sanyal19, Fredrick Tamooh20, Duc A. Trinh21, Wendell Walters22 & Nina Welti23
1234567890():,;

                  Remediation of nitrate pollution of Earth’s rivers and aquifers is hampered by cumulative
                  biogeochemical processes and nitrogen sources. Isotopes (δ15N, δ18O) help unravel spatio-
                  temporal nitrogen(N)-cycling of aquatic nitrate (NO3−). We synthesized nitrate isotope data
                  (n = ~5200) for global rivers and shallow aquifers for common patterns and processes. Rivers
                  had lower median NO3− (0.3 ± 0.2 mg L−1, n = 2902) compared to aquifers (5.5 ± 5.1 mg L−1,
                  n = 2291) and slightly lower δ15N values (+7.1 ± 3.8‰, n = 2902 vs +7.7 ± 4.5‰, n = 2291),
                  but were indistinguishable in δ18O (+2.3 ± 6.2‰, n = 2790 vs +2.3 ± 5.4‰, n = 2235). The
                  isotope composition of NO3− was correlated with water temperature revealing enhanced N-
                  cascading in warmer climates. Seasonal analyses revealed higher δ15N and δ18O values in
                  wintertime, suggesting waste-related N-source signals are better preserved in the cold
                  seasons. Isotopic assays of nitrate biogeochemical transformations are key to understanding
                  nitrate pollution and to inform beneficial agricultural and land management strategies.

                  1 Isotope Hydrology Section, International Atomic Energy Agency, Vienna, Austria. 2 Department of Geography and Environmental Studies, Wilfrid Laurier

                  University, Waterloo, ON, Canada. 3 British Geological Survey, Wallingford, Oxfordshire, UK. 4 Isotope Bioscience Laboratory, Ghent University,
                  Gent, Belgium. 5 Department of Earth and Environmental Sciences, University of Pavia, Pavia, PV, Italy. 6 School of Earth System Science, Tianjin University,
                  Tianjin, China. 7 Department of Earth, Atmospheric and Planetary Sciences, Department of Chemistry, Purdue University, West Lafayette, IN, USA.
                  8 Departamento de Estudio de la Contaminación Ambiental, Centro de Estudios Ambientales de Cienfuegos, Cienfuegos, Cuba. 9 University of Eastern

                  Finland, Kuopio, Finland. 10 Laboratory of Applied Geology and Geo-Environment, Faculty of Sciences, Ibn Zohr University, Agadir, Morocco. 11 International
                  Water Research Institute, Mohammed VI Polytechnic University, Benguérir, Morocco. 12 Isotope Hydrology Section, Sri Lanka Atomic Energy Board,
                  Orugodawatta, Wellampitiya, Sri Lanka. 13 School of Industrial Technology, Universiti Sains Malaysia, George Town, Penang, Malaysia. 14 Department of
                  Nuclear Sciences and Applications, School of Nuclear and Allied Sciences University of Ghana/Ghana Atomic Energy Commission, Accra, Ghana. 15 Aristotle
                  University of Thessaloniki, School of Geology, Thessaloniki, Greece. 16 Analytical Chemistry Department, Institute of Chemistry Vietnam Academy of Science
                  and Technology A18, Hanoi, Vietnam. 17 CisGER, Universidad del Desarrollo, Las Condes, Chile. 18 National Scientific and Technical Research Council
                  (CONICET) - National University of Mar del Plata (UNMdP), Mar del Plata, Argentina. 19 Indian Institute of Science Education and Research, Kolkata,
                  Mohanpur, India. 20 Department of Zoological Sciences, Kenyatta University, Nairobi, Kenya. 21 Nuclear Training Center, Vietnam Atomic Energy Institute,
                  Hanoi, Vietnam. 22 Brown University, Providence, RI, USA. 23 CSIRO Agriculture and Food, Urrbrae, SA, Australia. 24Present address: Earth Sciences
                  Department, University of Pisa, Pisa, Italy. ✉email: i.matiatos@iaea.org

                  COMMUNICATIONS EARTH & ENVIRONMENT | (2021)2:52 | https://doi.org/10.1038/s43247-021-00121-x | www.nature.com/commsenv                                     1
ARTICLE COMMUNICATIONS EARTH & ENVIRONMENT | https://doi.org/10.1038/s43247-021-00121-x
T
he exponential growth of the human population con- synthesized global river and adjacent shallow aquifer nitrate
comitant with intensive development of fertilized agri- isotope (15N and 18O of NO3−) data sets from the scientific lit-
cultural and industrial activity since the 1950s caused sharp erature as well as new data (n = ~5200) to (a) provide a first-
increases in nitrogen loadings to rivers and surficial aquifers order global assessment of spatiotemporal patterns of NO3− and
worldwide1,2. Dissolved reactive nitrogenous species (e.g., NO3−, its isotopes in rivers and aquifers and (b) evaluate whether NO3−
NH4+) are prevailing pollutants in many rivers and aquifers, transformations are impacted by key environmental factors, such
stemming primarily from agricultural activities, municipal waste as temperature, climate, and seasonality. The investigation of the
sources, and combustion derived nitrogen (N) deposition3. The origin of nitrate pollution in rivers and groundwater at the local
impact of reactive nitrogenous species on water and ecosystems scale usually requires a deeper consideration of additional
(e.g., eutrophication, hypertrophication) and human health (e.g., information such as N flux information from homogenized land-
methemoglobinemia, cancer, thyroid disease)4–6 occurs in series, use types32; however, the detailed local evaluation was beyond the
known as N-cascading1, and is of existential concern. scope of this work. This synthesis provides a global foundational
The global nitrogen cycle is a subject of considerable debate perspective to evaluate the potential and limitations of nitrate
and concern that anthropogenic loadings are driving it beyond stable isotopes to track nitrogen pollution sources in aquatic
Earth’s natural resilience boundaries7. Reactive nitrogen cascades systems, especially rivers, and to promote a data-based framework
through aquatic ecosystems differentially1, since some systems for further improving our understanding of the transformation
accumulate N, whereas others transform it through diverse bio- mechanisms of nitrogen for sustainable management and reme-
geochemical N-cycling processes like nitrification, denitrification, diation of N-contaminated waters.
N2-fixation, dissimilatory nitrate reduction (DNRA), ammonifi-
cation, and biological assimilation at rates dependent on the
Results
environmental conditions. These complexities make it difficult to
Overall assessment of global river and groundwater nitrate
unravel what point-based NO3− concentrations in rivers or their
data sets. Concentrations of nitrate in rivers and adjacent aquifers
connected aquifers embody at any point in time, apart from
deviated from normal distributions and were highly skewed
regulatory pollutant exceedances, and quantitative knowledge of
(skewness index > 2), hence median values were retained33. Of all
the roles of N-cycling processes in the terrestrial aquatic envir-
samples, rivers had substantively lower median NO3− con-
onments remains deficient.
centrations (0.3 ± 0.2 mg L−1, n = 2902) compared to ground-
Stable isotopes of NO3− (δ15N, δ18O) are used, particularly in
water (5.5 ± 5.1 mg L−1, n = 2291) (Supplementary Table 1).
the last decades, to help identify the sources of high N-pollution
Around 2% of river water samples exceeded the WHO (World
in aquatic systems8–12. Contemporary preparative and isotope
Health Organization) threshold of 50 mg L−1 (as NO3−), whereas
techniques enable fast low-cost isotopic analysis of 15N/14N and
18O/16O ratios to ppb concentrations to incorporate comparative in groundwater the exceedance was far higher (~34%). The
Kruskal–Wallis test indicated that nitrate concentration differ-
isotopic information from pristine aquatic environments[13, and
ences between rivers and groundwater subsets were significant
references therein]. Distinctive δ15N and δ18O biplot clusters
(p-value < 0.05) (Supplementary Table 2).
were initially proposed to “assign” organic and inorganic NO3−
The distribution patterns for δ15N and δ18O of NO3− in rivers
origins3,14,15, however, NO3− sources rarely exhibit unique
and groundwater deviated from normal distributions (Supplemen-
combinations of nitrogen (N) and oxygen (O) isotopic values as
tary Fig. 1). The isotope data were not as skewed as NO3−
shown by ambiguous or widely overlapping clusters (e.g., soil,
concentrations (skewness index < 2 for the number of records
manure/sewage, NH4+ fertilizer), which make straightforward
>30033), hence average values were retained to compare these
assignments problematic. Accordingly, others16–18 recommend
isotope variables among them. Outliers were mostly extreme values
including additional isotopes (e.g., δ11B), other chemicals (e.g.,
falling within the upper and lower tails of the distributions of the
pharmaceuticals, food additives), and/or biological markers (e.g.,
Quantile–Quantile (Q–Q) plots (Supplementary Fig. 1). The δ15N
chlorophyll-a, fecal coliforms) to better differentiate sources of
values of nitrate in rivers were slightly lower (+7.1 ± 3.8‰, n =
nitrogen pollution in freshwaters, particularly as related to
2902) than aquifers (+7.7 ± 4.5‰, n = 2291, p-value < 0.05).
municipal sewage, animal waste, industrial and atmospheric
Kendall14 presented an early compilation of nitrate isotope data
sources.
in aquatic systems and reported groundwater nitrate has
One common misperception in the interpretation of NO3−
considerably higher δ15N values than rivers, however, others found
isotopes in aquatic systems is that its isotopic composition is a
more positive δ15N nitrate values in surface waters than nearby
conservative tracer of N source(s), despite isotope fractiona-
groundwater15. Other case studies affirmed higher mean δ15N
tions during numerous biogeochemical transformations that
values for NO3− in shallow groundwater compared to local rivers
significantly alter the δ15N and δ18O values of nitrate19. Instead,
in urban waters (Manila, Bangkok, and Jakarta)34 or under
the δ15N and δ18O of NO3− in aquatic systems are more fre-
different land-use-based catchments12. Overall, the δ18O values of
quently a mixture of time and seasonally dependent N-source
nitrate in rivers and groundwaters worldwide were indistinguish-
(s) and cumulative isotopic fractionations that occur during
able from each other (+2.3 ± 6.2‰, n = 2790, vs +2.3 ± 5.4‰, n =
transport and biogeochemical transformation of dissolved N-
2235, p-value > 0.05, respectively) (Supplementary Tables 1 and 2).
species20–22. It is well-known that biological nitrate uptake
(assimilation) and denitrification processes preferentially pro-
cess the light isotopes, resulting in heavy isotope enrichment of Isotope variation with latitude. The global data set included river
residual nitrate14. Despite uncertainties in the assessment of and groundwater samples spanning from 67o N to 38o S LAT and
sources of nitrate pollution using δ15N and δ18O, these stable from 145o E to 123o W LON (Fig. 1). There were more samples
isotopes retain fundamental source and process information to between 30° N to 60° N than other latitudinal ranges, reflecting the
help decipher the complexity of N-biogeochemistry in aquatic preponderance of data from North America, Europe, and East
environments21,23,24. Asia. However, Central Asia, Central, and South America, Ocea-
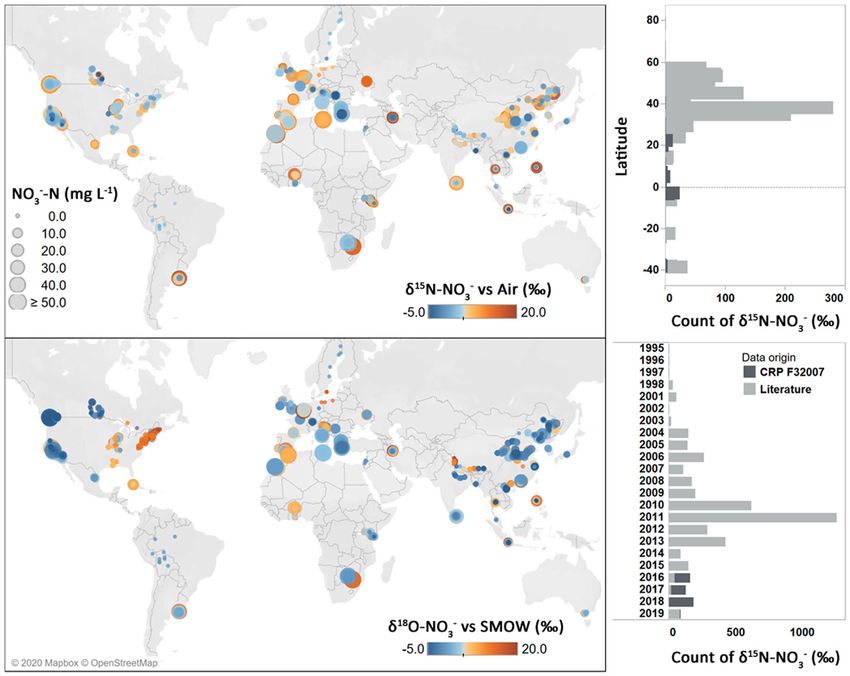
Common patterns of N-cycling processes using global spatial nia, and Africa are poorly represented for nitrate isotope data sets
data sets of NO3− and its stable isotopes are established for soils due to a lack of water N pollution studies in those areas. The δ15N
and plant matter25–28, but larger-scale spatiotemporal studies of and δ18O of nitrate were negatively correlated with latitude
nitrate in rivers and adjacent aquifers are lacking20,29–31. Here we for rivers (δ15N-NO3− = −0.07 ± 0.01 × Latitude + 10.14 ± 0.46,
2 COMMUNICATIONS EARTH & ENVIRONMENT | (2021)2:52 | https://doi.org/10.1038/s43247-021-00121-x | www.nature.com/commsenv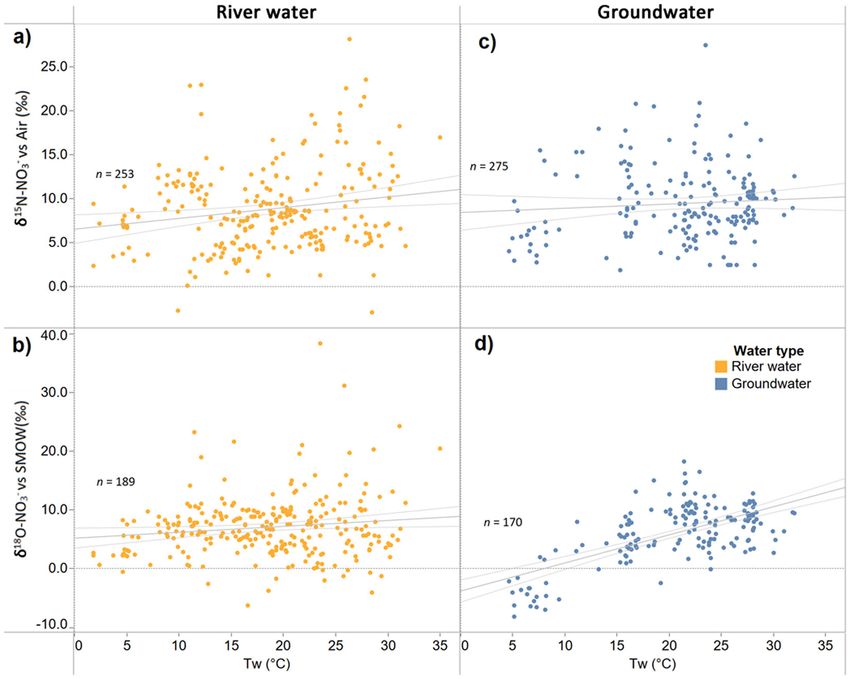
COMMUNICATIONS EARTH & ENVIRONMENT | https://doi.org/10.1038/s43247-021-00121-x                                                          ARTICLE

Fig. 1 Geographical distribution of δ15N and δ18O data for nitrate in river water and groundwater by number (#) of measurements by 0.1° latitude and
year of sample collection. The size of each circle corresponds to the concentration of NO3-N in mg L−1. The light and dark gray bars indicate the data were
retrieved from literature or the IAEA Coordinated Research Project (CRP), respectively. Most data were from 30° N and 60° N LAT and between 2010
and 2013.

p-value < 0.05, n = 521, R2 = 0.07; δ18O-NO3− = −0.12 ± 0.02 ×                 influence of δ18O from local water contributing to nitrate during
Latitude + 9.47 ± 0.79, p-value < 0.05, n = 506, R2 = 0.06) and                its transformations, we normalized the δ18O-NO3− to the δ18O-
groundwater (δ15N-NO3− = −0.15 ± 0.03 × Latitude + 14.59 ±                     H2O values from the same water sample wherever possible (i.e.,
1.16, p-value < 0.05, n = 301, R2 = 0.08; δ18O-NO3− = −0.30 ±                  “relative to in situ H2O” instead of “relative to SMOW”)31. The
0.03 × Latitude + 16.05 ± 1.43, p-value < 0.05, n = 299, R2 = 0.18)            normalization to in situ water 18O resulted in an improved but
(Supplementary Fig. 2 and Supplementary Table 3). When data                    weak correlation between δ18O-NO3−vs H2O and δ15N-NO3− for
from the Northern Hemisphere were considered separately, the                   river waters (δ18O-NO3−vs H2O = −0.21 ± 0.02 × δ15N-NO3−
correlation between δ15N and δ18O of NO3− and latitude yielded a               −0.33 ± 0.19, R2 = 0.09, p-value < 0.05, n = 946) and ground-
similar regression slope and intercept.                                        water (δ18O-NO3−vs H2O = −0.10 ± 0.02 × δ15N-NO3− −1.17 ±
                                                                               0.06, R2 = 0.15, p-value < 0.05, n = 1138). The slopes of the
Relationship between 15N and 18O of NO3−. Both river and                       “normalized” regression became negative and decreased from
groundwater nitrate revealed positive correlations between the                 ~0.6 to ~−0.2 for rivers and from ~0.4 to ~−0.1 for aquifers. The
δ18O and δ15N values (Fig. 2). The δ18O of NO3− was weakly but                 river water samples from warmer tropical areas (e.g., Kenya,
significantly correlated with δ15N for rivers (δ18O-NO3− = 0.64                 Ghana, Thailand) drove slopes to more negative δ18O and higher
± 0.03 × δ15N-NO3− − 2.51 ± 0.26, p-value < 0.05, n = 2445,                    δ15N values. Results of the least-square linear regression analyses
R2 = 0.13) and groundwater (δ18O-NO3− = 0.43 ± 0.02 × δ15N-                    of the isotopic variables for river water and groundwater subsets
NO3− − 0.99 ± 0.21, p-value < 0.05, n = 2172, R2 = 0.13). How-                 are summarized in Supplementary Table 4.
ever, river waters had a significantly (p-value < 0.05) higher
regression slope (0.64 ± 0.03) compared to groundwater (0.43 ±
0.02) (Fig. 2).                                                                Variation of nitrate isotopic composition with water tem-
   The influence of 18O in water and molecular O2 on the 18O of                 perature. Water temperature (Tw) is often used as a proxy for
NO3− produced during nitrification is typically described using a               potential rates of the microbial activity or primary productivity
simple isotope mass balance14:                                                 and was used to consider its relationship to the isotopic com-
                                                                               position of NO3− in rivers and aquifers36,37. In this assessment,
          δ18 O-NO
                  3 ¼ 2=3 ´ δ O-H2 O þ 1=3 ´ δ O-O2
                             18               18
                                                                        ð1Þ    the temperature was the river or groundwater temperature at the
                                                                               time of sampling without further considering overall climatic or
Eq. (1). Studies investigating nitrification in aquatic systems                 seasonal aspects. Detailed results of least-square linear regression
found the δ18O of NO3− does not necessarily conform to this                    analyses of the nitrate isotopic variables for river water and
model, even when the δ18O of O2 is assumed constant or in                      groundwater are depicted in Supplementary Table 5. The δ15N of
equilibrium with air35 (+23.5 − +24.2‰). To reduce the                         NO3− in rivers showed a weak but significant positive correlation

COMMUNICATIONS EARTH & ENVIRONMENT | (2021)2:52 | https://doi.org/10.1038/s43247-021-00121-x | www.nature.com/commsenv                                   3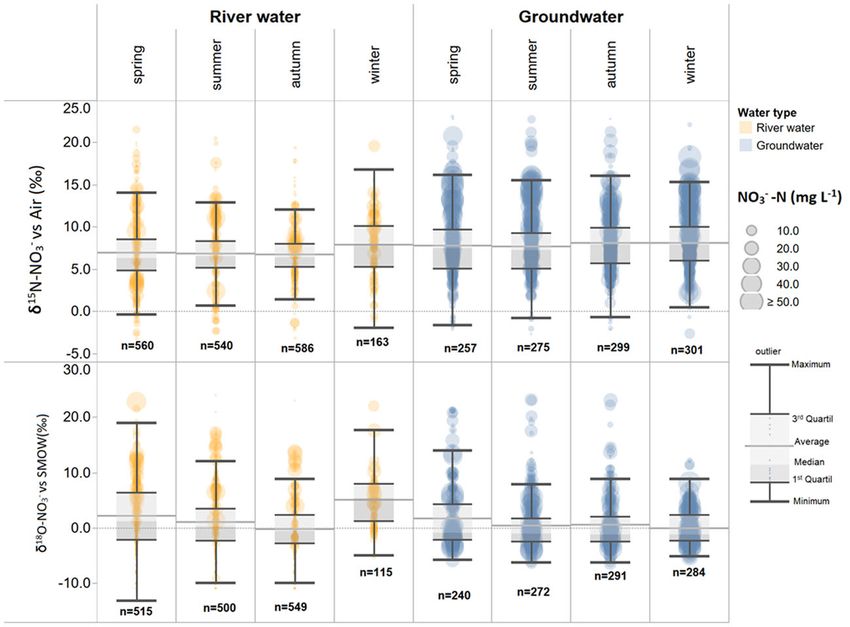
ARTICLE                                                 COMMUNICATIONS EARTH & ENVIRONMENT | https://doi.org/10.1038/s43247-021-00121-x

Fig. 2 δ18O vs δ15N of NO3− in rivers and groundwater. Symbol size denotes NO3-N concentration in mg L−1. The δ18O values are relative to SMOW and
normalized to in situ H2O, as described in Venkiteswaran et al.31. The results of the linear regression models of panels a–d are in Supplementary Table 4.

with Tw (δ15N-NO3− = 0.12 ± 0.04×Tw + 6.55 ± 0.82, R2 = 0.03,                 ± 6.0‰, n = 268, p-value < 0.05) compared to all other seasons.
p-value < 0.05, n = 253), but for groundwater, there was no cor-              However, considering that groundwater replenishment usually
relation (δ15N-NO3− = 0.05 ± 0.05×Tw + 8.45 ± 1.03, R2 = 0.01,                takes place in the wet period (October–April) in the northern
p-value > 0.05, n = 189) (Fig. 3). The δ18O of NO3− in rivers had             hemisphere, we examined the difference in the isotopic values
a weak but significant positive correlation with Tw (δ18O-                     between the high recharge period and the low recharge period
NO3− = 0.10 ± 0.04×Tw + 5.19 ± 0.90, R2 = 0.02 p-value < 0.05,                (May–September). There was no significant difference in δ15N
n = 275), whereas in groundwater the correlation was very strong              and δ18O of NO3− between the two periods, although the δ18O of
(δ18O-NO3− = 0.48 ± 0.04×Tw − 3.79 ± 0.95, R2 = 0.41, p-value                 NO3− was slightly lower in the high recharge period (Supple-
 0.05), but a ~1‰ increase in δ15N in winter compared                n = 137) vs temperate (C) (+4.4 ± 5.4‰, n = 722) and cold (D)
to all other seasons (+7.7 ± 3.8‰, n = 200, p-value < 0.05). The              (+3.8 ± 5.6‰, n = 275) climates. Arid climates (B) showed sig-
average δ18O values of nitrate in rivers revealed a ~2‰ decrease              nificantly higher δ15N values for nitrate (+8.9 ± 6.0‰, n = 74)
from spring to autumn (from + 2.2 ± 5.9‰, n = 530 to −0.1 ±                   compared to temperate (C) or cold climate (D), but similar δ18O
4.5‰, n = 562, p-value < 0.05), and a ~4.5‰ increase from                     values for nitrate (+5.5 ± 8.1‰, n = 74) compared to other cli-
autumn to winter (from −0.1 ± 4.5‰, n = 562 to +4.4 ± 4.5‰,                   mate types. However, the arid climate zone had fewer data
n = 149, p-value < 0.05).                                                     compared to the other climate types due to a limited number of
   Shallow aquifers showed no δ15N seasonality (p-value >0.05) in             river water nitrate studies in those climates.
mean NO3− between spring, summer, autumn, and winter (+7.8                       The shallow aquifers had the lowest δ15N values in temperate
± 4.4‰, +7.7 ± 3.9‰, +8.1 ± 3.8‰, and +8.1 ± 3.5‰, respec-                    (C) (+7.8 ± 4.1‰, n = 986) and arid (B) climates (+7.3 ± 4.1‰,
tively). The average δ18O of NO3− in groundwater was similar in               n = 522) and the highest in tropical/equatorial (A) (+8.9 ± 5.5‰,
summer, autumn, and winter (+0.6 ± 4.8‰, +0.6 ± 4.6‰, and                     n = 44) and cold (D) climates (+9.0 ± 5.2‰, n = 24). However,
+0.1 ± 3.3‰, respectively) but was ~2‰ higher in spring (+2.1                 these differences were indistinguishable (p-value > 0.05), hence no

4             COMMUNICATIONS EARTH & ENVIRONMENT | (2021)2:52 | https://doi.org/10.1038/s43247-021-00121-x | www.nature.com/commsenv
COMMUNICATIONS EARTH & ENVIRONMENT | https://doi.org/10.1038/s43247-021-00121-x                                                              ARTICLE

Fig. 3 Variation of δ18O and δ15N of NO3− in river waters and groundwater with water temperature (Tw) in °C. The linear regression of δ18O-NO3− (‰)
vs Tw (°C) was more significant for groundwater (R2 = 0.41) than river waters (R2 < 0.02). The results of the linear regression models for panels a–d are in
Supplementary Table 5.

Fig. 4 Variation of δ15N and δ18O of nitrate in rivers and groundwater classified by season. The symbol size expresses the NO3-N in mg L−1. Higher
average δ15N and δ18O values in river water nitrate are found in winter. Error bars show average (gray line), median (light to dark gray division), 1st and 3rd
quartile, and whiskers extend to 1.5 interquartile range.

COMMUNICATIONS EARTH & ENVIRONMENT | (2021)2:52 | https://doi.org/10.1038/s43247-021-00121-x | www.nature.com/commsenv                                       5
ARTICLE COMMUNICATIONS EARTH & ENVIRONMENT | https://doi.org/10.1038/s43247-021-00121-x
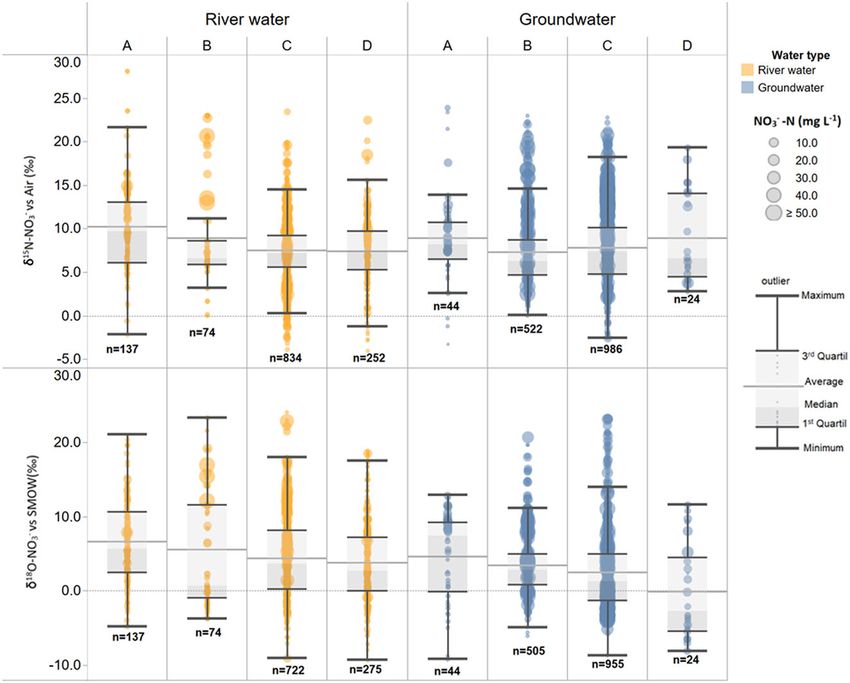
Fig. 5 Variation of δ15N and δ18O of NO3− in rivers and groundwater by climate. A: Tropical/Equatorial, B: Arid, C: Temperate, D: Cold. Symbol size
expresses the NO3-N concentration (mg L−1). Tropical climates had the highest δ15N and δ18O values for nitrate in rivers. Error bars show average (gray
line), median (light to dark gray division), 1st and 3rd quartile, and whiskers extend to 1.5 interquartile range.
N-isotopic impact solely from climate could be found. Ground- attenuation, and cycling is achieved by closed-system nitrification
water nitrate δ18O values exhibited the same pattern as rivers, and denitrification and uncommonly by DNRA or anammox29,39.
with lower δ18O values in cold (D) climates (−0.1 ± 6.4‰, n = Shallow aquifers are the recipients of NO3− transport from
24), that differed significantly from those in tropical (A) (+4.6 ± residual leaching from soils and the unsaturated zone, where
6.0‰, n = 44) climates. The average δ18O of NO3− values in arid NH4+ and other nitrogenous compounds are favorably oxidized
(B) (+3.4 ± 4.0‰, n = 505) and temperate (C) (+2.5 ± 4.9‰, but can also be adsorbed or reduced depending on soil retention
n = 505) climates were significantly different from the other two capacity40–43. Pronounced denitrification effects have been
climate types. Cold climates had fewer δ15N and δ18O records for reported for some unconfined aquifers30,44,45.
groundwater compared to the other three climate types, which Regression analysis of δ18O vs δ15N for river waters and
could bias this result. Rivers and groundwater showed no clear- groundwater generated slopes suggesting an “apparent” deni-
cut relationship between δ15N and NO3− by climate type trification trend (~0.5)3,31. However, denitrification is unlikely to
(Supplementary Fig. 5). be the only process for the observed δ18O:δ15N slope, which is
expected to be canonical under closed-system conditions46. The
lack of a clear pattern between the isotopes and NO3− con-
Discussion centration indicates that multiple processes that recycle nitrogen
The lower median NO3− concentrations in rivers compared to occur in river water systems. Granger and Wankel19 proposed
adjacent shallow aquifers can be explained by the decrease of that the deviations from the canonical slope of 1 for denitrifica-
agricultural N inputs at the industrialized countries of the tion can be due to concurrent NO3‐ production catalyzed by
Northern hemisphere due to more severe fertilization regulations, nitrification and/or anammox.
whereas many aquifers do not yet exhibit decreasing nitrate A non-zero normalized slope suggests that H2O was not the
contents. This is due to much longer mean residence times for N only factor controlling the oxygen isotopic composition of nitrate
in the unsaturated zone and the aquifer38, which is controlled by (Eq.1). The large decrease in the slopes of the regression after
several factors such as the thickness and hydro-lithological normalization for in situ water confirmed a strong dependence of
characteristics of the unsaturated zone, the spatiotemporal var- δ18O of NO3− on the δ18O of water when the NO3− is formed by
iations in recharge rate, and the diffusive and dispersion processes oxidation of nitrite or ammonium42. However, in situ water
through the nitrogen stock in the soil and the unsaturated zones.
normalizations do not consider potential large daily or seasonal
The lower median NO3− concentrations in rivers can also be
variations in the δ18O of in situ gaseous or dissolved O235
explained by a complex combination of riparian and in situ
attenuation and uptake by biological productivity, seasonal dilu- involved in the N-cycling processes. Thus, the observed negative
tion (e.g., runoff, snowmelt), differential baseflow connectivity, deviations of the slopes from “zero” suggest an influence of δ18O-
and long-term dispersion processes, which lowers the ambient O2 on the isotopic composition of nitrate. The latter may be more
NO3− concentration in rivers. Given that NO3− sources are profound for rivers than aquifers. Investigations of δ18O-O2 in
difficult to “fingerprint” using only stable isotopes, we suggest productive rivers show a preponderance of lower δ18O values (as
that the notable differences in NO3− concentrations between low as +3.4‰), particularly during the growing season due to
river waters and adjacent aquifers are attributable to unique photosynthetic processes35,47,48. Tropical rivers typically show
locational differences in in situ N-cycling processes. As microbes high rates of primary production, all-year-round growth, and less
have low biomass in most groundwater systems, NO3− seasonal variation in solar irradiance than temperate latitudes49.
6 COMMUNICATIONS EARTH & ENVIRONMENT | (2021)2:52 | https://doi.org/10.1038/s43247-021-00121-x | www.nature.com/commsenvCOMMUNICATIONS EARTH & ENVIRONMENT | https://doi.org/10.1038/s43247-021-00121-x ARTICLE On a diel basis, δ18O-O2 is lowest during the day due to the with Mean Annual Precipitation (MAP) at a global scale that was production of DO by photosynthesis from substrate water, attributed to soil and organic matter properties26. Martinelli whereas during the night δ18O-O2 can be higher than the et al.28 reported higher values for δ15N in N-rich soils and foliage atmospheric equilibrium value due to preferential consumption from tropical forests compared to temperate forests. Brookshire of light O2 by respiring organisms with inward diffusion of iso- et al.57 suggests that higher MAT enhances soil N-cycling as seen topically heavy O2 from the atmosphere50. Thus, the negative by 15N enrichment in soil organic matter and the NO3− con- in situ normalized slopes of the δ18O regression line for rivers centration of tropical rivers. suggest some influence of 18O depleted O2, especially for highly The seasonality of δ15N and δ18O of nitrate in temperate rivers productive rivers where oxygen supersaturation and 18O2 deple- showed a pattern of isotopic enrichment of nitrate in spring and tion and nitrification coexist. But even if the δ18O-O2 contribu- summer compared to autumn, which could be attributed to tion was considered as a fixed atmospheric constant, any kinetic higher biological assimilation in surface water systems in the and equilibrium isotope fractionation during oxygen exchange warmer seasons58. The δ15N values during winter compared to between H2O and NO2− before final oxidation to NO3− may also other seasons appeared to more closely reflect mixing of multiple result in deviations from a 2:1 mixing ratio line (δ18O-H2O:δ18O- organic-pollutant N-sources (e.g., sewage wastes, urban, and O2)42. Therefore, the relationship between δ18O-NO3− and δ18O- livestock wastewaters)9,24 as a result of reduced application and H2O can be used to detect isotope fractionation effects related to leaching of fertilizers, and restricted microbial and primary pro- the incorporation of oxygen atoms during ammonia oxidation to ductivity during the cold season59. Additionally, in the cold nitrite (NO2−), which readily exchanges oxygen atoms with season, the relative fraction of NO3− denitrified vs assimilated is in situ water during the oxidation of the latter to nitrate51. higher, since increased N-loadings in winter or early spring Conversely, for aquifers the δ18O-O2 values in recharge zone gas runoff are often associated with high discharge events and often deviate from the air (+23.5‰), but mostly in a positive snowmelt57. Elevated δ18O of NO3− during winter can also be direction up to >+39‰ as soil O2 is consumed by microbial attributed to δ18O-H2O and δ18O-O2 variation combined with respiration52,53. The substantial variability in the δ18O of NO3− variable soil/water and land-use properties of the different associated with nitrification is also dependent on soil and water catchments. For example, high δ18O values in nitrate can be properties and is also a function of residence time54. attributed to the influence of δ18O-O2 (Eq.1), especially in The difficulty to elaborate clear relationships between 18O of respiration-influenced ecosystems48, increased atmospheric H2O, O2, and NO3− is also due to the temporal variability of the NO3− deposition (>+30.0‰)14, especially during high discharge oxygen variables and underscores the need for further investi- events, or artificial NO3− fertilizer (>20.0‰)14 mixed with gations to better understand N-dynamics related to cycling. nitrification-derived NO3− in soils and infiltrating pore waters, Unfortunately, oxygen isotope normalization processes that especially in agricultural areas54. Full equilibration or O-isotope consider all potential reactive oxygen pools (e.g., in situ H218O exchange of NO2− with H2O before being oxidized to NO3− in and 18O2) involved in N-cycling processes have not been fully soils, local respiration, and rapid redox cycling between NO3− investigated to our knowledge55. New studies measuring δ18O- and NO2− can also potentially increase δ18O-NO3− values19,54,60. NO3− and δ18O-H2O and δ18O-O2 in the same water are Shallow phreatic aquifers showed strongly dampened seasonal therefore required to better explain the patterns and variations of nitrate and isotopic variability compared to river waters. Given the oxygen isotope composition of nitrate in rivers and NO3− concentrations are generally buffered in aquifers over groundwater. longer timeframes (e.g., years), the range of δ15N values in The δ15N and δ18O of NO3− in rivers showed a positive cor- groundwater reflect longer-term climatic and land-use changes or relation with Tw likely reflecting the influence of higher microbial established processes taking place in the soil and the unsaturated activity and productivity with temperature and thus the biogeo- zone before NO3− leaches into the groundwater system30,61. The chemical N processing rates. Higher δ15N values in rivers are lack of a clear seasonal variation of δ15N and δ18O of NO3− in likely driven by enhanced N-cascading. This means that due to groundwater is attributed to nitrifying and mixing of nitrate increased temperature, metabolic rates accelerate, which pro- sources introduced at different points or periods in time due to gressively enriches 15N in NO3− compared to its source sig- variable residence times (from months to years) in the unsatu- nature14. Average δ15N values of nitrate >7‰ typically suggest rated zone38,62. There was no significant difference in δ15N and that nitrogen has undergone multiple recycling after its initial δ18O of NO3− between the high and low recharge periods, fixation from N2 (either biological or Haber–Bosch), as these although the δ18O of NO3− was slightly lower in the high processes bring reactive N in the plant–soil–water continuum recharge period. This could imply a change in recharge source with a 15N value of ~0‰56. An observed weak positive correla- water (e.g., snowmelt vs rains) or the 18O of O2, which combined tion of δ18O-NO3− with Tw and a negative correlation with affect the 18O values of microbially mediated nitrate. Because latitude suggests that ambient δ18O-H2O has some impact on groundwater temperatures are usually stable and generally reflect nitrate isotope values. MATs37 (and in situ δ18OH2O correlates with air temperature), it The pattern of decreasing δ15N-NO3− in rivers with latitude was unsurprising to see a correlation of δ18O of NO3− with Tw. agrees with the N isotopic climatic patterns observed for soil This suggests we cannot discount the possibility that 18O variance organic matter (SOM)25. The pattern of higher δ15N-NO3− of groundwater nitrate is controlled by additional processes or values with the water temperature in rivers is observed from cold isotope fractionations affecting O2 involved in soil and vadose (D) to tropical (A) climates. Amundson et al.25 observed a weakly zone nitrification53. However, the relationship between δ18O in positive correlation between soil organic matter (SOM) δ15N and nitrate with latitude showed the highest oxygen isotope values Mean Annual Temperature (MAT) (slope = 0.13, R2 = 0.11, p- tended to be at the warmer tropical/equatorial climates and can value < 0.1, n = 85) for arid and tropical zones. A decrease in be attributed to a systematic change in the δ18O of associated SOM δ15N with lower MAT was seen at sites between about H2O (Eq.1) with decreasing latitude, continentality or altitude63. 10–40 degrees North or South albeit with a smaller data set In summary, although rivers and shallow aquifers are primary (slope = −0.08, R2 = 0.09, p-value < 0.04, n = 49)27. Craine and often well connected receiving environments for land-based et al.26 observed a positive trend of SOM δ15N with MAT (slope anthropogenic N-pollution, shallow aquifers have five times = 0.18, p-value < 0.001, MAT > 9.8 °C) and a negative correlation higher median NO3− concentration than rivers, indicating that COMMUNICATIONS EARTH & ENVIRONMENT | (2021)2:52 | https://doi.org/10.1038/s43247-021-00121-x | www.nature.com/commsenv 7
ARTICLE                                               COMMUNICATIONS EARTH & ENVIRONMENT | https://doi.org/10.1038/s43247-021-00121-x

NO3− is more persistent in aquifers and has long residence times,           especially in productive systems, that can mask the original iso-
given lower microbial activity and a limited number of possible N-          topic source signal. Examination of N-cascading aspects are cri-
removal process mechanisms (e.g., denitrification). River waters             tically important to inform the implementation of beneficial land
and groundwater receive nitrate with δ15N and δ18O values                   and agricultural management strategies aiming at mitigating
spanning the expected natural and anthropogenic ranges (from                increasingly serious nitrogen pollution in Earth’s rivers and
−10‰ to +26‰ for δ15N and −17‰ to +25‰ for δ18O)3,                          aquifer systems. The clear isotopic linkage of the N-cascading in
indicating a globally consistent suite of N-sources. We identified           rivers to key climate parameters may have implications for future
some global drivers of the isotopic variability of nitrate in rivers        water quality management under changing climatic conditions.
and groundwater, recognizing that this simplification required
aggregating many possible diverse nitrate sources typically
                                                                            Methods
observed at the catchment or complicated by seasonal variability.           Literature data collection. A literature search was conducted using online tools
A deeper analysis of latitude and climatic factors is recommended           and bibliographic databases (e.g., Web of Science, Google Scholar, Scopus, etc.) for
to better distinguish the role of soil properties, precipitation pat-       papers containing nitrate and isotope data from rivers and adjacent aquifers. We
terns, land-use, and agricultural practices. The δ18O vs δ15N               reported shallow aquifer data because many of the river studies contained data for
                                                                            adjacent aquifers owing to the possible connectivity of groundwater to riverine
relationships observed suggested combinations of multiple bio-              baseflow, although in most papers any connectivity of adjacent aquifers to the
geochemical (e.g., nitrification, anammox) and mixing processes              rivers was unconfirmed. Data compilations were restricted to journal articles where
taking place in rivers and aquifers in different seasons, which are         both δ15N and δ18O values of nitrate are available, and samples were then classified
not easily distinguishable with infrequent or synoptic samplings.           as River or Groundwater. Scientific papers focusing on precipitation, deep aquifers,
                                                                            soils, tap water, seawater, wastewater effluent, or artificial isotopic tracers were
River water nitrate had higher δ15N and δ18O values in winter,              omitted. The list of cited data used is found in Supplementary References.
suggesting a change in N-processing due to lowered temperatures
and productivity and perhaps less alteration of the original iso-
topic composition of multiple organic-related N-sources. Across a           Data preparation. Established data preparation procedures resulted in a curated
                                                                            data set suitable for statistical analysis64. Data were extracted from tables and
wide range of global climate types, river waters and groundwater            supplementary materials, maps, and text (Supplementary Fig. 6). If the original
showed systematically higher δ15N and δ18O values in the arid and           work did not provide location coordinates, approximate latitude and longitude
tropical/ equatorial climates, mirroring an increase in MAT. This           were obtained using Google Earth (https://www.google.com/earth/). The data
relationship was also seen in the increase in δ15N of nitrate in            assessment affirmed that NO3− was the species linked to the reported isotope ratios
                                                                            (15N/14N and 18O/16O) along with verification of units (as NO3− or -N) and
rivers and groundwater with decreasing latitude and the positive            concentration (e.g., mg L−1, µmol L−1, μg L−1, etc.). Nitrate concentration data
correlation between δ15N and δ18O with Tw.                                  were converted to a common unit (mg L−1 -N) and sampling date format (e.g.,
   We have provided a first-order attempt to identify global                 2016-03-01) (Supplementary Fig. 7). The 18O/16O of in situ H2O associated with a
patterns in the isotopic composition of nitrate related to common           nitrate sample, if available, was also included in the data set. The ratios of 15N/14N
                                                                            and 18O/16O of NO3− and 18O/16O of H2O were reported in δ notation in units of
environmental factors, such as climate and season impacting N-              per mille (‰), where δ = (Rsample/RAIR or SMOW − 1) and R is the ratio of 15N/14N
cascade-related processes in rivers and associated shallow                  or 18O/16O in N2 in atmospheric air (AIR) or Standard Mean Ocean Water
groundwaters. Our findings highlight the importance of water                 (SMOW), respectively.
temperature as a driving force of biogeochemical microbial                      Seasons were identified separately for each Hemisphere (N vs S) using the
activity and productivity in rivers, however, the impact on the             reported sampling date (month) to ensure consistency. Each sample location was
                                                                            coded using the Köppen climatic classification65. Due to limited data from high
δ15N and δ18O of nitrate differed when examined on a seasonal or            latitudes, river and groundwater data were classified into four climatic groups; A:
on a climate basis. Our findings suggest that higher frequency or            Equatorial/Tropical climate, B: Arid climate, C: Temperate climate, D: Cold
seasonal sampling of river water systems is of critical importance          climate. Additional categorical and site information associated with the nitrate and
to better and more deeply understand annual N-pollution                     isotopic data was obtained from the publications and is included in Supplementary
                                                                            Table 6. Important variables, such as Eh, dissolved O2 (DO), dissolved organic
dynamics, and winter sampling appears to better reflect the N-               nitrogen (DON), precipitation per catchment, Total Nitrogen (TN), that might
isotopic signals of the anthropogenic sources of nitrate. Further           contribute to a better understanding of the global N isotope variations of nitrate
investigations to study N-cycling in river waters at a higher fre-          were either lacking or unavailable. For example, DO values were only available in
quency are urgently needed (e.g., seasonal, diel) and systematic            7.7% of the river waters data set and thus were excluded from further processing.
data collections of nitrate, particularly from the southern hemi-
sphere climate types, such as arid and polar, for which data are            Data curation. Excessively high or suspicious values of NO3− and other N-species
limited or absent, are strongly recommended. Recent technolo-               concentrations were verified by a careful review of the original paper. In some
gical advances in isotopic assays of nitrate have vastly reduced the        cases, authors were contacted to provide clarification. The δ15N and δ18O values of
                                                                            nitrate were sorted to avoid duplication from publications reusing the same data
analytical and cost barriers to conduct high-frequency δ15N and             sets26. Almost all groundwater data (~95%) was from adjacent shallow phreatic
δ18/17O of nitrate. Other key parameters, such as DO, redox                 aquifers of
COMMUNICATIONS EARTH & ENVIRONMENT | https://doi.org/10.1038/s43247-021-00121-x ARTICLE Statistical evaluation. To evaluate the data, graphical plots by sample type (river 17. Fenech, C., Rock, L., Nolan, K., Tobin, J. & Morrissey, A. The potential for a or groundwater) were employed along with frequency distribution diagrams suite of isotope and chemical markers to differentiate sources of nitrate (histogram, Q–Q plot, P–P plot, boxplot) and metrics such as Pearson skewness. contamination: a review. Water Res. 46, 2023–2041 (2012). To check for normality, Shapiro–Wilk, and Kolmogorov–Smirnov tests were 18. Widory, D., Kloppmann, W., Chery, L., Bonnin, J., Rochdi, H. & Guinamant, applied. The mean and standard deviation (SD) were used to describe the variation J. L. Nitrate in groundwater: an isotopic multi-tracer approach. J. Contam. of variables with a skewness index of
ARTICLE                                                       COMMUNICATIONS EARTH & ENVIRONMENT | https://doi.org/10.1038/s43247-021-00121-x

45. Romanelli, A., Soto, D. X., Matiatos, I., Martinez, D. E. & Esquius, S. A         Acknowledgements
    biological and nitrate isotopic assessment framework to understand                The research was partly funded by the International Atomic Energy Agency (IAEA)
    eutrophication in aquatic ecosystems. Sci. Total Environ. 715, 136909 (2020).     through the Coordinated Research Project (CRP) F32007. Thanks to C. Douence and
46. Böttcher, J., Strebel, O., Voerkelius, S. & Schmidt, H.-L. Using isotope          L. Poeltenstein for conducting nitrate isotope and water isotope measurements.
    fractionation of nitrate-nitrogen and nitrate-oxygen for evaluation of            Argentina: Acknowledges support of the National Scientific and Technical Research
    microbial denitrification in a sandy aquifer. J. Hydrol. 114, 413–424 (1990).      Council-CONICET [PIP 0350] and National Agency for Scientific and Technological
47. Hotchkiss, E. R. & Hall, R. O. Jr. High rates of daytime respiration in three     Promotion [PICT 1147/17]. Canada: Acknowledges the support of the Natural
    streams: Use of δ18OO2 and O2 to model diel ecosystem metabolism. Limnol.         Sciences and Engineering Research Council of Canada (NSERC), [RGPIN-2018-
    Oceanogr. 59, 798–810 (2014).                                                     06389]. Chile: Acknowledges project ANID/FONDAP/15130015. China: Acknowl-
48. Wassenaar, L. I., Venkiteswaran, J. J., Schiff, S. L. & Koehler, G. Aquatic       edges the support of the National Key R&D Program of China (Grant #
    community metabolism response to municipal effluent inputs in rivers               2016YFA0601002). Finland: Acknowledges the support of the Academy of Finland
    quantified using diel δ18O values of dissolved oxygen. Can. J. Fish. Aquat. Sci.   funding (Grant # 287469). Italy: Acknowledges the support of the Cariplo Foun-
    67, 1232–1246 (2010).                                                             dation (INTEGRON Project, Grant # 2015-0263). Malaysia: Acknowledges the
49. Davies, P. M., Bunn, S. E., & Hamilton, S. K. Tropical Stream Ecology (2008).     support of Universiti Sains Malaysia’s short-term grant (USM) [304/PTEKIND/
50. Parker, S. R., Poulson, S. R., Gammons, C. H. & DeGrandpre, M. D.                 6315079] and assistance from Kerian District Department of Drainage and Irrigation
    Biogeochemical controls on diel cycling of stable isotopes of dissolved O2 and    Malaysia. UK: Acknowledges the support of NERC National Capability funding and
    dissolved inorganic carbon in the Big Hole River, Montana. Environ. Sci.          the permission of the Director of the British Geological Survey. USA: Acknowledges
    Technol. 39, 7134–7140 (2005).                                                    the Atmospheric and Geospace Sciences National Science Foundation Postdoctoral
51. Buchwald, C., Santoro, A. E., McIlvin, M. R. & Casciotti, K. L. Oxygen isotopic   Fellowship (AGS 1624618). Vietnam: The sampling and analysis conducted in
    composition of nitrate and nitrite produced by nitrifying cocultures and          Vietnam were partly funded by the UKRI GCRF Living Deltas Hub under Grant
    natural marine assemblages. Limnol. Oceanogr. 57, 1361–1375 (2012).               Reference NE/S008926/1.
52. Angert, A., Luz, B. & Yakir, D. Fractionation of oxygen isotopes by respiration
    and diffusion in soils and its implications for the isotopic composition of
    atmospheric O2. Glob. Biogeochem. Cycles 15, 871–880 (2001).
                                                                                      Author contributions
                                                                                      I.M. and L.I.W. conceived and wrote the paper. I.M. and L.R.M. undertook the formal
53. Wassenaar, L. I. & Hendry, M. J. Dynamics and stable isotope composition of
                                                                                      analysis and visualization of the work. J.J.V., D.C.G., P.B., and E.S. discussed the results
    gaseous and dissolved oxygen. Ground Water 45, 447–460 (2007).
                                                                                      and provided critical reviews and edits of the final manuscript. F.-J.Y., G.M., C.A.-H.,
54. Boshers, D. S., Granger, J., Tobias, C. R., Bohlke, J. K. & Smith, R. L.
                                                                                      C.B., L.B., N.V.E., W.F., J.R.F., A.G., N.K., S.-L.L., M.T.N.L., S.P., V.R., D.S.R., A.R., P.S.,
    Constraining the oxygen isotopic composition of nitrate produced by
                                                                                      F.T., D.A.T., W.W., and N.W. contributed to the review and editing of the final
    nitrification. Environ. Sci. Technol. 53, 1206–1216 (2019).
                                                                                      manuscript.
55. Mader, M., Schmidt, C., van Geldern, R. & Barth, J. A. C. Dissolved oxygen in
    water and its stable isotope effects: a review. Chem. Geol. 473, 10–21 (2017).
56. Fogel M. L., Cifuentes L. A. Topics in Geobiology (1993).                         Competing interests
57. Brookshire, E. N. J., Hedin, L. O., Newbold, J. D., Sigman, D. M. & Jackson, J.   The authors declare no competing interests.
    K. Sustained losses of bioavailable nitrogen from montane tropical forests.
    Nat. Geosci. 5, 123–126 (2012).
58. Mayer, B. & Wassenaar, L. I. Isotopic characterization of nitrate sources and     Additional information
    transformations in Lake Winnipeg and its contributing rivers, Manitoba,           Supplementary information The online version contains supplementary material
    Canada. J. Great Lakes Res. 38, 135–146 (2012).                                   available at https://doi.org/10.1038/s43247-021-00121-x.
59. Price, P. B. & Sowers, T. Temperature dependence of metabolic rates for
    microbial growth, maintenance, and survival. Proc. Natl Acad. Sci. USA 101,       Correspondence and requests for materials should be addressed to I.M.
    4631–4636 (2004).
60. Mariotti, A. et al. Experimental-determination of nitrogen kinetic isotope        Peer review information Primary handling editor: Teresa Ortner
    fractionation - some principles - illustration for the denitrification and
    nitrification processes. Plant Soil 62, 413–430 (1981).                            Reprints and permission information is available at http://www.nature.com/reprints
61. Loo, S. E., Ryan, M. C., Zebarth, B. J., Kuchta, S. H., Neilsen, D. & Mayer, B.
    Use of δ15N and δ 18O values for nitrate source identification under irrigated     Publisher’s note Springer Nature remains neutral with regard to jurisdictional claims in
    crops: a cautionary vadose zone tale. J. Environ. Qual. 46, 528–536 (2017).       published maps and institutional affiliations.
62. Savard, M. M., Paradis, D., Somers, G., Liao, S., & van Bochove, E. Winter
    nitrification contributes to excess NO3- in groundwater of an agricultural
    region: a dual-isotope study. Water Resour. Res. 43, W06422 (2007).                                 Open Access This article is licensed under a Creative Commons
63. Clark, I. D. & Fritz, P. Environmental Isotopes in Hydrogeology (1997).                             Attribution 4.0 International License, which permits use, sharing,
64. Du, E. A database of annual atmospheric acid and nutrient deposition to           adaptation, distribution and reproduction in any medium or format, as long as you give
    China’s forests. Sci Data 5, 180223 (2018).                                       appropriate credit to the original author(s) and the source, provide a link to the Creative
65. Beck, H. E., Zimmermann, N. E., McVicar, T. R., Vergopolan, N., Berg, A. &        Commons license, and indicate if changes were made. The images or other third party
    Wood, E. F. Present and future Koppen-Geiger climate classification maps at        material in this article are included in the article’s Creative Commons license, unless
    1-km resolution. Sci Data 5, 180214 (2018).                                       indicated otherwise in a credit line to the material. If material is not included in the
66. Coplen, T. B., Qi, H., Revesz, K., Casciotti, K., & Hannon J. E. in Techniques    article’s Creative Commons license and your intended use is not permitted by statutory
    and Methods (2007).                                                               regulation or exceeds the permitted use, you will need to obtain permission directly from
67. American Public Health Association. Standard Methods for the Examination          the copyright holder. To view a copy of this license, visit http://creativecommons.org/
    of Water and Wastewater 3–37 (1998).                                              licenses/by/4.0/.
68. Davis, J. C. & Sampson, R. J. Statistics and Data Analysis in Geology (1986).
69. Draper, N. R. & Smith, H. Applied Regression Analysis (1998).
70. R Core Team. R Team: A Language and Environment for Statistical                   © The Author(s) 2021
    Computing. https://www.R-project.org (2018).

10              COMMUNICATIONS EARTH & ENVIRONMENT | (2021)2:52 | https://doi.org/10.1038/s43247-021-00121-x | www.nature.com/commsenv
You can also read