Global Response of Clear-Air Turbulence to Climate Change - Professor Paul D. Williams University of Reading, UK
←
→
Page content transcription
If your browser does not render page correctly, please read the page content below
Global Response of Clear-Air Turbulence
          to Climate Change
         Professor Paul D. Williams
         University of Reading, UK
Climate change impacts on aviation
                                                            Stronger jet-stream
                  Shifting wind patterns                    wind shears increase
                  modify optimal flight                     clear-air turbulence
                      routes and fuel
                       consumption
                                                     More extreme
                                                     weather causes
                                  Warmer air         disruptions and
                                imposes take-off          delays
                               weight restrictions
 Rising sea levels and
storm surges threaten
    coastal airports

                                                     Puempel & Williams (2016)
                                                     ICAO Environmental Report
The acceleration of the jet stream
Pacific Atlantic
Jet-stream
changes driven by C20
CO2 in IPCC (10 m/s
climate simulations contours)
Stronger eastward
winds & windshears
at flight cruising
altitudes
C21 – C20
(0.25 m/s
u T
contours)
z y
Delcambre et al. (2013)
Changing LHR↔JFK flight times

Likelihood of taking under 5 h 20 min   Likelihood of taking over 7 h 00 min
more than doubles from 3.5% to 8.1%     nearly doubles from 8.6% to 15.3%

                                                            Williams (2016)
Changing LHR↔JFK flight times
• Have these changes already begun?
   – The North Atlantic jet stream wind speeds reached 250 mph on
     8-12 January 2015
   – An eastbound JFK→LHR crossing took only 5 h 16 min, which is
     the current non-Concorde record
   – Westbound LHR→JFK crossings took so long that two flights had to
     make unscheduled refuelling stops in Maine

• Extrapolation to all transatlantic traffic (600 crossings per day)
  suggests that aircraft will collectively be:
   – airborne for an extra 2,000 hours each year
   – burning an extra 7.2 million gallons of jet fuel at a cost of $22 million
   – emitting an extra 70 million kg of CO2 into the atmosphere, equating
     to 7,100 British homes
                                                               Williams (2016)
Turbulence
Aircraft encounter moderate turbulence (>0.5g) 65,000 times and severe
turbulence (>1.0g) 5,500 times annually in the USA. These encounters:
         – cause about 40 fatalities and 100s of serious injuries
         – cause structural damage to planes
         – cause flight diversions and delays     Statistics from:
         – cost airlines $150m–$500m              www.ral.ucar.edu/aap/themes/turbulence.php

                                                      Ralph et al. (1997)
Turbulence injury trends
             Number of serious injuries (including fatalities) caused by turbulence,
                          per million flight departures (US carriers)
FAA (2006)

             1982                                                              2003
Turbulence injury trends
                   Number of flight attendant injuries caused by turbulence,
                            per million hours flown (US carriers)
Tvaryanas (2003)
Clear-air turbulence (CAT)
• CAT occurs in clear skies at cruise altitudes, above weather
  systems like clouds and storms
• CAT is difficult to avoid, because it cannot be seen by pilots or
  detected by satellites or on-board radar
• Aircraft spend about 3% of their cruise time in light CAT (Watkins &
  Browning 1973) and about 1% of their cruise time in moderate CAT
  (Sharman et al. 2006)
• CAT is forecast operationally by computing various diagnostic
  measures from weather prediction models, e.g. those due to Colson
  & Panofsky (1965), Brown (1973), and Ellrod & Knapp (1992)
• World Area Forecast Centres (in London and Washington) use such
  diagnostics to issue global CAT forecasts every six hours (Gill 2012)
• These forecasts show significant skill when evaluated against pilot
  reports of turbulence

What causes CAT?

                                          Stratification
                                          inhibits CAT
height
                                          Wind shear
                                        encourages CAT

CAT occurs if the wind shear is stronger than the stratification.
     Climate change is strengthening the wind shear…
Is CAT increasing?
PRE-INDUSTRIAL DOUBLED CO2
2 2
u u v v u
TI1
z x y x y Is CAT increasing?
100%
Number of
turbulence
diagnostics
indicating
an
increased
median
0%
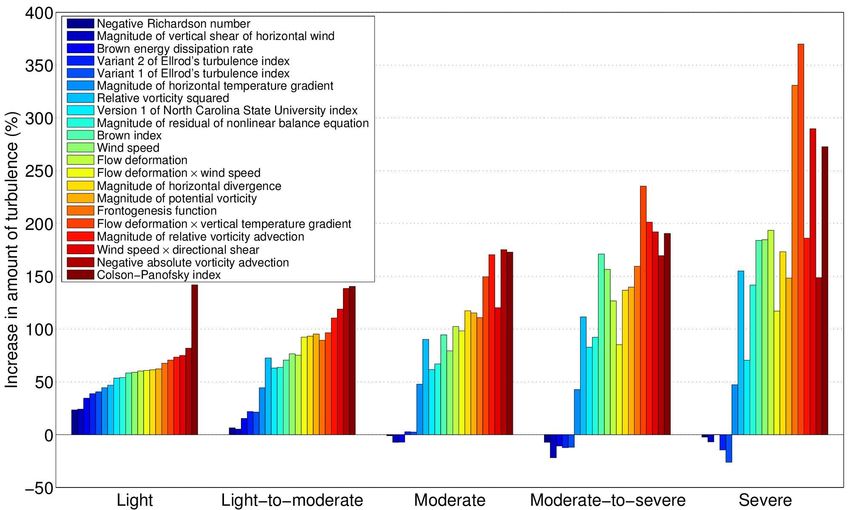
Williams & Joshi (2013)Williams (2017) 149%
(36-188%)
127%
(30-170%)
94%
(37-118%)
75%
59% (39-96%)
(43-68%)
“Slight strain against seat “Definite strain against “Occupants are forced
belts; unsecured objects may seat belts; unsecured violently against seat belts;
be displaced slightly; food objects are dislodged; unsecured objects are
service may be conducted food service and tossed about; food service
with little difficulty walking” walking are difficult” and walking are impossible”Is CAT increasing?
Storer, Williams & Joshi (2017)Is CAT increasing?
Storer, Williams & Joshi (2017)Summary • A basket of CAT measures diagnosed from climate simulations is significantly modified if the CO2 is increased • At cruising altitudes on transatlantic flights in winter, the diagnostics show a 59% / 94% / 149% increase in the prevalence of light/moderate/severe CAT, with similar results on other flight routes and in other seasons • We conclude that, all other things being equal, climate change will lead to bumpier flights later this century • Flight paths may become more convoluted to avoid stronger and more frequent patches of turbulence, in which case journey times will lengthen and jet fuel consumption will increase
Questions?

       @DrPaulDWilliams
www.met.reading.ac.uk/~williams
  p.d.williams@reading.ac.uk
You can also read