GLOBAL STOCKHOLM PROFILING THE CAPITAL REGION'S INTERNATIONAL COMPETITIVENESS AND CONNECTIONS
←
→
Page content transcription
If your browser does not render page correctly, please read the page content below

GLOBAL STOCKHOLM
P R O F I L I N G T H E C A P I TA L R E G I O N ’ S I N T E R N AT I O N A L
          COMPETITIVENESS AND CONNECTIONS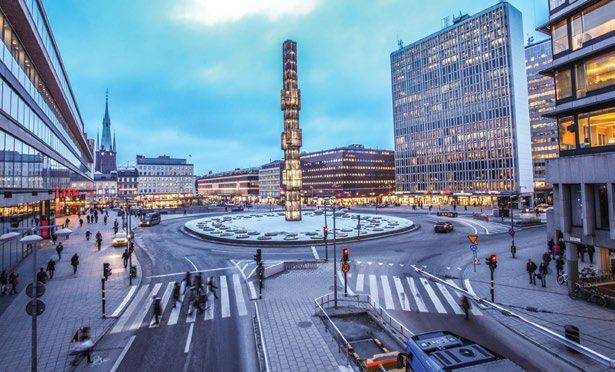

GLOBAL STOCKHOLM
P R O F I L I N G T H E C A P I TA L R E G I O N ’ S I N T E R N AT I O N A L
          COMPETITIVENESS AND CONNECTIONS

                                              BROOKI NGS :
    J OS E PH PA R I LLA , J ES U S LE A L T RUJI LLO, NI C K M A RC HI O, A ND CAT HA RI NE KHO

                            STO C K H OLM C HA M BER OF CO M M ERC E:
                                    A N DREAS HATZ I G EORG I O U

                THE BR O O K I NGS I NSTI T UT ION | ME TROPOL ITA N POL ICY PROGRA M | 2015
SUMMARY

                         T
                                          he Stockholm Capital Region operates from a position of global
                                          strength. The region’s focus on core economic assets—an educated and
                                          advanced workforce, highly innovative multinational companies and
                                          universities, and modern infrastructure—has positioned it as one of the
                         world’s most productive metropolitan economies. Yet Stockholm’s enviable position
                         is not guaranteed, especially as globalization, technological change, and demo-
                         graphic forces reset the international landscape. This report, developed as part of
                         the Global Cities Initiative, a joint project of Brookings and JPMorgan Chase, pro-
                         vides a framework for the Stockholm Capital Region to better understand its com-
                         petitive position in the global economy, offering information and insights to inform
                         regional leaders working to sustain the region’s prosperity. Its key findings are:

                         The Stockholm Capital Region is a wealthy and           and demographic trends, but to do so it must focus
                         productive economy that has generated rising            on the core drivers and enablers of competitive-
                         living standards for the majority of its popula-        ness. A competitive region is one in which firms can
                         tion. The Stockholm Capital Region, which includes      compete successfully in the global economy while
                         Stockholm and Uppsala counties and 2.5 million          supporting high and rising living standards for local
                         residents, accounts for just over one-quarter of        households. Globally competitive traded sectors,
                         Sweden’s population and generates over 30 percent       innovation ecosystems, and skilled labor are the key
                         of national economic output. On the core metrics of     drivers of overall productivity, employment creation,
                         economic health, the region has performed quite well.   and income growth. These drivers are supported by
                         Compared to Sweden and eight advanced regional          enablers: well-connected, spatially efficient infrastruc-
                         economies in Europe and the United States, the          ture and a reliable governance structure and business
                         Stockholm Capital Region outperformed on employ-        environment. The Stockholm Capital Region boasts
                         ment and output growth since 2000. These gains          notable strengths and significant opportunities to
                         have outpaced population and labor force growth,        better deploy these five factors to increase its global
                         indicating that the region’s high labor productivity    competitiveness.
                         is translating to rising living standards. That these
                         income gains are more evenly distributed across
                         Stockholm’s residents than in global peers indicates
                         that the region is not only growing, but that a wide
                                                                                 ■      TRADE: The Stockholm Capital Region’s
                                                                                        tradable sector, anchored by its advantages
                                                                                 in technology-intensive industries, is an important
                         swath of its population is benefiting. In a compos-     growth driver, but is limited by the low participa-
                         ite economic performance index, the capital region      tion of small and mid-sized firms in trade. The
     B R O O K I N GS    placed third among peers.                               traded sector accounts for 34 percent and 46 percent
M E T R O P O L I TA N                                                           of local jobs and output, respectively. Reflecting the
           POL I CY      The Stockholm Capital Region is well-positioned         region’s role as a major trading center, Stockholm
        P R O G RA M     to take advantage of changing market, technology,       accounted for 28.8 percent of Sweden’s exports,

                    2
42.5 percent of imports, and 35.6 percent of total         That only five companies account for 53 percent of
national goods trade. Three advanced manufactur-           patents indicates, however, that innovative activities
ing industries—electronics and equipment, chemicals,       need to be extended to smaller firms. Venture capital
and transportation equipment—generated over half           investment provides an avenue to boost small-firm
of regional goods exports. But the largest export cat-     innovation, and Stockholm has attracted $2.5 billion
egory was refined petroleum products, a dependence         since 2005, a sum that places it in the middle of its
that declining commodity prices could threaten. All of     peer group. In a composite innovation index, the capi-
these major export sectors tend to be dominated by         tal region placed fourth among peers.
large firms. Small and mid-sized companies account
for 95 percent of Stockholm’s firm base but only 26
percent of exports, suggesting the export pipeline
could be expanded. FDI inflows affirm the Capital
                                                           ■      TALENT: The region’s workforce is among
                                                                  the most educated in the world, but demo-
                                                           graphic shifts suggest looming talent shortages.
Region’s services strengths in communications, infor-      The Stockholm Capital Region benefits from an
mation technology, and finance. In a composite trade       incredibly well-educated labor pool. Of the 15 and
index, the capital region placed fifth among peers.        older population, 42 percent have obtained at least
                                                           a post-secondary education, second highest among

■      INNOVATION: Across several dimensions,
       the Stockholm Capital Region’s innovation
assets are strong, but it can take further steps
                                                           peer metro areas. Yet as the region ages, future
                                                           workforce shortages loom, threatening the competi-
                                                           tiveness of talent-driven industries. Foreign migration
to boost the innovative capacity of its smaller            could help address this coming shortfall if these new
firms. The region’s innovation ecosystem—its collec-       entrants are successfully, integrated, educated, and
tion of technical talent, firms, universities, research    employed. In a composite talent index, the capital
institutes, and industry intermediaries—outperforms        region placed fifth among peers.                          GLOBAL CITY

metropolitan peers on metrics of commercial inven-                                                                   PROFILE:

tions and university-industry scientific collaborations.                                                             STOCKHOLM

                                                                                                                     3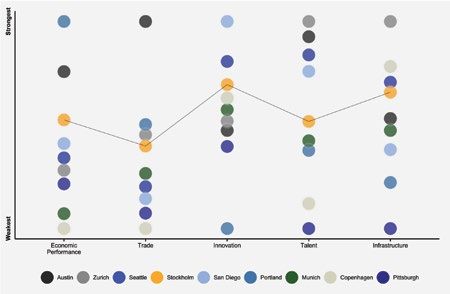
■      INFRASTRUCTURE: The Stockholm Capital
                                Region’s global infrastructure connec-
                         tions—including freight, aviation, and broadband
                                                                                      ■      GOVERNANCE: The region’s policy and
                                                                                             regulatory environment is quite conducive to
                                                                                      business success. Regional governance is strong in
                         systems—are world-class, but insufficient housing            the Stockholm Capital Region. While not to the same
                         supply is a challenge. Firms and workers benefit             degree as global peer cities, local governments have
                         from some of the best external infrastructure connec-        fiscal autonomy. Outside of government, there is an
                         tivity in the world. Sweden’s efficient freight and logis-   emerging network of private and civic institutions
                         tics systems offer cost-effective trade routes for local     working with their public sector colleagues to position
                         firms. Aviation passenger flows in the Capital Region        the Stockholm Capital Region globally. The policy
                         totaled 30 million in 2014, and have increased at the        environment is quite conducive to business, with taxes
                         second fastest clip among global peers since 2004.           and the legal and regulatory environment around
                         Broadband speeds are among the world’s fastest. Yet,         credit being the major issues for Stockholm firms.
                         the region’s housing and land use regime could be
                         improved. The built environment is not keeping pace          The Stockholm Capital Region has considerable com-
                         with the significant demand among households to live         petitive strengths. To better its future, the region can
                         in Stockholm, raising housing prices and limiting labor      bolster its position by bringing more firms into the
                         mobility. Rent reforms and denser housing develop-           export pipeline, expanding its innovation ecosystem
                         ment can help ease demand pressures. In a composite          to include more small and mid-sized firms, educating
                         infrastructure index, the capital region placed fourth       and integrating immigrants into the workforce, and
                         among peers.                                                 addressing the dysfunctional housing market. By tak-
                                                                                      ing purposeful action now, Stockholm’s public, private,
                                                                                      and civic institutions can sustain the region’s competi-
                                                                                      tiveness for generations to come.

                         Summary of the Stockholm Capital Region’s performance and competitiveness factors

     B R O O K I N GS

M E T R O P O L I TA N

           POL I CY

        P R O G RA M

                   4
I. INTRODUCTION
Cities around the world must adapt to a set of global forces that are redefining
what it takes to excel in today’s global economy.
First, globalization is intensifying. Revolutions in course, these same dynamics have created abundant
information technology and transportation, the rapid market opportunities for cities as well. For those
rise of emerging markets, the globalization of finance, places that can plug-in successfully to the global
and the advent of global value chains has intensi- cities network, the returns are high.8 Cities compete,
fied international exchange. Global flows of goods, to be sure, but winning the competition also requires
services, and capital have expanded rapidly over the collaboration through exchanges of goods, services,
last two decades, increasing from $5 trillion in 1990 to talent, capital, and ideas.
$26 trillion in 2012. 2
Political, business, and civic leaders across the world
Second, technology is altering how we communicate, have thus become increasingly focused on under-
how firms create products and services and deliver standing and enhancing their city-regions’ economic
them across the globe, and the very nature of work competitiveness and connections. To help inform
itself.3 The McKinsey Global Institute predicts that 12 their efforts, the Global Cities Initiative—a joint project
emerging technologies will generate an annual eco- of Brookings and JPMorgan Chase—will explore the
nomic impact of $33 trillion by 2025.4 Risks accom- competitiveness of six global city-regions through a
pany these breakthroughs; new technologies are two-year series of Global City Profiles. This research
placing 47 percent of U.S. occupations at risk of being draws on the Harvard Business School definition of a
automated by 2033. 5
competitive region as one in which firms can compete
successfully in the global economy while supporting
Third, urbanization and the world’s continued shift high and rising living standards for local households.9
from rural areas to cities is changing the geography
of growth and economic activity in emerging mar- This profile, the first of that series, draws upon a
kets, especially in Asia and Africa. The share of global unique dataset of globally comparable performance
population in metropolitan areas has grown from indicators to offer new insights about the economic
29 percent in 1950 to half in 2009, and is predicted to competitiveness) of the Stockholm Capital Region.
reach 60 percent by 2030. 6
It uses international benchmarking to explore the
overall economic performance of the region; its
Cities are on the frontlines of all of these shifts, comparative strengths and weaknesses on five key
creating both challenges and opportunities. As more competitiveness factors; and concludes with implica-
emerging markets have come online—connected by tions from this assessment, and key topics for the
technology and trade—the places where firms and city-region’s network of government, business, civic,
workers can locate have increased, generating new and community leaders to consider as it positions the
pressures on individual cities to provide a distinct Stockholm Capital Region on the global stage in the
value proposition to the market. This basic premise coming years.
is not necessarily new; for thousands of years cities
have competed to sell their products and services
outside of their own borders, using external demand
to expand local wealth and prosperity.7 But the com- GLOBAL CITY
petition has heightened considerably today, due to PROFILE:
the sheer number and size of cities in the network. Of STOCKHOLM
5Defining and measuring competitiveness through international benchmarking
C
ountless definitions of competitiveness exist. This research draws on the Harvard Business School
definition of a competitive market as one in which firms can compete successfully in the global
economy while supporting high and rising living standards for local households.10 Competitive
regions are, by this definition, supportive environments for both companies and people. Building on an
extensive literature review on regional economic development by researchers at George Washington
University, this research analyzes competitiveness through a five-factor framework—trade, innovation,
talent, infrastructure, and governance.11 Globally competitive traded sectors, innovation ecosystems, and
skilled labor are the key drivers of overall productivity, employment creation, and income growth—out-
comes that all metro areas care about. These drivers are supported by enablers: well-connected, spatially
efficient infrastructure and a reliable governance structure and business environment.12
This report utilizes a group of carefully selected metropolitan peers to understand competitiveness beyond
a national context.13 Stockholm’s peer cities were selected through a combination of principal components
analysis (PCA), k-means clustering, and agglomerative hierarchical clustering using 22 variables that mea-
sure economic size, wealth, productivity, industrial structure, and competitiveness.14 Eight cities from the
United States and Europe were selected because they most closely resemble the economic profile of the
Stockholm Capital Region based on this analysis. Table 1 compares the Stockholm Capital Region to its peer
metros on five of these variables. Similar to Stockholm, these metro economies are mid-sized economies
in terms of output and population and boast high average incomes and productive workforces, partly due
to their specializations in higher value-added manufacturing and services industries. Whenever possible,
the analysis employs comparable metrics of economic performance and the five competitiveness factors to
unveil areas of comparative strength and weakness.15
A framework for regional competitiveness
Infrastructure Trade
Enablers
Governance Innovation Talent
B R O O K I N GS
Source: Brookings Institution, RW Ventures, and McKinsey and Company.
M E T R O P O L I TA N
POL I CY
P R O G RA M
6Table 1. Key indicators for the Stockholm Capital Region and global peer metro areas
GDP per
Rank Population Nominal GDP Employment capita GDP per worker
1 Munich Seattle Munich Seattle Portland
2 Seattle Munich Seattle Portland Zurich
3 San Diego San Diego Copenhagen Zurich Seattle
4 Copenhagen Portland San Diego San Diego San Diego
5 Stockholm Stockholm Stockholm Stockholm Stockholm
6 Pittsburgh Copenhagen Zurich Munich Copenhagen
7 Portland Pittsburgh Pittsburgh Pittsburgh Austin
8 Austin Zurich Portland Austin Pittsburgh
9 Zurich Austin Austin Copenhagen Munich
Source: Brookings analysis of Oxford Economics data.
Defining the Stockholm Region
S
everal geographic definitions of the Stockholm regional economy exist. This study defines the
regional economy as Stockholm County and Uppsala County using the geographic boundar-
ies created by the European Observation Network for Territorial Development and Cohesion
(ESPON). We use this definition because it is based on commuting flows of workers (i.e., the regional
labor market), which provides the best estimate of the true economic geography of the region. Mentions
of the “Stockholm region,” “Stockholm metro area,” “Stockholm Capital Region,” “Capital Region,” and
“Stockholm” refer to this two-county geography. This definition differs slightly from several other ways of
describing the Stockholm
region. The OECD uses Stockholm Capital Region
Stockholm County in its accounts for...
regional database, and at 25% of national population
times in this analysis we uti-
lize that definition to draw 30% of national GDP
on OECD data not avail-
able at other geographies.
A third classification uses Uppsala County
the five-county Stockholm-
Mälar Region to define Västmanland County
Stockholm
the regional economy, County
adding the counties of
Södermanland, Örebro, and
Örebro County
Västmanland. Lack of data
prevented us from using this Södermanland County
definition.
Stockholm Capital Region GLOBAL CITY
Stockholm-Mälar Region (all five counties)
PROFILE:
STOCKHOLM
7I I . T H E S TAT E O F T H E C A P I TA L R E G I O N ’ S E C O N O M Y
D
efined as Stockholm County and Uppsala County, the Capital Region
houses 2.5 million residents, just over one-quarter of Sweden’s popu-
lation, and generates over 30 percent of national economic output.16
A review of top-line trends confirms that the Stockholm regional
economy has succeeded in generating economic growth that has raised living stan-
dards for much of its population.
Output and employment in the Stockholm Capital Stockholm region averaged 2.9 percent annually
Region have grown more quickly than in most between 2000 and 2014, higher than in all peer cit-
global peer cities and in Sweden as a whole. The ies except Austin and Portland. Employment growth
rate of change in the size of the regional economy averaged 1.1 percent per year since 2000, placing the
can indicate the pace of its progress toward expand- region in the top third of global peers. Both growth
ing economic opportunity. Real GDP growth in the rates outpace national averages.
Figures 1a and 1b. Real output growth (CAGR and index), 2000–2014
150
Portland 4.5% Stockholm
Austin 4.1%
140
Stockholm 2.9%
Zurich 2.1% 130
Seattle 2.1% Sweden
San Diego 2.0% 120
Munich 1.5%
110
Pittsburgh 1.3%
Copenhagen 1.3% 100
2000 2002 2004 2006 2008 2010 2012 2014
Source: Brookings analysis of Oxford Economics data. CAGR = compound annual growth rate.
Figures 2a and 2b. Employment growth (CAGR and index), 2000–2014
120
Austin 2.1%
Zurich 1.7% 116
Stockholm
Stockholm 1.1%
Munich 1.0% 112
Seattle 0.7%
108
San Diego 0.7% Sweden
B R O O K I N GS
Portland 0.7% 104
M E T R O P O L I TA N
Copenhagen 0.5%
POL I CY
0.1% 100
Pittsburgh 2000 2002 2004 2006 2008 2010 2012 2014
P R O G RA M
Source: Brookings analysis of Oxford Economics data. CAGR = compound annual growth rate.
8Strong productivity gains have increased stan- Productivity—measured here as output per worker—
dards of living in the Stockholm Capital Region, captures the ability of firms and workers to transform
although productivity growth has slowed since the factors of production into more valuable products
2010. To create lasting prosperity, economic growth and services. Since 2000, Stockholm’s 2.9 percent
must keep pace with population and labor force annual productivity growth has outpaced every global
growth so average standards of living rise. Annual peer city except for Austin and Portland. However,
GDP per capita growth, a common metric of standard after tremendously fast growth in the 2000s, annual
of living, in the Stockholm region has averaged 1.7 productivity growth has slowed to 1.2 percent since
percent since 2000, faster than all of its peer metro 2010, suggesting that new efforts and investments in
economies except Portland.17 Standards of living competitiveness must be made to sustain these gains
increased as a result of strong productivity growth. into the future.
Figures 3a and 3b. Real GDP per capita growth (CAGR and index), 2000-2014
Portland 3.1%
130
Stockholm 1.7%
Stockholm
Pittsburgh 1.5%
San Diego 1.0% 120
Austin 0.9%
Sweden
Zurich 0.9%
Seattle 0.8% 110
Munich 0.7%
Copenhagen 0.6%
100
2000 2002 2004 2006 2008 2010 2012 2014
Source: Brookings analysis of Oxford Economics data. CAGR = compound annual growth rate.
Figure 4a and 4b. Growth of output per worker, CAGR and index, 2000-2014
Portland 3.8%
130 Stockholm
Austin 1.9%
Stockholm 1.8%
Seattle 1.4% 120
San Diego 1.3% Sweden
Pittsburgh 1.2%
Copenhagen 0.7% 110
Munich 0.6%
Zurich 0.4%
100
2000 2002 2004 2006 2008 2010 2012 2014
Source: Brookings analysis of Oxford Economics data. CAGR = compound annual growth rate.
GLOBAL CITY
PROFILE:
STOCKHOLM
9Income gains are more broadly shared in which defines inequality on a scale from zero (perfect
Stockholm County than in peer regions. To sustain equality) to one (perfect inequality). Inequality met-
competitiveness and social cohesion, the gains from rics are not available for the broader Capital Region,
growth must be broadly shared. While the global eco- but the OECD reports that Stockholm County reg-
nomic trends that contribute to income inequality are istered a Gini of 0.30 in 2010, higher than Sweden’s
beyond the control of any individual city, understand- Gini (0.27) but lower than in all peers except Bavaria
ing how income gains are distributed within a regional (Munich) and Copenhagen.18 This suggests that the
economy can reveal who among the population is growth that Stockholm generates is more evenly dis-
benefitting from local growth. One common way to tributed in the population relative to global peers.
measure income inequality is the Gini coefficient,
Figure 5. Gini income inequality index, 2010*
Bavaria (Munich) 0.28 Less Unequal
Copenhagen 0.28
Stockholm 0.30
Zurich 0.32
Oregon (Portland) 0.35
Pennsylvania (Pittsburgh) 0.37
Washington (Seattle) 0.38
California (San Diego) 0.41
Texas (Austin) 0.42 More Unequal
Source: Brookings analysis of OECD data.
➤ BOTTOM LINE: By almost any metric, the Stockholm Capital Region’s economy is healthy. But in
a fiercely competitive world, no region can afford to ignore investments in the fundamental drivers of com-
petitiveness and prosperity, especially given that, since 2010, productivity has not grown as quickly as in the
2000s. To maintain its enviable position, the region’s networks of public, private, and civic leaders must commit
to further investments that position its economy for global success.
B R O O K I N GS
M E T R O P O L I TA N
POL I CY
P R O G RA M
10III. COMPETIVENESS DRIVERS AND ENABLERS
A. TRADE by traded sector growth, trade in goods and services,
and by foreign direct investment—is both an important
WHY IT MATTERS: Trade is a critical driver signpost and a critical driver of competitiveness.
of competitiveness and prosperity. Firms sell-
ing internationally inject new wealth from abroad A1. TRADED SECTOR STRUCTURE
that, when spent locally, creates a “multiplier effect” AND GROWTH
in the regional economy, spurring new jobs, growth,
and further tax revenue.19 Participating in global trade The Stockholm Capital Region’s traded sectors
also makes metro areas more productive and innova- represent one-third of total employment and over
tive. Firms that generate revenue from outside their 46 percent of total output.21 For all the reasons
home market must provide goods and services faster, mentioned above, the health of the traded sector is
better, and cheaper than global competitors. Local an important indicator of overall competitiveness.22
companies that embed themselves in global value The share of regional output generated by tradable
chains gain access to high-quality inputs, lower overall industries in Stockholm is higher than all metropolitan
costs, and as a result become more globally competi- peers except for Portland and Zurich. Professional
tive. This process tends to boost productivity and services (i.e., legal, accounting, and IT services)
wages. Therefore, the traded economy—as measured
20
accounted for the largest share of traded sector
Table 2. Stockholm Capital Region’s industrial structure, 2014
Sector Share of jobs Share of output
Tradable 34% 46%
Professional, scientific & technical activities 9% 8%
Manufacturing 7% 16%
Information & communication 7% 9%
Transportation & storage 6% 4%
Financial & insurance activities 5% 9%
Agriculture, forestry & fishing 1% 0%
Mining & Quarrying 0% 0%
Non-Tradable 67% 54%
Wholesale & retail trade 13% 12%
Human health and social work 13% 9%
Education 9% 5%
Administrative & support activities 8% 4%
Construction 7% 5%
Public administration & defense 6% 5%
Accommodation & food services 5% 2%
Real estate activities 2% 9% GLOBAL CITY
Other services 2% 1% PROFILE:
Arts, entertainment & recreation 1% 1% STOCKHOLM
Electricity, gas & water supply 1% 2%
11
Source: Brookings analysis of Oxford Economics data.Figure 6. Share of traded sector in Figure 7. Traded sector output growth, CAGR,
total output, 2014 2000-2014
Portland 54% Portland 7.6%
Zurich 50% Austin 5.4%
Stockholm 46% Stockholm 3.6%
Seattle 46% San Diego 2.9%
Munich 45% Seattle 2.9%
Pittsburgh 42% Pittsburgh 2.3%
Copenhagen 42% Copenhagen 2.2%
Austin 38% Munich 2.1%
San Diego 34% Zurich 2.0%
Source: Brookings analysis of Oxford Source: Brookings analysis of Oxford Economics data.
Economics data. CAGR = compound annual growth rate.
employment in 2014, followed by manufacturing, employment and output, including significant con-
information and communication, transportation and centrations in health, education, and public services,
storage, and finance and insurance. Manufacturing reflecting Stockholm’s role as Sweden’s political and
generated the largest share of total output (16 per- education center. Tradable industries’ technology
cent), followed by information and communication and capital-intensive structure and high productivity
and finance and insurance. The non-tradable portion help explain their larger share of regional output
of the economy continues to absorb the majority of (46 percent) than employment (34 percent).
“Participating in global trade makes metro areas more
productive and innovative. Local companies that embed
themselves in global value chains gain access to high-
quality inputs, lower overall costs, and as a result
become more globally competitive. This process tends
to boost productivity and wages.”
B R O O K I N GS
M E T R O P O L I TA N
POL I CY
P R O G RA M
12Output has expanded in all of the Stockholm traded sectors except for professional, scientific, and
Capital Region’s traded sectors since 2000, but technical services. The region’s manufacturing output
employment has contracted in manufacturing and expanded at triple the national rate. Yet manufac-
transportation. Overall, output in the Stockholm turing lost jobs during this period, similar to many
Capital Region’s traded sector has grown 3.6 percent advanced city-regions where labor-saving automa-
per year since 2000, faster than all peer regions tion has rapidly expanded productivity in the sec-
except Portland and Austin. Compared to national tor. Employment growth was largest in professional
trends, output grew faster in all of Stockholm’s major services and finance and insurance.
Figure 8. Output growth in traded sectors, 2000-2014
100%
93%
81%
63%
55%
49% 46%
26%
9% 7%
Manufacturing Transportation & Information & Finance & Professional
Storage Communication Insurance Services
■ Stockholm ■ Sweden
Source: Brookings analysis of Oxford Economics data.
Figure 9. Employment growth in traded sectors, 2000-2014
42%
34%
18%
8% 7% 8%
-1%
-7%
-21% -10%
Manufacturing Transportation & Information & Finance & Professional
Storage Communication Insurance Services
■ Stockholm ■ Sweden
GLOBAL CITY
Source: Brookings analysis of Oxford Economics data.
PROFILE:
STOCKHOLM
13A2. GOODS TRADE populations and tend to focus on higher-value added
services (sidebar 3).23 Even without services incorpo-
The Stockholm Capital Region is a major driver rated, the Stockholm Capital Region is a major driver
of national trade. Sweden registered a goods trade of national trade and national trade growth. In 2014,
surplus amounting to 1.9 percent of GDP in 2010–2013, Stockholm accounted for 28.8 percent of Sweden’s
while the Stockholm Capital Region’s trade deficit was exports, 42.5 percent of imports, and 35.6 percent of
9 percent of GDP in the same period. Goods trade def- total national trade. From 2004 to 2014, the region
icits are common in major metropolitan areas, which contributed an average of 27 percent and 37 percent
import consumables and raw goods to fuel their large of export and import growth, respectively.
Figure 10. Merchandise trade, Stockholm Capital Region, SEK billion
500,000 Imports
375,000
Exports
250,000
125,000
0
Net exports
-125,000
-250,000
2004 2005 2006 2007 2008 2009 2010 2011 2012 2013 2014
Source: Brookings analysis of Statistics Sweden data.
Figure 11. Stockholm Capital Region’s share of contribution to Sweden’s trade growth, 2004-2014
70
60
Total trade
50
40
30
20
10
0
2004 2005 2006 2007 2008 2009 2010 2011 2012 2013
■ Export ■ Import
Source: Brookings analysis of Statistics Sweden data.
B R O O K I N GS
M E T R O P O L I TA N
POL I CY
P R O G RA M
14Stockholm has a well-diversified goods trade base shift was mainly supported by the expansion of
that predominantly relies on destination mar- Stockholm’s role in petroleum storage as well as ele-
kets in the European Union. The Stockholm Capital vated commodity prices.24 At the same time, the share
Region’s top ten export markets account for an aver- of gross regional exports in electronics has declined
age of 57 percent of total exports in the last decade, from 37.7 percent in 2004 to 20.4 percent in 2014.
below the national average of 65 percent. More than Major import products are electronics and electrical
half of regional exports are bound for Europe. In goods (23 percent of gross imports), crude petroleum
terms of products, Stockholm’s exports are domi- (19 percent), and chemicals and chemicals products
nated by manufactured goods (74 percent of gross (12 percent). Stockholm’s import sources are relatively
exports in 2014), particularly electronics and chemi- balanced; the top 10 import sources accounted for
cals. Export of refined petroleum products has seen a 51 percent of total imports in 2014, compared to the
marked increase in recent years, doubling from national average of 70 percent.
11.4 percent in 2004 to 23.4 percent in 2014. This
Figure 12. Share of gross exports by products in Stockholm Capital Region
2% 3%
4% 6%
9% 8%
12%
■ Others
16%
■ Consumer Goods
■ Transport Equipment
38% 20%
■ Other Manufactured Products
■ Electrical and Electronic Products
23%
■ Chemicals And Chemical Products
24%
23%
■ Refined Petroleum Products
11%
2004 2014
Source: Brookings analysis of Statistics Sweden data.
Figure 13. Share of gross imports by products in Stockholm Capital Region
3% 3%
7% 8%
11% 11% ■ Others
14% 12% ■ Refined Petroleum Products
9% 13% ■ Transport Equipment
13% 12% ■ Chemicals And Chemical Products
15% ■ Consumer Goods
19%
■ Other Manufactured Products
28% 22%
■ Mining
■ Electrical and Electronic Products
2004 2014
GLOBAL CITY
Source: Brookings analysis of Statistics Sweden data.
PROFILE:
STOCKHOLM
15Sweden’s service exports: Stockholm’s comparative advantage?
S
weden has been a net services exporter since 2002,
due largely to rapidly rising trade in computer and IT Table 3. Advanced services connectivity, 2012
services and music royalties and fees. Data measur- Global rank Metro area
ing services exports do not exist at the sub-national level,
26 Zurich
but an examination of national services exports trends can
40 Stockholm
lend insights into Stockholm, given that the region contains
38 percent of national services output and ranks 40th out of 43 Munich
525 urban areas in terms of its centrality in global networks of 56 Copenhagen
“advanced producer services” firms in accounting, advertising, 99 Seattle
financial services, law, and management consulting, second
112 San Diego
most connected among its peer cities after Zurich (Table 3).25
173 Portland
In 2013, Sweden had net services exports of $17.7 billion, up 188 Pittsburgh
from a $1.8 billion services deficit in 1996, largely due to the 191 Austin
rapid rise in the export of intellectual property through com- Source: Brookings analysis of data from the Globalization
puter and IT services and royalties and fees (labeled “other and World Cities (GaWC) Research Network.
services”). The sharp
increase in computer and Figure 14. Net services exports in Sweden, USD billion at current prices
IT services reflect Sweden’s
large and internationally 50,000 ■ Other services*
■ Travel
competitive pool of software 37,500 ■ Transport
■ Total services
and gaming companies,
25,000
and the rising demand for
12,500
these services as they have
become more internation- 0
ally tradable over the past -12,500
decade. At the same time,
26
1996 1998 2000 2002 2004 2006 2008 2010 2012
the growth in receipts for *Includes exports and imports for professional services, computer and information services, and royalties and fees.
royalties and fees partly
Source: Brookings analysis of Statistics Sweden data.
reflects continued Swedish
success in the global music
and gaming industries.27 The Stockholm Capital Region is the major hub for both sets of services, account-
ing for 46 percent and 50 percent of national output in professional, scientific, and technical services and
arts, entertainment, and recreation, respectively.28
Travel and tourism is another important sector for Stockholm. The travel industry has decelerated since
the global financial crisis, with tourism receipts increasingly lagging behind tourism outflows. Tourists
to Sweden are mainly headed for Stockholm, and primarily hail from Germany, the United Kingdom, the
United States and Norway. Between 2005 and 2010, Stockholm’s tourism industry boomed, registering
the highest growth among European cities in terms of the number of overnight stays and above-average
increase in bed capacity and revenue per available room.29 However, visitors to Stockholm reduced their
B R O O K I N GS duration of stay significantly in the aftermath of the global financial crisis.30 The reduction in duration
M E T R O P O L I TA N of stay was mainly attributable to tourists from the United Kingdom, Italy, and Spain, countries directly
POL I CY affected by the heightened uncertainty and weak economic recovery in the European Union during this
P R O G RA M period. Going forward, travel and tourism remains an important traded sector for Stockholm that can be
bolstered for effective global brand cultivation and enhanced international connectivity.31
16Small and medium-sized enterprises (SMEs)
account for 95 percent of companies in Stockholm,
but only contribute 26 percent of exports.32 While
SMEs dominate the firm base in the Capital Region,
they are underrepresented in their share of exports,
although export revenues per SME have been increas-
ing over time. Building the pipeline of SME export-
ers can be a significant growth spur for the region.
Internationalized SMEs have been found to be three
times more innovative and experience two times
faster employment creation than SMEs that are not
engaged in trade.33
Figure 15. Share of Stockholm Capital Region exports by firm size
78% 76% 76% 72% 77% 73% 76% 75% 74% 76% 74%
22% 24% 24% 28% 23% 27% 24% 25% 26% 24% 26%
2004 2005 2006 2007 2008 2009 2010 2011 2012 2013 2014
■ SMEs ■ Large firms
Source: Brookings analysis of Statistics Sweden data.
Figure 16. Average export revenue per SME in
Stockholm Capital Region, SEK billion
10.6
“Internationalized SMEs
8.8 are three times more
innovative and experience
two times faster employment
growth than SMEs that
are not engaged in trade.”
2004–2008 2010–2014
GLOBAL CITY
Source: Brookings analysis of Statistics Sweden data.
PROFILE:
STOCKHOLM
17A3. FOREIGN DIRECT INVESTMENT environment vis-à-vis other global regions.34
Stockholm ranked fourth among global peers in terms
The Stockholm Capital Region has attracted of total FDI inflows between 2009 and 2014. These
$4.3 billion in new greenfield foreign direct invest- investments created 8,200 new jobs, fifth among
ment since 2009, which translated into 8,200 global peer cities, which represented 7.0 percent of
new jobs, placing it in the middle of its peer group. total new employment generated during that period.35
Greenfield investments—the process by which compa- Copenhagen’s notably high share of FDI-generated
nies open a new establishment in a foreign market— employment stems from its very low overall job cre-
help reveal the extent to which multinational firms ation rate during this period.
find the Stockholm region an attractive operational
Table 4. Greenfield FDI flows, jobs, and share of net new employment, 2010-2014
Total FDI flows Share of net new
Metro area (USD million) Total FDI jobs employment
Austin 10,161 10,007 6.8%
Zurich 4,800 8,280 9.3%
Munich 4,316 12,719 6.9%
Stockholm 4,257 8,156 7.0%
Copenhagen 4,110 9,375 35.6%
San Diego 2,039 4,931 5.4%
Portland 1,886 5,509 5.7%
Seattle 1,294 5,305 3.5%
Pittsburgh 437 1,443 3.7%
Source: Brookings analysis of fDi Intelligence data.
Stockholm’s foreign direct investment concen-
Table 5. Greenfield FDI by industry
trates in a group of technology-intensive indus-
Industry Total FDI (USD million)
tries. Between 2009 and 2014, 51 percent of new FDI
occurred among firms in R&D and STEM-intensive
Financial Services 812.5
advanced industries, led by communications and Communications 757.0
software and information technology. The steady 693.5
36
Software & IT services
influx of resources has allowed Sweden to consolidate Real Estate 393.0
itself as a top destination for technology investment.
Textiles 334.8
Yet, Stockholm faces stiff competition from peer cities
that are also attracting large investments in advanced
Consumer Products 255.2
industries. In fact, as compared to global peers, its Business Services 214.1
share of FDI in advanced industries trails places like Transportation 201.6
Austin, Zurich, and Seattle. Pharmaceuticals 170.3
Biotechnology 62.5
B R O O K I N GS
M E T R O P O L I TA N Source: Brookings analysis of fDi Intelligence data.
POL I CY
P R O G RA M
18Europe and the United States Figure 17. Share of total FDI in tech-intensive sectors,
accounted for 87 percent of 2010-2014
all greenfield FDI flows into
the Stockholm Capital Region
Austin 97%
between 2009 and 2014. With
Seattle 67%
$1.0 billion in total investment
Pittsburgh 62%
between 2009 and 2014, the
Portland 56%
United States accounted for
Munich 55%
approximately one-third of total
San Diego 55%
FDI into Stockholm, led by major
Stockholm 51%
investments in the region’s IT
Zurich 46%
and software cluster.37 Four major
Copenhagen-Malmö 17%
European countries—the United
Kingdom, Germany, France, and
the Netherlands—accounted for
another one-third of investment Source: Brookings analysis of Statistics Sweden data.
into Stockholm.
Greenfield foreign direct investment, Stockholm Capital Region, USD billions, 2009-2014
STK
1.3bn
North
!
( 2.6bn
America !
( !
Europe(
.4bn
!
( Asia
0bn !
( Africa
0bn Oceania
!
( .02bn
South America !
(
Source: Brookings analysis of fDi Intelligence data.
Source: Brookings analysis of fDi Intelligence data.
➤ BOTTOM LINE: Stockholm’s traded sector is diversified and composed of high-value products and
services, and the region has attracted new foreign investments into these productive sectors of the economy.
However, declining commodity prices could expose the region’s growing reliance on refined petroleum exports
and the participation of SMEs in international trade remains low. FDI inflows reveal the Capital Region’s com-
parative advantages in technology-intensive sectors, but come from a relatively small set of markets in Europe
and the United States. Stockholm could improve its trade position by bolstering trade flows in sectors where it
enjoys strong competitive advantages, such as software and biotech, while promoting more participation from
small and medium-sized firms. FDI attraction efforts focused beyond the United States and Europe could help
diversify regional sources.
GLOBAL CITY
PROFILE:
STOCKHOLM
19B . I N N O VAT I O N of new products, processes, and technologies.40
Compared to the rest of the world, firms, universi-
WHY IT MATTERS: A region’s innovative ties, and government in Sweden and Stockholm
capacity and levels of entrepreneurship both invest significantly in R&D as a share of the overall
have implications for its ability to develop and deploy economy. R&D expenditure stands at 3.8 percent of
commercial applications, start new businesses, and GDP in the Stockholm region, higher than the national
maintain industrial competitiveness in the face of average of 3.4 percent. However, the region has not
disruptive technological change.38 Innovation takes returned to pre-crisis R&D expenditure levels, when
many forms and can be hard to measure, especially Stockholm spent 4.3 percent of GDP in R&D.41 Even
innovations that improve processes, management with these declines, Stockholm County is more R&D-
techniques, or occur in the informal economy. Yet, intensive than all peers except California (San Diego),
the most productive and technologically-advanced Copenhagen, and Washington (Seattle).42
metropolitan economies in the world tend to com-
bine a common set of institutions and assets into A strong network of research universities sup-
a rich collaborative innovation ecosystem that can port R&D and drive innovation in the Stockholm
commercialize research and development into new Capital Region. Research universities play a major
products and services for the market. In the case of
39
role in driving innovation by providing basic research
Stockholm innovation has been a centerpiece of its that underlies scientific discovery and understand-
economic growth and development strategy for much ing, facilitating the translation of research results into
of the past century. consumable goods and services, and attracting and
supporting the growth of other research-intensive
Stockholm County accounts for one-third of industries.43 To measure the scientific impact of
Sweden’s research and development expenditures, universities, the Centre for Science and Technology
but R&D expenditures as a share of GDP has been Studies (CWTS) and Leiden University have compiled
declining over time. Research and development metrics for 750 major universities worldwide. Five
(R&D) is an important measure of the resources universities in the Capital Region (Karolinska Institute,
invested in the discovery and commercialization KTH Royal Institute of Technology, Stockholm
Figure 18. Share of total publications in top Figure 19. Mean citation score for all fields,
10 percent most cited papers in all fields, 2010-2013
2010-2013
San Diego 19.9% Seattle 11.6
Seattle 19.5% Zurich 9.8
Austin 16.5% Austin 9.7
Zurich 16.5% San Diego 9.6
Pittsburgh 16.2% Pittsburgh 9.6
Munich 16.1% Munich 9.5
Stockholm 15.8% Copenhagen 8.5
Copenhagen 15.2% Stockholm 8.2
B R O O K I N GS
Source: Brookings analysis of Centre for Science and Source: Brookings analysis of Centre for Science and
M E T R O P O L I TA N
Technology Studies (CWTS) and Leiden University data. Technology Studies (CWTS) and Leiden University data.
POL I CY
P R O G RA M
20Figure 20. Share of total publications done with Figure 21. Share of total publications done in
industry, 2010-2013 collaboration with industry (biomedical and
health sciences), 2010-2013
CopenhagenWork 8.8% Copenhagen 10.4%
San Diego 8.1% Stockholm 9.2%
Stockholm 7.9% Munich 8.2%
Austin 7.2% San Diego 8.2%
Seattle 7.2% Zurich 7.6%
Munich 6.8% Seattle 7.1%
Pittsburgh 6.4% Pittsburgh 6.3%
Zurich 6.4% Austin 4.5%
Source: Brookings analysis of Centre for Science and Source: Brookings analysis of Centre for Science and
Technology Studies (CWTS) and Leiden University data. Technology Studies (CWTS) and Leiden University data.
University, Swedish University of Agricultural and strong public-private collaboration on R&D.48 In
Sciences, and Uppsala University) are ranked within the 2008 to 2012 period, Stockholm produced 2.6 pat-
the top 750 research universities, more than any ents per thousand inhabitants, a 31 percent increase
of Stockholm’s peer regions. Notwithstanding the
44
from the 2003-2007 period. At the same time,
acknowledged high academic quality of the Stockholm Stockholm’s share of national patents increased from
Capital Region’s universities, compared to global 37 percent to 43 percent during that same period.
peers a relatively low share of the regional system’s The region’s invention rate ranked second among
total scientific publications fall in the 10 percent of global peers, after San Diego, and ahead of other
most highly cited papers.45 Importantly, however, global innovation hubs such as Seattle, Copenhagen,
Stockholm’s universities collaborate well with industry and Munich.
partners, a key element for the successful transla-
tion of knowledge into new ventures.46 Between 2010
and 2013, the five universities in Stockholm produced
7.9 percent of scientific papers in collaboration with Figure 22. Patents per 1,000 inhabitants,
2008-2012
industry partners, much higher than the global metro
average of 5.2 percent. When compared to similar
peers, Stockholm ranks third in industry collaboration, San Diego 5.2
and second when examining key regional sectors such Stockholm 2.6
as biomedical and health sciences. Seattle 2.1
Copenhagen 2.1
The Stockholm Capital Region concentrates Munich 1.9
43 percent of Sweden’s overall patenting activity Portland 1.6
and 44 percent of all technology-related patents. Zurich 1.5
Patents provide a reliable and comparable, if imper- Austin 1.3
fect, measure of new inventions that spur economic Pittsburgh 0.8
development.47 The Stockholm region has been able GLOBAL CITY
to increase its patenting output thanks to a healthy PROFILE:
Source: Brookings analysis of OECD REGPAT data.
innovation ecosystem, a well-educated labor force, STOCKHOLM
21Table 6. Top inventors by firm, 2008-2012
Patents Share of total
Firm Industry invented patents
Ericsson Digital communication 2,339 38.9%
Scania Cv Ab Motor vehicles 490 8.1%
Ge Healtcare Bio Sciences Ab Measurement 143 2.4%
Huawei Co Ltd Digital communication 90 1.5%
Delaval Ab Other special machines 102 1.7%
Source: Brookings analysis of OECD REGPAT data.
Patenting activity concentrates in technology- Stockholm is one of the most successful entre-
intensive clusters where Stockholm enjoys com- preneurial environments in Europe, receiving $2.5
parative advantages. Three-quarters of inventions billion in venture capital investments since 2005.
between 2008 and 2012 concentrated in just three Venture capital (VC) provides funds for innova-
industries: information technology (49 percent), life tive enterprises positioned for high growth and the
sciences (14 percent), and advanced manufacturing potential to create and capture entire new markets.49
(13 percent). Within these sectors, digital commu- Firms that receive venture capital can be particu-
nication, telecommunications, medical technology, larly important stimulants to regional economies;
and computer technology accounted for almost half VC recipients are three to four times more patent-
of all patenting activity. Large firms dominate the intensive than other firms, and are much more likely
innovation ecosystem in Stockholm. Between 2008 to translate their R&D activities into high-growth
and 2012, only five companies generated 53 percent ventures.50 Stockholm’s concentration of IT firms as
of all patents, and one company, Ericsson, produced well as the highly educated labor force has propelled
39 percent of all patents. Regional peers with major, it to be one of the most internationalized venture
research-intensive multinational firms experience capital markets in Europe.51 Compared to other metro
a similar pattern; Boeing produces 45 percent of peers, Stockholm ranks first in share of venture capi-
Seattle’s patents while Intel accounted for 44 percent tal funds from international investors, with 75 percent
of all patents in Portland. of the total. Yet, it still trails U.S. cities such as San
Diego, Austin, and Seattle in terms of total venture
capital received, indicating further efforts to bolster
Figure 23. Share of patents generated by five
entrepreneurship and cultivate domestic sources of
largest inventors, 2008-2012
venture capital are needed.52 Five industries account
Portland 63.0% for almost three quarters of all venture capital invest-
San Diego 59.2% ments into Stockholm: software (36 percent), other
Seattle 56.4% financial services (13 percent), pharmaceuticals and
Stockholm 52.6% biotechnology (12 percent), communications and net-
Pittsburgh 32.7% working (6 percent), and semiconductors (6 percent).
Munich 25.6% The rise of Stockholm’s software cluster has dramati-
Copenhagen 25.6% cally reshaped its venture capital structure. In 2005,
Austin 21.4% less than 3 percent of venture capital into the region
Zurich 19.3% was allocated to software companies while more than
B R O O K I N GS a third of all venture capital funds in Stockholm went
M E T R O P O L I TA N to software firms in 2014.
Source: Brookings analysis of OECD REGPAT data.
POL I CY
P R O G RA M
22Figure 24. Total venture capital investments,
USD millions per 1,000 inhabitants, 2005-2014
San Diego $4.3
Austin $3.9
Seattle $3.2
Stockholm $1.0
Portland $0.9
Pittsburgh $0.8
Copenhagen $0.7
Zurich $0.5
Munich $0.4
Source: Brookings analysis of Pitchbook data.
Figure 25. Share of venture capital investment by source, 2005-2014
31% 27% 27%
36% 35%
54%
63% 60%
75%
69% 73% 73%
64% 65%
46%
37%
25% 40%
Stockholm Zurich Copenhagen Munich Portland San Diego Pittsburgh Austin Seattle
■ Domestic ■ International
Source: Brookings analysis of Pitchbook data.
Figure 26. Stock of venture capital in Stockholm Capital Region, by industry, 2008 and 2014
35.8%
20.2%
17.2%
13.4% 12.1% 13.7%
11.7%
6.1% 6.0%
1.2%
Software Other Financial Pharma and Comms and Semiconductors
Services Biotechnology Networking
GLOBAL CITY
■ 2008 ■ 2014
PROFILE:
Source: Brookings analysis of Pitchbook data.
STOCKHOLM
23International venture capital investment, Stockholm Capital Region, USD millions, 2005-2014
845m STK
North
!
( 9.7m
America !
( !
(
Europe
783m
!
( Asia
!
( Africa 0.3m
0m
South America !
(
0m !
(
Oceania
Source: Brookings analysis of Pitchbook data.
Source: Brookings analysis of Pitchbook data.
➤ BOTTOM LINE: Across several dimensions, the Stockholm Capital Region’s innovation assets are
strong. Rates of new commercial inventions are high. Universities collaborate well with firms on joint research
and development. Venture capital markets find the region’s firms attractive investments. Yet challenges still
remain: investment in R&D as share of GDP has been steadily declining, patenting activity is dominated by
a small number of large firms, and venture capital still lags several U.S. cities, due in part to the nascence
of Sweden’s local venture capital scene. Stockholm is well-positioned, but must maintain investments in its
world-class research institutions and its burgeoning venture capital markets to keep its edge in key advanced
industries.
C . TA L E N T advantages mentioned above. According to the OECD,
about one-third of employees with tertiary educa-
WHY IT MATTERS: Human capital, the stock tion in Stockholm County are trained in a science and
of knowledge, skills, expertise, and capacities technology field, placing it in the top 10 percent of
embedded in the labor force, is of critical importance European regions.56
to enhancing productivity, raising incomes, and driv-
ing economic growth.53 Producing, attracting, and
retaining educated workers; creating jobs for those Figure 27. Share of population above 15 years
workers; and connecting those workers to employ- old with tertiary education, 2013
ment through efficient labor markets all matter for
Seattle 43.6%
regional competitiveness and ensuring broad-based
Stockholm 42.0%
economic opportunity.54
Zurich 42.0%
Austin 41.2%
Stockholm’s workforce is among the most educated
Copenhagen 39.5%
in the world. The Stockholm Capital Region benefits
Portland 38.8%
from an incredibly well-educated labor pool. Of the
Pittsburgh 38.2%
15 and older population, 42 percent have obtained
San Diego 38.2%
at least a tertiary education, second highest among
Munich 34.1%
B R O O K I N GS peer metro areas.55 Importantly, Stockholm’s labor
M E T R O P O L I TA N pool has acquired technical skills that are required
Source: Brookings analysis of Oxford Economics data.
POL I CY to invent and complement technology, which are
P R O G RA M a critical input to maintain the region’s innovation
24Figure 28. Workforce replacement rate coverage in 2034
1.7
1.5
1.3 1.3
1.0 Required cover: 1.0 time
0.8
0.6
0.5
0.4
Austin San Diego Seattle Portland Pittsburgh Stockholm Zurich Munich Copenhagen
Source: Brookings analysis of Oxford Economics data.
Figure 29. Foreign-born share of total Figure 30. Share of students failing to qualify
population, 2011 for upper secondary school in Sweden by place
of birth , 2009
23%
Zurich 26%
San Diego 23%
Munich 21%
Stockholm 20%
Seattle 16%
9%
Copenhagen 15%
Austin 14%
Portland 12%
Pittsburgh 3%
Native Foreign-Born
Source: Brookings analysis of Oxford Economics data. Source: Swedish Ministry of Education and Research
While population growth has been strong, Successfully integrating foreign-born workers
Stockholm’s current demographic profile sug- can help address workforce shortages, but dis-
gests looming workforce shortages in the coming parities in skill development and employment
decades. The Stockholm Capital Region’s population between native-born Swedes and immigrants must
has been growing quickly in recent years, as workers be addressed. Immigration can help counteract
and families gravitate towards good jobs and a high Stockholm’s demographic transition in the coming
quality of life. Yet, even with recent growth, in 20 decades. Foreign-born individuals currently account
years more people may be leaving the workforce than for one-fifth of the region’s population, up from 17
entering it. Simply put, Stockholm needs to continue
57
percent in 2001.58 Only Copenhagen has experienced
to attract young workers and families to maintain its more growth in its foreign-born population during
labor supply. Copenhagen, Munich, and Zurich also that period. As immigration has increased, however,
face these challenges. U.S. peer cities, by compari- disparities in educational and labor market outcomes
son, are well-positioned demographically due to their between foreign-born and native-born youth have GLOBAL CITY
younger populations and higher shares of foreign- emerged. While only 9 percent of Swedish-born stu- PROFILE:
born individuals. dents do not qualify for entry into upper secondary STOCKHOLM
25school, fully 23 percent of foreign-born students fail than for native Swedes (6.8 percent).60 Addressing
to qualify. Similarly, the share of youth aged 15-24
59
these disparities will be imperative for Stockholm to
that are not in the education system or employed maintain a skilled workforce.
(NEETs) is much higher for immigrants (10.0 percent)
➤ BOTTOM LINE: The Stockholm Capital Region’s high levels of human capital remain a critical
asset. Workers with science and technology training are needed complements to the capital and technologies
deployed in Stockholm’s innovation ecosystem, and serve as the key ingredient to the Capital Region’s key
advanced industries. Yet, as the region and country age, future workforce shortages loom, threatening the
competitiveness of these sectors. Foreign migration provides one avenue to address this coming shortfall, and
immigration has grown in the Capital Region. Key for the region’s future competitiveness will be to successfully
integrate, educate, and employ these new entrants.
D. I N F RAST RU CT U R E Stockholm’s prominence in international avia-
tion networks is growing, but still lags several
WHY IT MATTERS: Infrastructure and the global peers. In addition to goods, metropolitan
spatial layout of a metropolitan area matter economies must efficiently move people. Airports
for competitiveness in two ways. First, firms rely upon serve as key exchange points in the domestic and
global access points like airports and ports and digital international flow of people and ideas, and in doing
infrastructure to bring their products and services to so help stimulate regional employment and GDP per
markets outside the region in the most cost-effective capita growth.66 In 2014, nearly 30 million passengers
manner possible. Second, the competitiveness of a
61
moved through the airports in the Stockholm region,
regional economy also hinges on its ability to effec- the 57th highest total of any metropolitan area in the
tively connect its people and physical assets to their world and fifth most among global peer regions.67
best use within the region—what planners and eco- Since 2004, Stockholm’s two-way passenger flows
nomic developers call “spatial efficiency.”62 have increased by 5.1 percent annually, second highest
among its peers, just behind Copenhagen.
Stockholm benefits from a leading national trade
and logistics infrastructure. Metropolitan areas
rely on the exchange of goods to allow for economic
specialization and, ultimately, long-term growth
and prosperity. Freight transportation networks are
critical to forging these economic connections, and
the Stockholm region’s ability to deliver goods to
“In 2014, nearly 30 million
the global marketplace depends on infrastructure
passengers moved through
countrywide.63 According to the World Bank, Sweden’s
the airports in the Stockholm
transportation and logistics system is one of the most
region, the 57th highest total
well-developed in the world, ranking sixth out of 160
of any metropolitan area in the
countries in 2014.64 Partly due to the efficiency of its
world and fifth most among
B R O O K I N GS freight infrastructure, it costs less to export a shipping
global peer regions.”
M E T R O P O L I TA N container to trading partners from Stockholm ($725)
POL I CY than from European peer cities of Copenhagen ($795)
P R O G RA M or Zurich ($1,660).65
26You can also read