Global Bottled Water Industry: A Review of Impacts and Trends - United Nations University Institute for Water, Environment and Health
←
→
Page content transcription
If your browser does not render page correctly, please read the page content below
United Nations University
Institute for Water, Environment and Health

Global Bottled Water
Industry: A Review
of Impacts and Trends

Zeineb Bouhlel
United Nations University Institute for Water, Environment, and Health,
Hamilton, ON, Canada

Jimmy Köpke
United Nations University Institute for Water, Environment, and Health,
Hamilton, ON, Canada
Helmholtz Centre for Environmental Research,
Leipzig, Germany

Mariam Mina
McMaster University,
Hamilton, Canada

Vladimir Smakhtin
United Nations University Institute for Water, Environment, and Health,
Hamilton, ON, Canada

About UNU INWEH
UNU INWEH’s mission is to help resolve pressing water
challenges that are of concern to the United Nations, its
Member States, and their people, through critical analysis
                                                               © United Nations University Institute for Water,
and synthesis of existing bodies of scientific discovery;
                                                               Environment and Health (UNU INWEH), 2023
targeted research that identifies emerging policy issues;
application of on-the-ground scalable science-based solu-      Suggested Reference: Bouhlel, Z., Köpke, J., Mina, M.,
tions to water issues; and global outreach. UNU INWEH          and Smakhtin, V., 2023. Global Bottled Water Industry:
carries out its work in cooperation with the network of        A Review of Impacts and Trends United Nations,
other research institutions, international organisations and   University Institute for Water, Environment and
individual scholars throughout the world.                      Health, Hamilton, Canada.
UNU INWEH is an integral part of the United Nations            Front cover image: Shutterstock, Riccardo Mayer
University (UNU) – an academic arm of the UN, which            Back cover image: Shutterstock, Chaiyapruek Youprasert
includes 13 institutes and programmes located in 12 coun-      Design: Art and Words Inc.
tries around the world, and dealing with various issues of     Download at: http://inweh.unu.edu/publications/
development. UNU INWEH was established, as a public            ISBN: 978-92-808-6114-3
service agency and a subsidiary body of the UNU, in 1996.
Its operations are secured through long-term host-country      UNU INWEH is supported by the Government of Canada
and core‑funding agreements with the Government of             through Global Affairs Canada.
Canada. The Institute is located in Hamilton, Canada, and
its facilities are supported by McMaster University.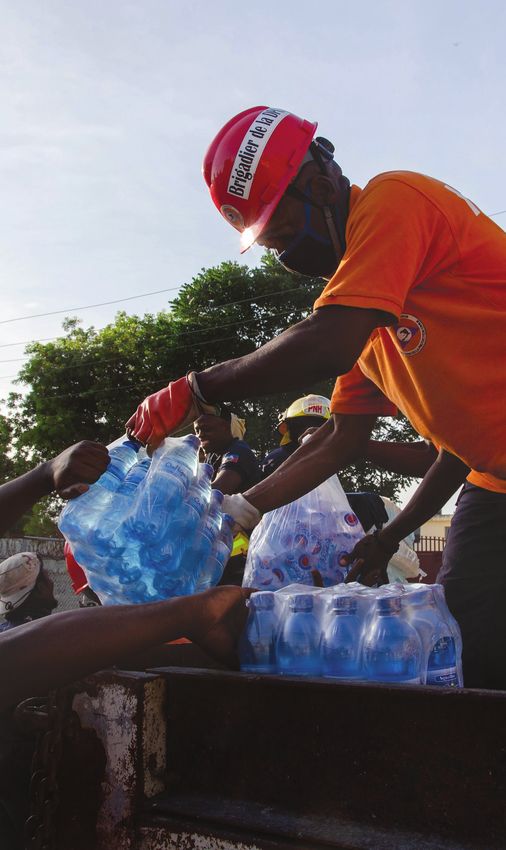
Contents

Summary.  .  .  .  .  .  .  .  .  .  .  .  .  .  .  .  .  .  .  .  .  .  .  .  .  .  .  .  .  .  .  .  .  .  .  .  .  .  .  .  .  .  .  .  .  .  .  .  .  .  .  .  .  .  . 2

Introduction .  .  .  .  .  .  .  .  .  .  .  .  .  .  .  .  .  .  .  .  .  .  .  .  .  .  .  .  .  .  .  .  .  .  .  .  .  .  .  .  .  .  .  .  .  .  .  .  .  .  .  . 3

Bottled Water Market: Status
and Trends. .  .  .  .  .  .  .  .  .  .  .  .  .  .  .  .  .  .  .  .  .  .  .  .  .  .  .  .  .  .  .  .  .  .  .  .  .  .  .  .  .  .  .  .  .  .  .  .  .  .  .  .  . 4

         Bottled water types . . . . . . . . . . . . . . . . . . . . . . . . . . . . . . . . . . . . . . . . . . 4

         Market size, structure, and geography . . . . . . . . . . . . . . . . . . . . . . . . . . . 5

         Key drivers. . . . . . . . . . . . . . . . . . . . . . . . . . . . . . . . . . . . . . . . . . . . . . . . . 10

The Question of Quality .  .  .  .  .  .  .  .  .  .  .  .  .  .  .  .  .  .  .  .  .  .  .  .  .  .  .  .  .  .  .  .  .  .  .  .  .  .  .  .  . 14

Bottled Water and Resource Depletion.  .  .  .  .  .  .  .  .  .  .  .  .  .  .  .  .  .  .  .  .  .  .  .  .  .  .  .  . 19

Bottled Water and Plastic Pollution .  .  .  .  .  .  .  .  .  .  .  .  .  .  .  .  .  .  .  .  .  .  .  .  .  .  .  .  .  .  . 22

         Impacts . . . . . . . . . . . . . . . . . . . . . . . . . . . . . . . . . . . . . . . . . . . . . . . . . . . 23

         Recycling. . . . . . . . . . . . . . . . . . . . . . . . . . . . . . . . . . . . . . . . . . . . . . . . . . 24

        Alternatives. . . . . . . . . . . . . . . . . . . . . . . . . . . . . . . . . . . . . . . . . . . . . . . . 24

Bottled Water and Sustainable Development .  .  .  .  .  .  .  .  .  .  .  .  .  .  .  .  .  .  .  .  .  .  . 25

Conclusions.  .  .  .  .  .  .  .  .  .  .  .  .  .  .  .  .  .  .  .  .  .  .  .  .  .  .  .  .  .  .  .  .  .  .  .  .  .  .  .  .  .  .  .  .  .  .  .  .  .  .  . 28

Acknowledgements .  .  .  .  .  .  .  .  .  .  .  .  .  .  .  .  .  .  .  .  .  .  .  .  .  .  .  .  .  .  .  .  .  .  .  .  .  .  .  .  .  .  .  .  . 30

References. .  .  .  .  .  .  .  .  .  .  .  .  .  .  .  .  .  .  .  .  .  .  .  .  .  .  .  .  .  .  .  .  .  .  .  .  .  .  .  .  .  .  .  .  .  .  .  .  .  .  .  . 30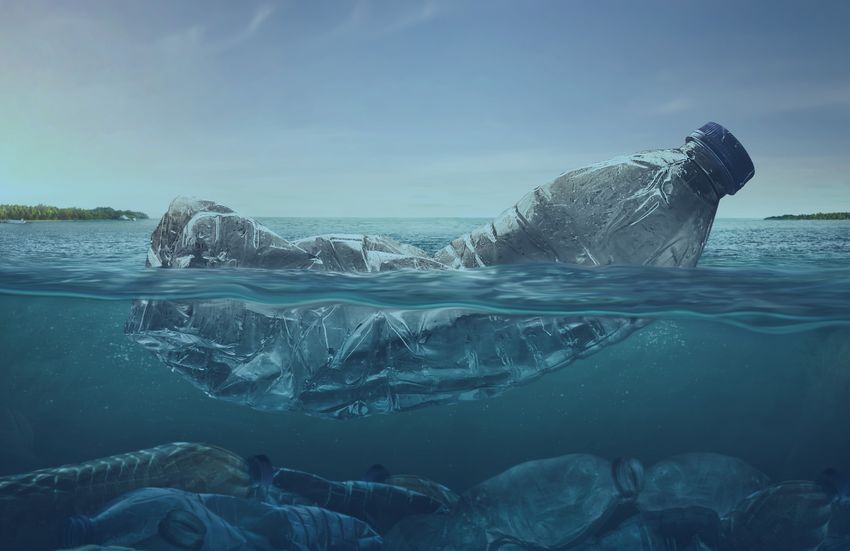
SUMMARY                                                               Withdrawals for bottled water can contribute to ground-
                                                                      water resource depletion in areas of bottled water
The report examines facts and perceptions about bottled               procurement, although case studies that illustrate this are
water in the global context. It analyses the geography,               rare. However, even if such withdrawals are small in abso-
structure, trends, and drivers of the global bottled water            lute terms globally or compared to larger water consumers
market. It examines the existing knowledge on the qual-               like irrigated agriculture, local impacts on water resources
ity of bottled water, its impacts on water resources, and             may be significant. The lack of data available on water
its role in plastic pollution. It raises the question of the          volumes extracted by the bottled water industry is largely
bottled water industry’s contribution to the sustainable              due to the lack of transparency and a legal foundation that
development goal on universal access to safe drinking                 would have forced bottling companies to publicly disclose
water. The analysis considered only those types of bottled            extracted water volumes and assess the environmental
water that have little or no difference in taste from the tap         consequences of their activities. The Global South, where
water provided by regular municipal water supply.                     safe drinking tap water is not always available, represents
                                                                      potential future markets for bottled water. Lack of national
It is shown that bottled water is widely consumed in the
                                                                      policies for water management may promote uncontrolled
both Global North and South although prices can be orders
                                                                      groundwater withdrawals for bottled water procurement
of magnitude higher than tap water. The current global bot-
                                                                      with little or no contribution to a sustainable long-term
tled water sales are estimated at almost 270 billion US$
                                                                      drinking water supply.
and 350 billion liters. The report maps and ranked the top
50 countries in the world by total and per capita bottled             The report collates scattered information on plastic pollu-
water sales both in dollars and liters. The Asia-Pacific              tion associated with bottled water, pointing out that the
region constitutes about half of the global bottled water             world currently generates around 600 billion plastic bottles
market, and the Global South countries together about                 amounting to approximately 25 million tonnes of plastic
60%. The USA, China and Indonesia combined comprise                   waste, which is not recycled but is disposed of in landfills
half of the global market. Germany is the biggest market              or as unregulated waste. While there are signs of growing
in Europe, Mexico in the LAC region and South Africa in               social awareness of the adverse impacts of plastics on the
Africa. Singapore and Australia stand out as the leaders in           environment, a breakthrough solution that could radically
both annual revenue and volume of bottled water sold per              reduce the environmental impacts of plastics does not yet
capita, with the USA and China per capita indicators being            appear to exist. Hence plastic pollution will likely continue
much smaller.                                                         in the years to come.

The report indicates that bottled water market drivers dif-           The report argues that while progress toward universal
fer significantly between the Global North and the Global             access to safe drinking water for all is significantly off‑track,
South. In the former, bottled water is often perceived as a           the expansion of bottled water markets slows this progress
healthier and tastier product than tap water and is more a            down, distracting attention and resources from acceler-
luxury good than a necessity. In the Global South, bottled            ated public water supply systems development. Estimates
water sales are stimulated primarily by the lack or absence           suggest that less than half of what the world pays for bot-
of a reliable public water supply.                                    tled water annually would be sufficient to ensure clean tap
                                                                      water access for hundreds of millions of people without
Based on around 60 case studies from more than 40 coun-
                                                                      it – for years. There are recent high‑level initiatives that
tries from every region of the world, the report illustrates
                                                                      aim to scale up financing for the Sustainable Development
that there have been numerous cases of inorganic, organic,
                                                                      Goals, including water‑related ones. Such initiatives are
and microbiological contamination of hundreds of bottled
                                                                      an opportunity for the bottled water sector to become an
water brands of all bottled water types and that such con-
                                                                      active player in this process and help accelerate the prog-
tamination often exceeded local or global standards. This
                                                                      ress toward sustainable water supply, particularly in the
represents strong evidence against the misleading percep-
                                                                      Global South.
tion that bottled water is an unquestionably safe drinking
water source and argues that the provision of a safe and
reliable drinking water supply in any country may not be
achieved at the expense of one water source over another.

2     Global Bottled Water Industry: A Review of Impacts and Trends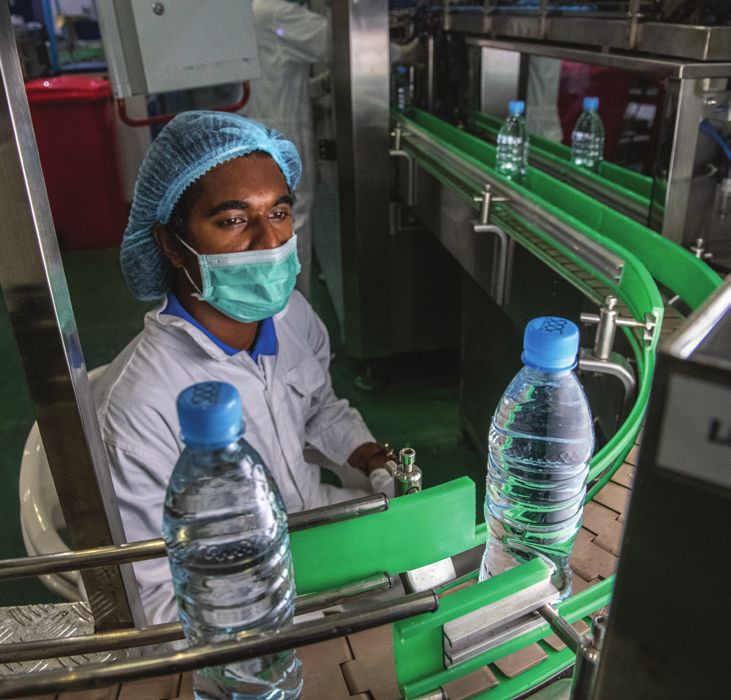
INTRODUCTION
Bottled/packaged drinking water, the water that is filled
into hermetically sealed containers of various compos-
itions, forms, and capacities (i.e. bottles, water dispensers,
sachets) and that is safe for direct consumption (FAO/WHO,
2007), has at present a large variety of types and brands and
is widely consumed around the globe in countries with dif-
ferent levels of economic advancement. For simplicity, the
term “bottled water” in this report refers to water packaged
in any type of container, for individual and household use.

Bottled water evolved from a niche product to one of the
most popular beverages in the world. In Europe, it can be
traced as far back as the 16th Century when natural min-
eral water was sold in glass bottles and was considered a
luxury beverage for special occasions (Brei 2018, Hawkins
2017). The first bottled mineral water for public consump-
                                                                 Mineral water in sachet container sold in Yaounde, Cameroon.
tion in the USA was in the second half of the 18th century       By StreetVJ, Shutterstock
(Hawkins et al. 2015, Pandal 2020), and industrially carbon-
ated water was patented in 1806 (Jain et al. 2019).

Despite the decrease in the cost of glass, bottled water         2018, Greene 2014). At the same time, bottled water rarely
consumption remained relatively low until the middle             faced the same rigorous public health and environmental
of the 20th century (Brei and Tadajewski 2015, Foltz             regulations as tap water (Brei 2018, Hawkins 2017).
1999, Hawkins 2017, Marty 2005, Spar 2008). This began
to change in the late 1960s and 1970s with the emerging          At present, the global market for all non‑alcoholic pack-
interest in general fitness and the increased European           aged beverages generates revenues of over $1,225 billion.
mineral water imports to the USA (Hawkins, 2017, Jain et         Bottled water makes 17–24% of this number depending on
al. 2019). The introduction of polyethylene terephthalate        how “beverage market” and “bottled water” are defined
plastic (PET) in the late 1970s further accelerated bottled      (Ross 2021, Statista 2022b). With such significant “weight”,
water sales (Hawkins 2017). In the 1980s, big food and bev-      the bottled water sector can play a major role in global sus-
erage corporations such as Nestlé and Danone seized the          tainable development processes, particularly considering
opportunity to diversify their beverage products by produ-       how critical water is to humans.
cing “water” and in the 1990s, PepsiCo and Coca‑Cola also        At the same time, the controversy surrounding bottled
entered the market (Green 2014, Hawkins 2017).                   water is also significant, and the overarching question in
The following decades were marked by a rapid global mar-         this context is whether the bottled water sector already
ket expansion, product diversification (e.g., “functional        contributes to such development, and if so, where, how, and
water” or “vitamin water”) and even the replacement of           to what extent. Consequently, the report makes an attempt
tap water with bottled water as the main drinking water          to develop a comprehensive look at the bottled water sec-
commodity in some countries. These processes occurred            tor globally. Accordingly, the report objectives are to:
simultaneously with a general underinvestment in public          • Evaluate the current state of and trends in the global
water supply and distribution systems (Cohen and Ray               bottled water market.
2018) and increasingly negative perceptions of tap water         • Examine the existing knowledge and quantitatively sum-
quality and concerns over its impacts on health (Jaffee and        marize the key health and environmental impacts of the
Newman 2013, Rodwan 2018, Wilk 2006). Beverage corpor-             bottled water industry.
ations marketed bottled water as a ‘safe alternative’ to tap
water and drew consumers’ attention to water quality (Opel       • Determine if and how the above bottled water market
1999, Wilk 2006) by using isolated public water system fail-       measures, trends, and drivers on one hand, and bottled
ures such as the cholera outbreak in Mexico (1985) and the         water impacts on the other, affect the achievement of the
cryptosporidium crisis in Sydney (1998) (Cohen and Ray             SDGs and water‑related ones – in particular.

                                                                   Global Bottled Water Industry: A Review of Impacts and Trends   3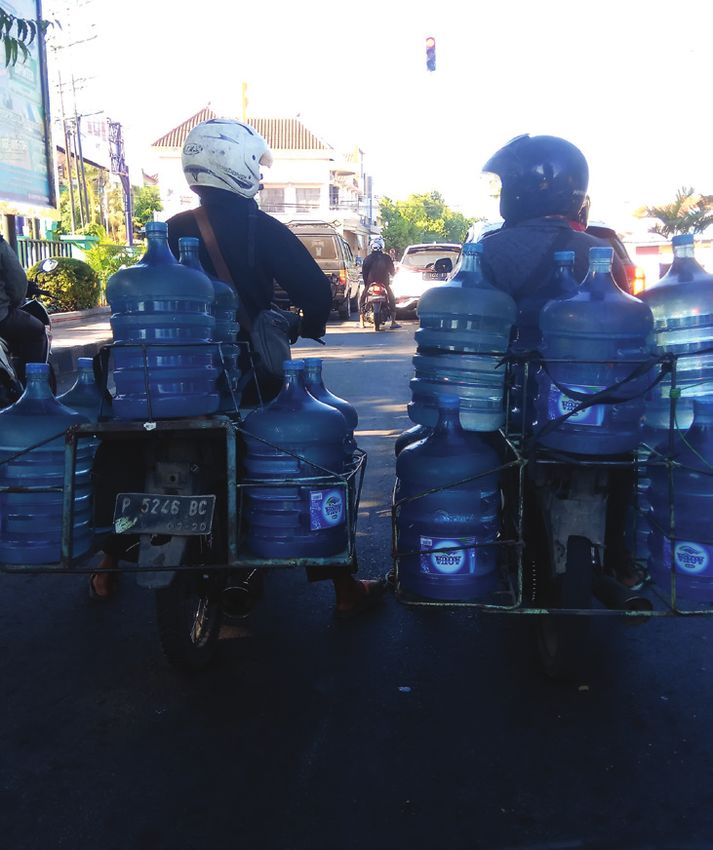
BOTTLED WATER MARKET:                                                      Natural mineral water (Figure 1). This water comes from
                                                                           groundwater sources where the water is naturally protected
STATUS AND TRENDS
                                                                           from pollution and is characterized by the presence of
                                                                           minerals and trace elements. The composition of elements
Bottled water types
                                                                           varies with the geographical location and gives the water a
The market today contains a wide range of bottled water                    characteristic taste and commercial name (e.g., Evian, Fiji
types. Definitions of these types provided by various inter-               Natural Artesian). There is no clear consensus, however, on
national and governmental sources, such as the Codex                       the concentration of minerals at which the water is con-
Alimentarius Commission (FAO and WHO, 2007), the Inter-                    sidered ‘mineral’. For instance, The International Bottled
national Council of Bottled Water Associations (ICBWA,                     Water Association (IBWA) standard is 250 ppm, while that
2022), the International Bottled Water Association (IBWA                   of the European Federation of Bottled water is 50 ppm. It is
2022b), the Drinking Water Research Foundation (DWRF                       critical for mineral bottled water that its mineral compos-
2022) and others vary significantly. However, the main cri-                ition remains unchanged from the source to the consumer
teria for the most common categorization appear to include                 and receives no treatment. Its mineral composition, origin,
geological origin (where the water is collected), chemical                 and source should be clearly indicated. (In the rest of this
composition (whether it contains minerals and if they are                  report, “natural mineral water” is referred to simply as
stable), and carbonation (whether or not water has carbon                 “mineral” water).
dioxide in it) and hence, whether it is sparkling or still. In
                                                                          Other natural water. Water in this category comes pre-
addition, all waters that are bottled can essentially be
                                                                          dominantly from groundwater sources such as wells and
separated into two large categories – natural and treated,
                                                                          springs. Glacier water is also included in this category
although such a simple categorization alone may not be
                                                                          (Figure 1). The water source gives the product its taste and
reflective of the wide range of bottled water types. This
                                                                          commercial name. The product should be free of pollutants,
report considered primarily those bottled water types that
                                                                          should not be subjected to any major treatment, and may or
have little or no difference in taste from tap water provided
                                                                          may not contain minerals. Other natural water differs from
by municipal water supply. Such types can be grouped into
                                                                          natural mineral water in several ways: i) for well and spring
three main categories.
                                                                          water, the mineral composition doesn’t need to be constant
                                                                          from source to the consumer: ii) packaging can be done far
                                                                          from the source, and iii) listing mineral composition is not
                      4%                                                  required even though bottled water companies often do so
                6%
                                                                          for commercial purposes. In the rest of this report, “other
                                                                          natural water” is referred to simply as “natural” water.

    18%                                                                   Treated water. Treated water is sometimes called purified,
                                       42%
                                                                          prepared, processed, or table water. Its origin is not rel-
                                                                          evant to its branding and there are no legal obligations to
                                                                          disclose this information. It could come from a municipal
                                                                          or community water system, a surface water source, or
                                                                          an unconfined aquifer. This water is subjected to required
          20%                                                             treatments and disinfection, including chlorination, to
                           10%                                            make it safe for consumption. Treatment may be by reverse
                                                                          osmosis, distillation, deionization, or other processes.

                                                                          Bottled water in any category can be ‘still’ or ‘sparkling’
    Treated Water                                                         (i.e., carbonated, either naturally or industrially). To ensure
    Spakling/Carbonated Water                                             conformity in interpretations and comparisons between
    Mineral Water                                                         tap and bottled water, only still water is considered in this
    Spring Water                                                          report. Sparkling water constitutes only 10% of the bottled
    Well and Artesian Well Water                                          water market (Figure 1) and its taste differs from tap water.
                                                                          Bottled waters that have been modified by the addition of
    Glacier Water
                                                                          minerals, flavors, or supplements are not considered in this
                                                                          report as they are considerably different from regular tap
FIGURE 1. Market structure by volume of bottled                           water and represent a small portion of the bottled water
water type (2021)                                                         market (Brei 2018).

4         Global Bottled Water Industry: A Review of Impacts and Trends
Market size, structure, and geography
2%
9% The global market for the above three main types of bottled
water is estimated to be almost 270 billion US$ from sales of
11% 350 billion liters in 2021. The market has increased by 73%
during the last decade, making it one of the fastest‑growing
49%
markets in the world (Statista 2020).
Current bottled water total sales vary significantly between
major geographical regions (Figure 2). The Asia‑Pacific
29%
region represents the largest regional market both in dollar
terms and liters (consumption), followed by North Amer-
ica and Europe. The Global South combined (Asia‑Pacific,
Africa, Latin America and the Caribbean) represents around
60% of the global sales both in dollars and liters.
Asia-Pacific
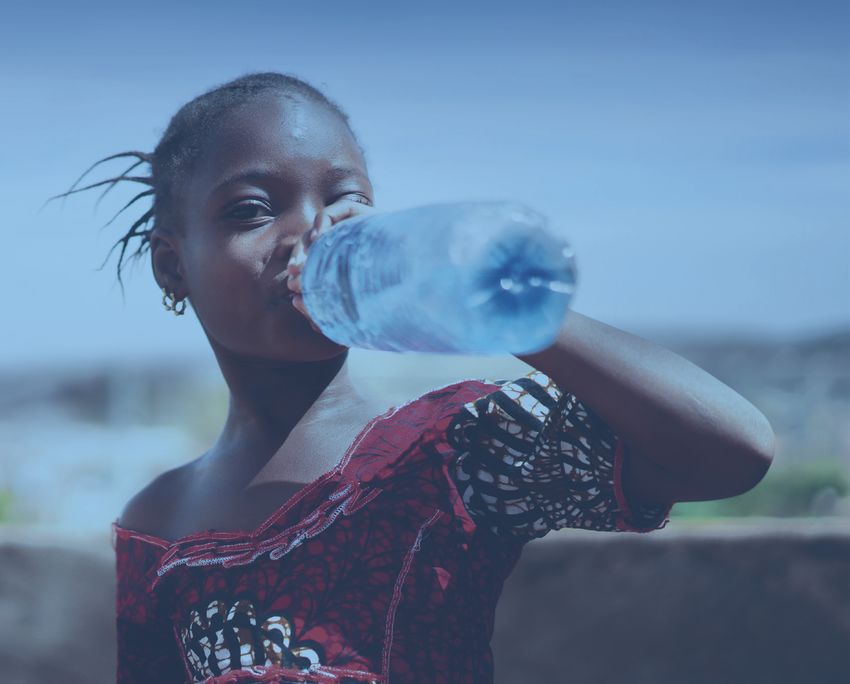
North America Treated water was the largest market component in 2021
Europe by volume, representing almost half of all bottled water
consumed globally (47%), followed by mineral water (33%)
Latin America and the Caribbean
(Figure 3, right). A similar pattern has been observed as
Africa
confirmed by other market analyses (Grand View Research
2022, Statista 2020). However, the category “natural
FIGURE 2. Global bottled water market structure by major water” appears to be the most profitable market segment
geographical region in 2021 (percent of global US$ revenue) (Figure 3, left).
28%
28% 33%
33%
22%
22%
47%
47%
USD
USD VOLUME
VOLUME
33%
Mineral
Mineral
VOLUME 20%
20%
50%
50% Natural
Natural
Treated
Treated
Mineral
20%
Natural
Treated
FIGURE 3. Global bottled water market structure by three main water types in 2021
(percent of global US$ revenue and consumption volume in liters)
Global Bottled Water Industry: A Review of Impacts and Trends 5
The bottled water market comprises a range of compan-                          Germany is the biggest market in Europe, Mexico in the
ies from multinational to local. PepsiCo, Inc., Coca‑Cola                      Latin America and Caribbean region (LAC), and South
Company, Nestlé S.A., Danone S.A, and Primo Corporation                        Africa in Africa (Figure 5). Although both high-income coun-
are the five companies with a share of the global market                       tries (HIC) and low and middle-income countries (LMIC)
exceeding 2% each and have combined sales of $65 billion                       appear among the top 50 biggest bottled water markets,
(over 25% of the total market by sales, Figure 4). Collect-                    the market value for a specific country can be related to
ively, smaller local businesses have a significant influence                   either a high price per unit sold or a high quantity sold.
over the sector. Over 70% of bottled water products are                        For instance, the price for a unit of bottled water in North
produced locally and transported regionally, although                          American and European countries is around $2.5 per unit
some large national markets like the USA and China import                      on average, which is more than double that in Asia, Africa
sometimes millions of liters of bottled water (Ross 2021,                      and LAC ($0.80, $0.90 and $1 respectively). Australia, the
UN Comtrade 2021).                                                             fifth largest market, has the highest price per unit on aver-
                                                                               age ($3.57) (Statista 2020, 2022a).
On a country level, the largest market is the USA with total
revenue of around $64 billion, followed by China (almost                       Total consumption of bottled water in liters follows a similar
$50 billion) and Indonesia (almost $22 billion) (Figure 5                      pattern to sales in US$, with the USA, China, and Indonesia
and Figure 6). These three countries combined earn half                        being the largest consumers, collectively accounting for
the global total revenue (24%, 18% and 8% respectively).                       nearly 40% of the global bottled water volume. Figure 7
                                                                               shows the top 50 countries by total bottled water con-
                                                                               sumed while illustrating the structure of this consumption
                                                                               by the three main water types.

                                                         7.2%

                                                                        7.0%
                                                                                               PepsiCo Inc. (Aquafina)

                                                                                               The Coca Cola Company (Dasani)

                                                                                               Nestlé Waters
                                                                               4.9%
                                                                                               Danone

                                                                                  3.1%         Primo Water Corporation

                                                                                               Hangzhou Wahaha Group Co., Ltd
                                                                                  2.9%         Poland Spring
62.2%                                                                             2.0%         Icelandic Glacial Inc.

                                                                                  2.0%         AJE Group

                                                                                  1.9%         Suntory Beverage & Food Ltd
                                                                               1.9%            Nongfu Spring
                                                                           1.7%
                                                                                               Niagara Bottling, LLC
                                                                         1.7%
                                                                                               Other small companies (less than 1.5%)
                                                                    1.7%

FIGURE 4. Global bottled water market structure by company in 2021 (percent of global US$ revenue)

6       Global Bottled Water Industry: A Review of Impacts and Trends
Billion USD
  > 20        0.25–0.5
  5–20        0.1–0.25
  2–5         0.05–0.1
  1–2         0–0.05
  0.5–1       No Data

FIGURE 5. Bottled water market size (billion US$) by country (2021)

Bottled water sales per capita reveal a different picture             Market growth differs by bottled water type. Treated and
(Figure 8). Singapore and Australia emerge as the lead-               natural mineral water are the fastest‑growing markets
ers in both annual revenue and volume of bottled water                since 2018 (10% and 12% respectively) whereas the market
sold (Singapore: 1,129 liters and $1,348 per capita in 2021;          for natural water is growing at a slower rate at around 5%
Australia: 504 liters and $386 per capita the same year).             for the same period (BlueWeave 2022).
There is a large drop in both indicators between Singapore
and Australia, after which the per capita numbers are much            Table 1 lists the top 10 fastest‑growing country markets
lower (Figures 9 and 10). The USA, Indonesia, and particu-            by water type. Egypt has the fastest‑growing treated
larly China, rank much lower in terms of both per capita              water market overall (40%). Seven other countries from
bottled water consumption and revenue compared to their               the Global South are in the top 10 fastest‑growing treated
corresponding total numbers.                                          water markets with growth rates of 10–17% (Algeria, Brazil,
                                                                      Indonesia, UAE, India, Morocco and Saudi Arabia). India
At a compound annual growth rate of 5.2% since 2021                   (27%), Egypt (18%) and Algeria (17%) are among the top
(UN Stats 2021), the bottled water market has been grow-              10 fastest‑growing markets of mineral water, competing
ing faster than other beverage markets such as coffee                 with South Korea (28%), Japan (24%), France, Peru, South
(3.5%) during the same period (Statista 2021a, 2022a).                Africa and Malaysia (13–16%). For natural waters, the lead-
From 2022, the market is projected to increase at an even             ers are all from Europe (Belgium, Netherlands, UK, and
faster rate of approximately 7% and reach $500 billion by             France) with a range of 6–9%), where spring water is the
2025–2030. This gives bottled water the highest growth                most appealing bottled water product (NMWE 2021).
potential among all soft drink products (BlueWeave 2022,
Grand View Research 2022, Statista 2021a and 2022b).

                                                                        Global Bottled Water Industry: A Review of Impacts and Trends   7
FIGURE 6. Top 50 countries in 2021 by their bottled water sales (US$ million)

8     Global Bottled Water Industry: A Review of Impacts and Trends
FIGURE 7. Top 50 countries in 2021 by total bottled water consumption and composition by water type.
(“No data on types” indicates cases where only totals are available)

                                                                     Global Bottled Water Industry: A Review of Impacts and Trends   9
USD/Capita
>200 20–30
100–200 10–20
50–100 5–10
40–50 1–5
30–40 No Data
FIGURE 8. Bottled water sales in US$ per capita (2021)
Key drivers • Convenience and lifestyle aspects: bottled water is easy to
purchase and carry and the bottles are easy to dispose of.
Bottled water market drivers vary significantly by country.
In high-income countries, bottled water consumption is Some of the above perceptions are overrated (as the next
often high despite well-developed domestic water supply section of this report will illustrate) and overall, based on
systems, and a significant percentage of the population the above, it may be argued that in high‑income countries
prefers bottled water. About 31% and 38% of Canadians bottled water is largely a “luxury good”.
and Americans use bottled water as their primary drinking
source (Johnstone and Serret 2012, Vieux et al. 2020). In In mid‑ and low‑income countries, bottled water con-
France, bottled water accounts for 64% of the soft drinks sumption is linked to poor tap water quality and often
market, even though bottled water can be almost 350 times unreliable public water supply systems. These problems are
more expensive than tap water (Brei 2018). Bottled water often caused by corruption and chronic underinvestment
appears to be the main drinking water source for around in piped water infrastructure (Greene 2014, Hawkins 2017,
60% of Italians (Johnstone and Serret 2012) and Koreans Jaffee and Case 2018, Pacheco‑Vega 2019).
(Cha and Lee 2020). According to multiple sources (Brei
In Mexico, distrust in tap water increased significantly after
2018, Clarke 2007, Hawkins et al. 2015, Opel 1999, Stoler
several cholera outbreaks following the 1985 Mexico‑city
2017) high bottled water consumption in the Global North
earthquake that affected public water utilities and people
countries is related to:
turned to bottled water (Greene 2014). Only about 20% of
• Health concerns: bottled water is seen as a healthier Mexicans are satisfied with the quality of publicly supplied
product than tap water. tap water, with over 90% of those citing health concerns.
• Taste concerns: bottled water is perceived to taste better, About 80% of the population use bottled water and 10%
due to its mineral composition and because tap water home‑purified water as their primary drinking water source
may carry a taste of chlorine. (Johnstone and Serret 2012). In the Dominican Republic,
60% of households use bottled water as their primary water
• Active marketing by water companies exploiting the source, but there is a strong positive correlation between
idea of bottled water purity and providing brands for income and bottled water consumption (McLennan 2015,
specific target groups like pregnant women, children, National Population Commission 2013).
and sports‑minded people.
10 Global Bottled Water Industry: A Review of Impacts and TrendsFIGURE 9. Top 50 countries in 2021 by their bottled water sales per capita
Global Bottled Water Industry: A Review of Impacts and Trends 11FIGURE 10. Top 50 countries by per capita consumption in 2021 12 Global Bottled Water Industry: A Review of Impacts and Trends
TABLE 1. Bottled water market growth rates during 2018–2021 among 10 fastest‑growing national markets for each of three main
bottled water types

                     Mineral                             Natural                                  Treated

  Rank               Country          CAGR*, %           Country             CAGR*, %             Country              CAGR*, %

  1                  South Korea      28.0               Belgium             9.4                  Egypt                43.3

  2                  India            27.1               Netherland          7.8                  Algeria              17.5

  3                  Japan            24.2               Argentina           7.5                  Brazil               17.2

 4                   Egypt            17.7               UK                  7.1                  Indonesia            14.8

  5                  Algeria          16.6               France              6.3                  UAE                  12.9

  6                  France           16.1               Japan               6.0                  India                12.5

  7                  South Africa     13.2               Spain               5.9                  Netherland           10.6

  8                  Peru             13.0               Mexico              5.6                  South Korea          10.3

  9                  Malaysia         12.3               Nepal               5.4                  Morocco              10.3

  10                 Australia        12.3               Singapore           5.4                  Saudi Arabia         10.1

* CAGR‑ compound annual growth rate

Bottled water is a common option for self‑supply in Asia and         cannot rely on groundwater wells (Foster et al. 2021). Over-
Pacific region countries that have low levels of access to pub-      all, the pattern of bottled water consumption in low- and
licly provided piped water sources (Foster et al. 2021, WHO          middle-income countries appears to be determined by the
and UNICEF 2021). This explains a high and growing reliance          following factors (Ferrier et al. 2001, Hawking et al. 2016,
on bottled water in countries such as Indonesia, Thailand and        Race et al. 2015, Race 2012, Packialakshmi et al. 2011,
the Philippines (Foster et al. 2021, Francisco 2014).                Zhelaeve et al. 2021):

In Africa, sachet packaged water is a significant primary            • The need to ensure reliable and safe supplies of clean
drinking water source (Howell et al. 2020, Olukoju 2007,               drinking water.
Stoler 2017, Stoler et al. 2013). In Ghana, sachet water con-        • Government failures to provide quality drinking water
stitutes up to 43% of urban and up to 12% of rural household           through local water utilities.
drinking water (Ghana Statistical Service 2009 and 2013,             • Increasing urbanization but limited water delivery infra-
Morinville 2017, Wright et al. 2016). In Nigeria, sachet water         structure to and within urban centers.
is a primary source for 12% of urban households (National
Population Commission 2013). The growing use of bottled              • Marketing campaigns by the bottled water industry
water by poor communities in Rwanda, Uganda, Kenya and                 aimed at discrediting tap water and promoting the con-
Ghana is driven by a desire for clean, safe drinking water             cept of bottled water purity.
(Howell et al. 2020, Quansah et al. 2015).
                                                                     Public water supply systems in low‑ and middle‑income
Market growth in the Global South may also be influenced             countries need improvement. It is only natural that in the
by factors ranging from the lack of regulations covering             absence of a reliable public water supply, communities will
beverage company operations (Greene 2018, Rosemann                   seek alternative solutions such as bottled water.
2005) to increasing urbanization and growing cities that

                                                                       Global Bottled Water Industry: A Review of Impacts and Trends   13
THE QUESTION OF QUALITY
Bottled water is often seen as a product for those con-
cerned with high health standards compared to tap water
(IBWA 2021, Poškus et al. 2021). The massive and appealing
marketing of bottled water by the beverage industry has
gradually changed perceptions of bottled and tap water
(Cohen et al. 2022, Hawkins 2017, Jaffee and Newman 2013,
Jain et al. 2019, Rodwan 2018, Valavanidis 2020). While
there are examples of water quality issues with public
tap water, it is generally of good quality and safe to drink
with or without filtering in most high‑income countries.
Provision is highly regulated, and frequently tested, and
water quality parameters are publicly disclosed (Cohen et
al. 2022, Diduch et al. 2011, Geerts et al. 2020, Valavanidis,
2020). In contrast, bottled water is generally not nearly as
well‑regulated and is tested less frequently and for fewer
parameters (Abd El‑Salam et al. 2008, Cohen et al., 2022,
Diduch et al. 2013, Parag and Opher 2011). Strict water
quality standards for tap water are rarely applied to bot-
Workers carefully inspecting bottles in a bottling plant in the Maldives.
tled water and even if such analyses are carried out, the By Asian Development Bank
results seldom make it to the public domain (Ferrier 2001,
Parag and Opher 2011, Valavanidis 2020).
A range of factors can adversely affect bottled water sources. The evidence in this review has been compiled
quality. For example, water origin plays an important role from peer‑reviewed journals on academic databases such
in quality (Diduch et al. 2011, Ikem et al. 2002). The min- as Google Scholar, Web of Science, and ScienceDirect and
eral composition of bottled water can vary significantly considers all aspects of bottled water quality including
between different brands, within the same brand in differ- organic, inorganic, and microbiological. The results are
ent countries, and even between different bottles of the summarized in Table 2 by date of publication under each
same batch (Abd El‑Salam et al. 2008, Chidya et al. 2019, contamination type.
Dindarloo et al. 2016, Ikem et al. 2002, Mihayo and Mkoma
2012). Treatment processes such as chlorination, ultra- This summary, while non‑exhaustive, presents the docu-
violet disinfection, ozonation and reverse osmosis (Ahmed mented evidence against the misleading perception that
and Shafique, 2019, Napier and Kodner 2008, Poškus et al. bottled water is an unquestionably pure and safe drinking
2021), storage conditions (duration, light exposure, tem- water source. Although contamination may be occasional,
perature) and packaging material (plastic, glass) may all similarly to tap water, it is clear that bottled water is not
have a potentially adverse impact on bottled water quality immune to all possible types of contaminants.
(Diduch et al. 2011 and 2013, Nawrocki et al. 2002, Vala- This review complements the recent report by WHO et al.
vanidis 2020). Contamination of bottled water due to these (2022), showing, among others, that water quality from all
factors may be (i) inorganic (e.g. heavy metals, pH, turbid- source types is subject to contamination and that the risk
ity, etc.), (ii) organic (benzene, pesticides, microplastics, of contamination varies considerably depending on the
etc.) and (iii) microbiological (pathogenic bacteria, viruses, source. Open surface water sources and unprotected wells
fungus, and parasitic protozoa). and springs are at the most risk, while packaged, bottled,
It has been demonstrated across countries and bottled delivered, and piped water all appear to be at the safe end
water brands that the claim “bottled water is a safer and of the spectrum in most surveyed countries.
healthier alternative to tap water” must be critically evalu- Overall, there is no justification to contrapose bottled water
ated (Cha and Lee 2020, Cohen et al. 2022, Diduch et al. and public drinking water supply sources on the basis of
2013, Valavanidis 2020, Venturini and Frazão 2015, Williams quality. Moreover, as the bottled water market grows, it is
et al. 2015). However, hard evidence for and against claims more important than ever to strengthen legislation to regu-
of purity and safety is limited or scattered across various late industry quality processes and standards.
14 Global Bottled Water Industry: A Review of Impacts and TrendsTABLE 2. Reported cases of bottled water contamination
COUNTRY TYPE or BRAND DESCRIPTION REFERENCE
Inorganic contamination
USA 103 brands About 20% of tested brands are chemically Olson et al. 1999
contaminated at levels beyond the national drinking
water standards.
USA (Alabama) 25 brands of Several contaminants exceeded national standards Ikem et al. 2002
spring water (e.g. As, Cd, Hg, Zn, Se).
Turkey 189 brands Some contaminants are above national and Güler 2007
international guidelines (Na, Cl, F, Cd, Fe, Pb, Ni,
Se) as well as borons and polycyclic aromatic
hydrocarbons (PAHs).
Egypt 14 brands Many samples contain elements above national and Abd El‑Salam et al. 2008
international standards including Pb (exceeding
0.01 mg L‑1 with up to 0.49 mg L‑1 in 86% of samples),
and Fe (exceeding 0.3 mg L‑1 in 64% of samples).
USA 10 brands 38 pollutants including As, bromates, chlorination Stephenson 2009,
by‑products, and trihalomethane. Environmental Working
Group, 2008
Malawi 12 brands Over 82% of brands did not comply with local Chidya et al. 2019
standards for turbidity and pH. Significant discrepancy
between claimed composition on the label and the
actual composition.
Nigeria Bottled and High heavy metal contamination across the country Ajala et al. 2020
sachet water (e.g. Cd, Ni, Cu).
Organic contamination
Argentina Mineral water Food additives and organic micropollutants up to Tombesi and Freije 2002
38 µg L‑1 (e.g. butylated hydroxytoluene).
Thailand bottled from Pesticides, organochlorides, surfactants, disinfection Kruawal et al. 2005
groundwater by‑products, 18 µg L‑1.
Poland, Japan, Europe, Mineral water Carbonyl compounds from packaging material and Mutsuga et al. 2006,
North America storage (e.g. formaldehyde, acetone); levels of 0.6 to Nawrocki et al. 2002
318 µg L‑1.
China, Greece 23 brands of Haloacetic acids (e.g. dichloracetic acid, bromate, Leivadara et al. 2008, Liu
purified, mineral, trichloroacetic acid); 0.1 to 71.8 µg L‑1. and Mou 2004
and spring water
Spain Mineral bottled Perfluorinated compounds between non‑detectable to Ericson et al. 2008
water 0.9 ng L‑1.
Mexico Mineral water Pesticides (e.g. DDT, endosulfan) up to 0.15 µgL‑1. Díaz et al. 2009
Global Bottled Water Industry: A Review of Impacts and Trends 15China (Guangzhou) 21 brands of Food additives and organic micropollutants Li et al. 2010
mineral water (e.g. nonylphenol in all samples) (108 to 298 ng L‑1),
for infants bisphenol A in 17 of 21 samples (17.6 to 324 ng L‑1),
triclosan in 18 of 21 samples (0.6 to 9.7 ng L‑1).
Mexico 6 brands Polychlorinated biphenyls (PCB) levels between Salinas et al. 2010
0.035 to 0.067 µg L‑1.
Saudi Arabia, United 134 brands of High levels of volatile organic compounds such as Di Diduch et al. 2011, 2013
Arab Emirates, Kuwait, mineral and other and Trihalomethanes (e.g. bromoform, chloroform)
Egypt, Lebanon, Italy, bottled water between 0.1 to 38 mg L‑1 (e.g. WHO guideline value for
Turkey, Spain, Scotland, types drinking water: 0.1 mg L‑1 for bromoform and 0.3 mg L‑1
Iceland, Greece, USA for chloroform).
Spain, Greece, Italy, 5 to 17 brands of Alkylphenols and phthalates between non‑detectable Diduch et al. 2013
Czech Republic, treated water up to 9.9 µg L‑1 (e.g. bisphenol A, triclosan).
Honduras, Nepal,
Switzerland, China,
Mexico, Argentina, USA
Germany, France, Italy 13 brands 72% of samples showed significant anti‑estrogenicity Wagner et al. 2013
and 89% were antiandrogenic; detection of responsible
endocrine disruptor di(2‑ethylhexyl) fumarate.
Poland, EU, Ireland, Mineral water Endocrine disruptor compounds from packaging Diduch et al. 2013
Germany materials were found in 10 to 78% of samples.
China, USA, Brazil, India, Unspecified 93% of samples contained microplastics and synthetic Mason et al. 2018
Indonesia, Mexico polymer particles, 10.4 particles L‑1 (> 100 µm), and
325 particles L‑1 (6.5 to 325 µm).
Germany Mineral water Small microplastic fragments in every type of Schymanski et al. 2018
in reusable bottled water (returnable plastic: 118±88 particles L‑1,
and single‑use single‑use plastic: 14 particles L‑1; 11 particles L‑1).
plastic bottles,
cartons, glass
Unspecified Unspecified Over 90% contained fibres and particles of WHO 2019
microplastic.
Unspecified Unspecified 4,000 microplastic particles are consumed annually Cox et al. 2019
via tap water and 90,000 particles per year via
bottled water.
USA Unspecified Ingestion of 90,000 particles annually from March et al. 2020
bottled water.
Thailand 10 brands 140 particles of microplastic L‑1 in single‑use Kankanige and Babel
plastic‑bottled water and 52 particles L‑1 in 2020
glass‑bottled water.
Iran 11 brands of Microplastic particles were detected in 80% Makhdoumi et al. 2021
mineral water of samples with an average concentration of
8.5 particles L‑1.
India Unspecified Plasticizers leach from PET into bottled water Mukhopadhyay et al.
(up to 64,000 ng L‑1). 2022
16 Global Bottled Water Industry: A Review of Impacts and TrendsMicrobiological contamination
Portugal, Spain Unspecified Bacterial contamination leading to cholera and Warburton et al. 1992,
typhoid outbreaks. Blake et al. 1977
Canada Unspecified Bacterial contamination in various stages of bottled Warburton 1993
bottled water water production.
UAE, USA 23 brands 48% of bottled water samples with bacterial Nsanze et al. 1999,
of bottled contamination, and 4% with amoebas. Penland and Wilhelmus
water (mineral, 1999
non‑carbonated)
Brazil 13 brands 15% of brands contaminated with highly infectious Franco and Cantusio
Cryptosporidium oocysts (0.2 to 0.5 oocysts L‑1). Neto 2002
Argentina 8 brands of 79% of samples with filamentous fungi contamination Cabral and Pinto 2002
mineral water by Penicillum citrium, Cladosporium cladosporioides,
2.4% of samples were contaminated with fecal
Streptococci spp.
Ghana Packaged Number of colony‑forming units (CFUs) exceeded Obiri-Danso et al. 2003
water (bottles, national standards in all three types of water; fecal
sealed sachets, contamination in factory‑bagged sachets (2.3%),
hand‑filled hand‑filed hand‑tied bags (23%); 5% Enterococci.
hand‑tied bags)
Mexico 3 brands of Detection of human parasites Giardia and Nichols et al. 2004
mineral water Cryptosporidium (protozoan).
Germany, Italy, France, Mineral water Detected occurrence of antibiotic‑resistant Messi et al. 2005,
bacteria and resistant genes against several groups Mary et al. 2000, Massa
of antibiotics. et al. 1995,
Rosenberg and
Duquino 1989
Greece Mineral water 14% of samples with inadequate microbiological Venieri et al. 2006
quality. The most frequently detected bacterial
contaminant was P. aeruginosa.
Australia, Canada, 68 brands of 12% of brands with confirmed bacterial Legionella Klont et al. 2006
Cuba, Germany, France, mineral water pneumophila contamination.
Greece, Hungary,
India, Italy, Mexico,
Norway, Austria, Spain,
Tanzania, Turkey
Spain Unspecified Bacterial contamination with Salmonella enterica, Palmera‑Suarez et al.
causing 41 cases of infection in infants. 2007
Greece Unspecified 31% of samples were unsuitable for consumption Carr et al. 2008
according to Greek legislation; 14% contained
Pseudomonas aeruginosa (bacteria), and 11%
contained coliform bacteria.
Global Bottled Water Industry: A Review of Impacts and Trends 17Germany Unspecified Hospital acquired outbreak of Pseudomonas Eckmanns et al. 2008
aeruginosa (bacteria) caused by contaminated
bottled water.
Puerto Rico 21 brands Bacterial contamination due to high numbers of Reyes et al. 2008
CFUs (max. 7500 CFUs mL‑1); Contamination by
Pseudomonas fluorescence, Aeromonas baumanni,
Flavobacterium indolgenes.
Ireland Unspecified 7% of tested samples failed to meet European Food Safety Authority
microbiological standards or guidelines. Ireland 2009
France, Portugal Mineral bottled Antibiotic resistance phenotype of cultivable bacteria Falcone‑Dias et al. 2012
water present in all tested bottles of three brands.
Ghana (Accra) Packaged water Number of CFUs (87% of samples) and protozoa (50% Osei et al. 2013
(Bottles, sachets) of samples) for sachet and bottled water (CFUs: 10%)
exceeded international standards; tap water with 40%
of samples exceeding CFUs and protozoa.
Nigeria (South‑West) 15 brands 33% of samples with CFUs within acceptable limits; Igbeneghu and
14 to 18% of samples contained another indicator Lamikanra 2014
organism including Staphylococcus aureus (bacteria).
Bulgaria Unspecified Most frequently isolated contaminant: Pseudomonas Georgieva and
aeruginosa bacteria (11% of samples). Dimitrova 2016
China Unspecified 17.7% of samples did not meet national bottled water Pu and Fukushi 2016
quality standards.
Philippines Unspecified 89% were contaminated with non‑fecal coliforms and Atienza et al. 2016
44% with fecal coliforms.
USA (Ohio) 15 brands Contamination in bottled water from 0.01 to 4,900 Valavanidis 2020
CFUs mL‑1.
Nigeria Packaged water High abundance of microbiological contamination Ajala et al. 2020
(Bottles, sachets) across the country (coliforms, facultative pathogens).
Nepal Domestic brands 48% contamination with total coliform bacteria and Gautam 2021
of bottled water multi‑drug resistant isolates (e.g. Pseudomonas
aeruginosa).
India Unspecified 40% of samples were contaminated with bacteria Reddy et al. 2022
such as E. coli, V. cholerae, Enterobacter aerogenes;
indication of antibiotic resistance.
Iraq 20 domestic 11% bacterial contamination (coliform bacteria) Hamad et al. 2022
brands and problematic bacterial isolates with antibiotic
resistance (Klebsiella pneumonia, P. aeruginosa).
18 Global Bottled Water Industry: A Review of Impacts and TrendsBOTTLED WATER AND
RESOURCE DEPLETION
Like many other industries, bottled water is a high consumer
of water. Besides being the obvious main product, water is
used in the production processes (Nestlé 2021, Coca‑Cola
Company 2021). It has been estimated that Coca‑Cola uses
1.95 liters of water on average to produce one liter of its
final product, Unilever 3.3 liters, and Nestlé 4.1 liters (Hall
2009, Coca‑Cola 2021).
Across the globe, the main source of water that is bottled is
groundwater. In the USA, Nestlé Waters extracts 3 million
liters a day from Florida Springs. In France, Danone
extracts up to 10 million liters a day from Evian‑les‑Bains
in the French Alps. In China, the Hangzhou Wahaha Group
extracts up to 12 million liters daily from Changbai Moun-
tains springs (BlueWeave 2022). Most of China’s bottled
water, however, is sourced from lakes and reservoirs as over
86% of groundwater wells are unsafe for drinking (Zhang et
al. 2022). In countries like Germany, Italy, the UK, Canada,
and Indonesia, bottled groundwater constitutes 70–85%
of all bottled water produced (BlueWeave 2022). Hence,
water withdrawals by the beverage industry contribute to
depleting groundwater resources, already suffering from
other sectors.
Globally, over 2 billion people rely on groundwater as their Women taking fresh water from open bore well in Mumbai
Maharashtra India. By Bodom, Shutterstock
primary water source (Alley et al. 2002). More than half
of all irrigation water used to grow food is extracted from
aquifers (Bierkens and Wada 2019, Wada et al. 2010). Esti-
mates suggest that global groundwater depletion varied Globally, the major water‑depleting sector is irrigated
between 56 to 362 km3 per year over the last three decades agriculture (Molden 2013). Compared to irrigation, bottled
(Döll et al. 2014, Konikow 2011, Pokhrel et al. 2012, Wada water use, both globally and within most countries is much
et al. 2012). The amount of groundwater withdrawn in less—at present. However, there is little data available
certain regions frequently exceeds natural recharge rates on actual water volumes extracted by the bottled water
(Castellazzi et al. 2016, Famiglietti et al. 2011, Richey et industry, and in most cases only indirect and likely inaccur-
al. 2015). Fifteen percent of all extracted groundwater is ate estimates. Total water withdrawals by Coca‑Cola and
non‑renewable (Döll et al. 2014). Nestlé in 2021 were estimated to be about 300 and 100
billion liters respectively (Nestlé 2021, The Coca‑Cola Com-
Figure 11 illustrates estimated annual rates of groundwater pany 2021). While such withdrawals are small in absolute
depletion in some of the world’s major river basins. Sig- terms, local impacts on water resources may be significant.
nificant groundwater depletion has been reported in China
(Famigliett 2014, Huang et al. 2015, Tang et al. 2013) India A non‑exhaustive summary of case studies reflecting these
and Pakistan (Döll et al. 2014, Rodell et al. 2009) the USA impacts is presented in Table 3. Some of these cases indi-
(Famiglietti 2014, Richey et al. 2015) Australia (Leblanc cate that bottled water companies operate in places where
et al. 2009, Richey et al. 2015) the Middle East and North communities are already suffering from drinking water
Africa (Joodaki et al. 2014, Voss et al. 2013), Sub‑Saharan shortages (Rosemann 2005, Hall and Lobina 2012). Other
Africa (Richey et al. 2015) and Central Mexico (Castellazzi cases report conflicts between local communities and
et al. 2016). In some of these regions, people rely entirely newly established bottled water plants and potential or
on groundwater (Gleeson et al. 2010, Konikow and Kend perceived adverse impacts on local water resources (Jaffee
2005, Walton, 2015). and Case 2018, Rosemann 2005).
Global Bottled Water Industry: A Review of Impacts and Trends 19Global Bottled Water Industry: A Review of Impacts and Trends
FIGURE 11. Groundwater depletion in large aquifers and river basins of the world between 2003 and 2016
Note: The unit mm/year for groundwater depletion represents the annual loss in the height of an imaginary water column per square meter.
Sources: Döll et al. 2014, Famiglietti 2014, Huang et al. 2015, Richey et al. 2015, Voss et al. 2013.
20TABLE 3. Case studies on water depletion caused by bottled water companies.
Company Location Period Impact References
Coca‑Cola India: 1989–2009 Decrease in groundwater level by 7.9 m Ghawana et al. 2011, Hall and Lobina
Mehdigani, during 11 years of bottling operations. 2012, Hassan 2016
Uttar Pradesh
Coca‑Cola India: 1990 –2010 Decrease in groundwater level 10 years after Hassan 2016, Hall and Lobina 2012,
Kala Dera, bottling operation from ‑3.94 to ‑25.3 m. Ghawana et al., 2011, Hall and Lobina,
Rajasthan 2012, Hassan, 2016
Coca‑Cola India: 1999–2004 Decrease in groundwater level from 45 to Aiyer 2007, Bijoy 2006, Carroll 2013,
Plachimada, 100 m. Groundwater turned brackish and Ghawana et al. 2011, Hall and Lobina
Kerala milky‑white due to limestone dissolution. 2012, Ravi Raman 2010, Shree 2010,
Soil and groundwater were contaminated Sitisarn 2012
by heavy metals such as lead, cadmium
and chrome due to bottling plants waste
sludge used as ‘free fertilizer’ that damaged
crops and caused health issues. Estimated
economic loss of $48 million.
Coca‑Cola Mexico: 1994– Coca‑Cola plant owns over 30% of water Pliego 2019, Pskowski 2017,
Chiapas present resources in Chiapas using over 1 million Vinci et al. 2018
liters of water/day (2016). Wells are drying
up and local communities do not have
access to safe drinking water and consume
soft drinks instead resulting in an increase
in diabetes and obesity.
Nestlé Pakistan: 1998–2003 306 million liters of water are Rosemann 2005
Karachi extracted annually.
Nestlé Pakistan: Early 2000s Decrease in groundwater level at an annual Winschewski 2017
Lahore decline of 1.4 m/ year. Rosemann, 2005
Nestlé Pakistan: 2003–2016 Decrease in groundwater level from 30 to Winschewski 2017
Bhati Dilwan 90-120 m leading to dried springs and Rosemann, 2005
village, depriving locals of accessible groundwater
Southern sources. Locals will end up consuming
Pakistan Nestlé’s bottled water (Pure Life) as
an alternative.
Nestlé USA: 2015 Extracted over 300 million liters from Gumbel, 2015
Sacramento, the aquifers in a drought year while
California water use restrictions were imposed on
local communities.
Nestlé Canada: 2016 Extraction of 1.6 million liters/day in Jaffee and Case 2018, Nestlé
Wellington addition to the 4,7 million liters/day Nestlé Waters Canada 2016
County, was already extracted in the region during
Ontario the 2016 drought year.
Not Nepal: 2003–2011 Extraction of up to 90 million liters in Shrestha et al. 2013
specified Jhaukhel 2010–2011 from 12 commercial wells.
Increased pumping depths from 3 to 7.6 m.
Groundwater drawdown varied from 0.5 to
1.9 m/year from 2003 to 2009.
Global Bottled Water Industry: A Review of Impacts and Trends 21Lack of national policies and norms for groundwater BOTTLED WATER AND
management (Allen et al. 200, Hassan 2016, Packialakshmi
PLASTIC POLLUTION
et al. 2011, Winschewski 2017) can result in significant
volumes of groundwater abstractions by bottled water Although water can be packaged in glass bottles, aluminum
companies without disclosing the volumes extracted or cans and carton boxes (Ghoshal 2019), plastic contain-
considering social and environmental impacts (Hall 2009, ers represent by far the most common packaging used
Jaffee and Newman 2013, Rooy 2002). The global expan- in the industry. Every minute, over 1,000,000 bottles are
sion of the industry over the last two decades has been too sold globally (Plastics Europe 2020, UNEP 2022) and with
fast for national legislation to be implemented effectively single‑use bottle disposal comes the question of plastic
(Hassan 2016, Rooy 2002). This has led to the current pollution. This leads to a major problem, as plastic materi-
lack of transparency and legal measures that would have als can take up to 1,000 years to degrade (Statista 2021c).
compelled bottled water companies to publicly disclose
the water volumes extracted and assess the environmental Today, about 400 million tons of plastic waste are produced
consequences of their activities. It would have given every year (UNEP 2022). The plastic used by the bottled
affected communities some leverage to hold companies water industry is mostly polyethylene terephthalate (PET),
accountable for adverse impacts on local groundwater which makes up 5.5% of this global plastic production
resources (Ghawana et al. 2011, Packialakshmi et al. 2011). (OECD 2022). PET is made from a thermoplastic polymer
Cases have been reported where these companies used originating from petroleum and when heated can be easily
expired permits or incorrect land‑use declarations which shaped into any form (Plastics Europe 2020). This contrib-
triggered public scandals (Ghawana et al. 2011, Gumbel uted to the surge of single‑use plastic bottle products. PET
2015, Sitisarn 2012, Wramner 2004), or when companies has been in use by the bottled water industry since the
faced accusations of water resources overexploitation 1990s, when Nestlé first introduced a plastic bottle (Gleick
(Brei 2018, Carroll 2013, Jaffee and Case 2018, Jithin 2016, 2010). Today, PET is the most widely used packaging
Shree 2010, Sitisarn 2012, Wramner 2004). material in the beverage industry (Aslani et al. 2021). Over
97% of bottled water containers are made of plastic and
Water withdrawals for bottled water affect small businesses, almost 80% of this plastic is PET (IBWA 2022a).
tourism, agriculture, and public water supply (Bierkens
and Wada 2019, Konikow and Kendy 2005). Uncontrolled The amount of PET waste generated by the bottled water
extraction of groundwater can disrupt local agricultural sector is not evident from existing public sources but can
production, thereby increasing the deficit of irrigation be estimated using more general data on global plastic
water or leading to natural ecosystem damage (Castellazzi production and use in main sectors (Johnstone and Serret
et al. 2016, Konikow 2011). It can also affect aquifer water 2012). In 2019, the bottled water sector used 35% of the
quality through the remobilization of minerals and pollut- globally produced PET bottles (Smirthers 2019, Statista
ants or groundwater salinization (Famiglietti 2014, Huang 2022a). This percentage does not change significantly over
et al. 2015, Rooy 2002). Recharging aquifers with untreated time. Related estimates suggest that 85% of the total PET
or insufficiently treated wastewater from a bottled water water bottles produced are subsequently disposed of in
plant can severely affect the suitability of groundwater as landfills or as unregulated waste (UNEP 2022). This sug-
a resource for drinking water and irrigation (Hassan 2016, gests that around 30% (or a factor of ~0.3) can be applied to
Packialakshmi et al. 2011, Sitisarn, 2012, Wramner 2004). the OECD (2022) annual data on PET packaging to estimate
bottled water PET waste. Figure 12 shows the result of this
While such impacts may be relatively small in global terms, estimation since the beginning of the century. It appears
at least at present, compared to other industries, local that the annual average amount of PET water bottle waste
impacts can be significant. The absence or weakness of over this period was around 18 million tons and the 2021
water regulations and policies in many countries, particu- amount already exceeds 25 million tonnes. Figure 12 also
larly in the Global South, increases the pressure on local shows some available estimates of the total number of PET
water resources with little or no contribution to sustain- bottles disposed of (Smithers 2019). The bulk of this PET
able long‑term drinking water provision. waste is produced in North America, China, and Europe
(OECD 2022).
22 Global Bottled Water Industry: A Review of Impacts and TrendsImpacts documented form of plastic debris in the ocean at present
(Lamichhane et al. 2022, Law and Thompson 2014).
As mentioned above, about 85% of all plastic bottles sold
become waste (UNEP 2022). Most of the marine plastic There are other hazardous substances released from plastic
debris originates from inland waste, with rivers acting as bottles. These are petroleum and toxic chemical deriva-
major transport pathways (Plastics Europe 2020). Plastic tives (Li et al. 2021) commonly known as persistent organic
pollution transported via rivers accounts for up to 70–80% pollutants (POPs) that are resistant to environmental
of the plastics in the marine environment (Li et al. 2016, degradation and spread through food chains. Examples
Ritchie 2021, Schmidt et al. 2017). of POPs include polychlorinated biphenyls (PCBs) and
dichlorodiphenyltrichloroethane (DDT), which can be
Macroplastics, of which PET makes up a part, comprise transferred to animal tissues by ingesting microplastics,
over 80% of the annual plastic pollution in the environment, especially in marine environments and contaminate animal
around 22 million tonnes in 2019 (OECD 2022). This also and human food chains (Rhodes 2018, Zhou et al. 2021).
contributes to sewage system blockages in cities and towns
and damages tourist and landscape values due to polluted Microplastics can also be vectors for other environmental pol-
rivers, lakes, and beaches (Nikiema and Asiedu 2022). PET, lutants such as polycyclic aromatic hydrocarbons (PAH) and
as most plastics, degrades into tiny invisible pieces, referred heavy metals (Cd, Pb, Cu, Zn, etc.) that can all be adsorbed
to as microplastics. PET “share” in microplastics is signifi- by a plastic surface, thus leading to the formation of plastic‑
cant (Lamichhane et al., 2022) and are the most abundantly pollutant mixtures in the environment (Li et al. 2021).
FIGURE 12. Time series of estimated global bottled water PET waste from 2000 to 2021.
Note: Dark bars show estimates of number of bottles disposed of.
Source: Smithers 2019
Global Bottled Water Industry: A Review of Impacts and Trends 23You can also read