National Integrated Water Resource Management Diagnostic Report Kiribati - Sustainable Integrated Water Resources and Wastewater Management in ...
←
→
Page content transcription
If your browser does not render page correctly, please read the page content below
Sustainable Integrated Water Resources and Wastewater
         Management in Pacific Island Countries

National Integrated Water Resource Management
                Diagnostic Report
                       Kiribati

             Published Date: November 2007
          Draft SOPAC Miscellaneous Report 638

                                                             1
SIWRWMPIC-National IWRM Diagnostic Report Republic of Kiribati

                                                      Acronyms

AIDAB               Australian International Development Assistance Bureau (now AusAID)
ADB                 Asian Development Bank
AGO                 Attorney General’s Office
ACIAR               Australian Centre for International Agricultural Research
AMAK                Kiribati Women’s Federation
AusAID              Australian Agency for International Development
CCA                 Climate Change Adaptation
CCST                Climate Change Study Team
CHARM               Comprehensive Hazard and Risk Management
CIRAD
DCC                 Development Coordinating Committee
EU                  European Union
ECD                 Environment and Conservation Division (within MELAD)
EHU                 Environmental Health Unit (within MHMS)
ENSO                El Niño- Southern Oscillation Index
EVI                 Environmental Vulnerability Index
GDP                 Gross Domestic Product
GEF                 Global Environment Facility
GOK                 Government of Kiribati
HSA                 Hot Spot Analysis
ICWM                Integrated Coastal and Watershed Management
IHP                 International Hydrological Programme (of UNESCO)
IWRM                Integrated Water Resource and Sanitation Management
KANGO               The Kiribati Association of NGOs
KAP                 Kiribati Adaptation Program (Phases I, II & III)
KL                  Kilolitre ( = 1 m3)
KWASP               Kiritimati Water Supply and Sanitation Project
MABS                Multi-Agent Based Simulation
MCTTD               Ministry of Communications, Transport and Tourism Development
MELAD               Ministry of Environment, Land, and Agricultural Development
MEYSD               Ministry of Education Youth and Sport Development
MFED                Ministry of Finance and Economic Development
MFMRD               Ministry of Fisheries and Marine Resources Development
MHMS                Ministry of Health and Medical Services
MISA                Ministry of Internal and Social Affairs
MLPID               Ministry of Line and Phoenix Island Development
MPWU                Ministry of Public Works and Utilities
MO                  Meteorology Office (within MCTTD)
MPWU                Ministry of Public Works and Utilities
NAPA                National Adaptation Plan of Action
NCC                 National Council of Churches
NASC                National Adaptation Steering Committee
NEP                 National Economic Planning (within MFEP)
NGO                 Non-government organisation
NZAID               New Zealand International Aid and Development Agency
NSPRAU              National Strategic Policy and Risk Assessment Unit (within OB)
NWSCC               National Water and Sanitation Coordination Committee
OB                  Office Te Beretitenti (the President)
OFM                 Oceanic Fisheries Management
OICWSP              Outer Island Community Water Supply Project
PfWG                Pacific Water Governance

                                                                                          2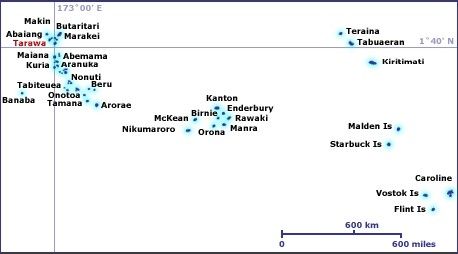
SIWRWMPIC-National IWRM Diagnostic Report Republic of Kiribati

PIC                 Pacific Island Country
PUB                 Public Utilities Board (within MPWU)
PVC                 Poly vinyl chloride
PWD                 Public Works Division (within MLPID)
RAP                 The Pacific Regional Action Plan for Sustainable Water Management
RPU                 Rural Planning Unit (within MISA)
SAP                 The Strategic Action Programme, International Waters of the Pacific Small
                    Island Developing States
SAPHE               Sanitation, Public Health and Environment Improvement Project
SIDS                Small Island Developing States
SIWRWMPIC           Sustainable Integrated Water Resources and Wastewater Management in
                    Pacific Island Countries
SOI                 Southern Oscillation Index
SOPAC               Pacific Islands Applied Geoscience Commission
SPC                 Secretariat of the Pacific Community
UNCDF               United Nations Capital Development Fund
UNDP                United Nations Development Program
UNDTCD              United Nations Department of Technical Cooperation for Development
UNDESA              United Nations Department of Economic and Social Affairs
UNEP                United Nations Environment Program
UNESCO              United Nations Educational, Scientific and Cultural Organization
UPR                 Uniform price rebate
WEU                 Water Engineering Unit (within MPWU)
WHO                 World Health Organization
WUE                 Water Use Efficiency

                                                                                                3
Protecting groundwater sources Impact assessment
Water conservation Climate change impacts
Land use guidelines Sustainability
Environment
Environment
Economy Health
Development Health education
opportunities Microbial monitoring
Job creation Sanitation and water
Cost recovery quality guidelines
Reinvestment
Community Infrastructure
Demand Reticulation systems Groundwater galleries
Water conservation Rainwater harvesting Safe wells
Health and hygiene Sewerage systems Appropriate sanitation
Land use practices Solid waste disposal Resource monitoring
Participation
Interdependencies in the water and sanitation sector in Kiribati
4SIWRWMPIC- National IWRM Diagnostic Report Kiribati
TABLE OF CONTENTS
Executive Summary......................................................................................................................... 8
Acknowledgements........................................................................................................................ 10
1. Introduction.................................................................................................................................11
1.1 Sustainable integrated water resources and wastewater management in Pacific Island
countries....................................................................................................................................... 11
1.2 Linkage with the Pacific Regional Action Plan on Sustainable Water Resource Management
...................................................................................................................................................... 12
1.3 Aim of the SIWRWMPIC...................................................................................................... 13
1.4 Scope of this Report............................................................................................................... 13
2. General overview....................................................................................................................... 15
2.1 Country Background Information.......................................................................................... 15
2.1.1 Location, distribution and topography........................................................................15
2.1.2 Climate, soils, hydrogeology, vegetation and agriculture...........................................17
2.1.3 Demography and socio-economic aspects.................................................................. 21
3. Integrated water resources management for Kiribati................................................................. 25
3.1. Water resources management................................................................................................25
3.1.1 Sources of freshwater..................................................................................................25
3.1.2 Types of freshwater use.............................................................................................. 26
3.1.3 Major issues and concerns.......................................................................................... 27
3.1.3.1 Provision of adequate water for human health and community development.........27
3.1.4 Provision of equitable access to safe water.................................................................29
3.1.5 Protection of water sources.........................................................................................30
3.1.6 Provision of appropriate sanitation............................................................................. 30
3.1.7 Impact of droughts on water supplies......................................................................... 31
3.1.8 Impact of sea level rise on water resources................................................................ 31
3.1.9 Provision of sustainable water supply and sanitation systems....................................31
3.1.10 Ensuring groundwater supply systems do not compromise rights or livelihoods ... 32
3.1.11 Improvement in water governance, capacity building and maintenance of skills.... 32
3.1.12 Improvement in knowledge and monitoring.............................................................33
3.3.13 Land and water ownership in water source areas and common perceptions............ 33
3.1.4 Methods to manage impacts and concerns (IWRM)...................................................33
3.1.5 National Water and Sanitation Coordination Committee........................................... 34
3.1.6. Water resources assessment and monitoring............................................................. 35
3.1.7. Conservation and reuse.............................................................................................. 35
3.1.8 Protection of water reserves........................................................................................36
3.1.9 Managing the impact of drought.................................................................................37
3.2. Island vulnerability................................................................................................................37
3.2.1 Types of disasters........................................................................................................37
3.2.2 Major issues and concerns.......................................................................................... 39
3.2.3 Methods to manage impacts and concerns (IWRM)...................................................39
3.3 Awareness and community participation............................................................................... 42
3.3.1 Awareness campaigns, consultation and participation............................................... 42
3.3.2 Major issues and concerns ......................................................................................... 44
3.3.3 Methods to manage impacts and concerns (IWRM)...................................................45
5SIWRWMPIC- National IWRM Diagnostic Report Kiribati
3.4. Technology............................................................................................................................ 45
3.4.1 Types of water supply systems................................................................................... 45
3.4.2 Types of wastewater/sanitation systems..................................................................... 49
3.4.3 Major issues and concerns ......................................................................................... 51
3.4.4 Methods to manage impacts and concerns (IWRM)...................................................52
3.5 Institutional Arrangements..................................................................................................... 52
3.5.1 Types of institutional arrangements............................................................................52
3.5.2 Major issues and concerns.......................................................................................... 60
3.5.3 Measures to manage issues and concerns (IWRM approaches)................................. 60
3.6. Financing............................................................................................................................... 61
3.6.1 Types of financing arrangements................................................................................61
3.6.2 Major issues and concerns.......................................................................................... 65
3.6.3 Measures to manage issues and concerns (IWRM approaches)................................. 66
4. Linkages with other sectors........................................................................................................67
4.1. Landuse and Agriculture....................................................................................................... 67
4.1.1 Groundwater reserves and customary land use...........................................................67
4.1.2 Impacts of traditional crops and livestock.................................................................. 67
4.1.3 Impacts of water extraction on traditional crops.........................................................68
4.1.4 Impacts of urban areas................................................................................................ 68
4.2. Habitats and ecosystems........................................................................................................68
4.3. Health and hygiene................................................................................................................ 69
4.4. Watershed and coastal management......................................................................................69
5. Stakeholder engagement........................................................................................................... 70
6 Other programmes, projects and activities related to IWRM.......................................................72
6.1 Millennium Development targets........................................................................................... 72
6.2 Pacific Regional Action Plan for Sustainable Water Management........................................72
6.3 Kiribati Adaptation Program (KAP)...................................................................................... 73
6.4 Revised Draft National Water and Sanitation Policy and Plan.............................................. 73
7. Capacity development needs for removing the barriers.............................................................74
7.1 Geographic spread of islands and villages............................................................................. 74
7.2 Policy and planning development ......................................................................................... 74
7.3 Inter- Ministry collaboration and community participation................................................... 74
7.4 Water resource assessment, monitoring, analysis and reporting............................................ 74
7.5 Health impacts of contaminated water................................................................................... 74
7.6 Protection of groundwater sources......................................................................................... 74
7.7 Rainwater harvesting.............................................................................................................. 75
7.8 Improved urban sanitation......................................................................................................75
8.1 National Water and Sanitation Coordination Committee.......................................................76
8.2 National Water Policy, plans and legislation......................................................................... 76
8.3 Sustainable water supply and sanitation systems................................................................... 76
8.4 Capacity building in water resource assessment, monitoring, analysis and reporting........... 76
8.5 Community participation........................................................................................................76
8.6 Protecting groundwater sources............................................................................................. 77
8.7 Rainwater harvesting.............................................................................................................. 77
8.8 Provision of new safe, groundwater sources for South Tarawa............................................. 77
8.9 Emphasis on alternate development centres...........................................................................77
6SIWRWMPIC- National IWRM Diagnostic Report Kiribati
9. References................................................................................................................................. 79
LIST OF TABLE AND FIGURES
List of Tables
Table 1: Summary of some of the key features of the Republic of Kiribati.................................... 16
Table 2: Mean annual rainfalls and coefficients of variability in Kiribati........................................ 20
Table 3: Island populations of Kiribati 2005................................................................................... 22
Table 4: Estimated sustainable groundwater yield and maximum population sustained by
groundwater assuming a demand of 100 L/person/day................................................................. 28
Table 5: Water resources related projects in component 3 of KAPII............................................. 41
Table 6: Household connections to the reticulated water system in South Tarawa.......................47
Table 7. Planned outcomes of draft national water resources policy implementation................... 59
Table 8: Water supply assets and their replacement value for South Tarawa...............................61
Table 9: Water supply assets and their replacement value for Kiritimati...................................... 62
Table 10: Sewerage system assets and their replacement value for South Tarawa..................... 62
Table 11: Proposed tiered water charges for private and industrial water users in South Tarawa63
Table 12: Incidence of Diarrhoea and Dysentery at Health Clinics in Kiribati................................ 69
List of Figures
Figure 1. Location of the Republic of Kiribati in the central Pacific................................................ 15
Figure 2: Three main island groups of the Republic of Kiribati...................................................... 19
Figure 3: Tarawa Atoll, Bonriki in the southeast to Betio in the southwest.................................... 19
Figure 4: Correlation between annual rainfall in South Tarawa and the 12 month Nino 3.4 sea
surface temperature anomaly........................................................................................................ 20
Figure 5: Population increase in Kiribati, rural outer islands, and urban South Tarawa................ 22
Figure 6: Infant (SIWRWMPIC- National IWRM Diagnostic Report Kiribati
Executive Summary
Small island nations in the Pacific face water supply and sanitation problems amongst the most
critical in the world. This is especially so in the Republic of Kiribati where shallow, fresh
groundwater is the major source of water. It is extremely vulnerable to natural and human-
induced changes. Storm surges, droughts and over-extraction cause seawater intrusion.
Settlements and agricultural activities can extremely rapidly pollute the shallow groundwater. The
incidence of illnesses and deaths from water-borne diseases, especially amongst children, are
unacceptably large.
Limited land areas in small islands restrict freshwater quantities, which are especially vulnerable
during frequent, severe ENSO-related droughts. The threat of sea level rise due to global
warming is also a major concern. Demand for freshwater is increasing due to population growth
and to urbanisation, both of which impact also on water quality. Water use for traditional crops
often competes with water supplies for communities and the fertilisation of crops and the raising
of domestic animals, particularly pigs, contribute to groundwater pollution.
Human and financial resources are limited and the problem of equitably treating both urban and
small, numerous and widely dispersed rural outer island villages across three million km 2 of the
central and western Pacific is complex and difficult. Land ownership, which carries with it
traditional subsistence and resource rights, is essential for survival, even in urban areas. Land is
of high value and carries with it social, political and legal significance (Talu et al. 1979). This
presents problems in the declaration of groundwater reserves over private lands. Culturally, water
ownership remains a contentious issue. The absence of Government-approved unified, national
water policy, plans, and legislation compounds difficulties. In addition, government agencies tend
to operate independently so that collaboration on water and sanitation issues is currently minimal.
Numerous studies, reports and national consultations have identified the key priorities in Kiribati.
The key challenges in the water resource sector are: limited freshwater resources; sustainability
of water harvesting; impacts of settlement and land use on water quality; fragmented control,
management and protection of water resources; increasing demands for water resources;
insufficient knowledge and understanding of water resources nationwide; social and
environmental impacts of water abstraction proposals; land ownership in water reserves; limited
use of rainwater harvesting; lack of community understanding and appreciation of responsible
water management; lack of conservation incentives; limited community involvement in water
resource management and protection; impacts of human waste; lack of national water policy and
legislation; impacts of droughts and storm surges on groundwater; and predicted impacts of
climate change.
In the water and sanitation services sector the challenges are: highly variable and inadequate
levels of service; high levels of leakage and unaccounted for water loss at household levels; low
levels of cost recovery and non-financially viable operations; increasing water demand and
usage; limited available and relevant technical skills and capacity; insufficient knowledge and
understanding for planning and management; inadequate attention paid to wastewater disposal
and sanitation; inadequate appreciation of responsible water management and use by
communities; limited community involvement in water service planning, management and
delivery; uncoordinated development across sectors; deteriorating water quality and quantity at
supply sources; inappropriate land use in water reserves; and in rural areas, lack of safe water
supplies and sanitation.
This Diagnostic Report builds on these previous detailed analyses and priorities and presents
strategies that will improve integrated water resource and sanitation management and move
toward sustainability: these include formation of the whole-of-government National Water and
Sanitation Coordination Committee; development and approval of a National Water Policy, plans
and legislation; a move to sustainable water supply and sanitation systems; capacity building in
8SIWRWMPIC- National IWRM Diagnostic Report Kiribati
water resource assessment, monitoring, analysis and reporting, improved community
participation; better protection of groundwater sources, increased rainwater harvesting and in the
provision of new, safe freshwater sources for South Tarawa. The demonstration concept project
based on these strategies will serve as a model for the protection of freshwater sources in North
Tarawa, designated development centres in other atolls and outer islands.
9ACKNOWLEDGEMENTS
This diagnostic report was prepared under the guidance of the recently-convened whole-of-
government National Water and Sanitation Coordination Committee (NWSCC), members of
whom provided relevant information. It was drafted by Taboia Metutera, Public Utilities Board,
Ministry of Public Works and Utilities, Tony Falkland, private consultant and Ian White of the
Australian National University. The Water Engineering Unit, Ministry of Public Works and Utilities
was designated by Cabinet as the lead agency for IWRM. The assistance of Mourongo Katatia of
the Water Engineering Unit and members of the reactivated National Water and Sanitation
Coordinating Committee and SOPAC in the facilitation and preparation of this report are gratefully
acknowledged. And last, but not the least, the guidance and mentoring role of the Permanent
Secretary of the Ministry of Public Works and Utilities and Chairperson of the NWSCC; Ms. Reina
Timau, during the preparation of this report, is gratefully acknowledged.
10SIWRWMPIC- National IWRM Diagnostic Report Kiribati
1. Introduction
The increased focus on integrated water resources management (IWRM) in recent years reflects
the growing consensus that access to adequate supplies of potable water is essential in
addressing the challenges of sustainable livelihoods and development. IWRM helps to protect the
environment, promote democratic participation in governance, ensures the equitable distribution
of water for human and biodiversity and improves health. Water policy and management are
beginning to reflect the fundamentally interconnected nature of hydrological resources, and IWRM
is emerging as an accepted alternative to sector-by-sector, top down management style that has
dominated in the past. This report uses an IWRM approach to examine water and sanitation in
the Pacific island nation of the Republic of Kiribati.
Despite often relatively high rainfalls, small island nations in the Pacific have water supply
problems amongst the most critical in the world. Many have very limited surface runoff so that
shallow, fresh groundwater is the major source of water in many atolls. Shallow groundwater is
especially vulnerable to natural and human-induced changes. Storm surges, droughts and over-
extraction cause seawater intrusion. Settlements and agricultural activities can extremely rapidly
pollute the shallow groundwater. The incidences of illnesses and deaths from water-borne
diseases are unacceptably large. Limited land areas in small islands also restrict freshwater
quantities, which are especially vulnerable during frequent El Niño Southern Oscillation (ENSO)
related droughts when stored rainwater is quickly exhausted.
Demand for freshwater in Pacific Island countries (PICs) is increasing due to population growth
and urbanisation, both of which impact water quality. Water use for traditional crops often
competes with water supplies for communities and the fertilisation of crops and the raising of
domestic animals, particularly pigs, contribute to groundwater pollution. Human and financial
resources are limited and the problem of equitably treating both urban and often small, numerous
and widely dispersed rural settlements is complex and difficult. Culturally, water ownership
remains a contentious issue. In addition, small island developing states are also subject to the
often short time scales and external priorities of aid and donor organisations, which sometimes
divert efforts from national priorities.
All these problems are exemplified in the Republic of Kiribati whose population is spread amongst
167 rural villages and one urban area in 21 islands and atolls across over 3 million km 2 of the
central and western Pacific. This Diagnostic Report details the freshwater and wastewater
situation in the Republic of Kiribati.
1.1 Sustainable integrated water resources and wastewater management in Pacific
Island countries
The Sustainable Integrated Water Resources and Wastewater Management in Pacific Island
Countries (SIWRWMPIC) proposal coordinated by SOPAC evolved from the Strategic Action
Programme (SAP) for the International Waters of the Pacific Small Island Developing States
carried out in August 1997. The SAP identifies the priority concerns, imminent threats and root
causes, and provides solutions and the proposed activity areas to implement those solutions. The
goal of this SAP was to develop a strategy for the integrated sustainable development and
management of International Waters in the region. The priority transboundary concerns for Pacific
Island International Waters were defined as arising from imminent threats to the health of those
waters:
1. Pollution of marine and freshwater (including groundwater) from land-based activities
2. Physical, ecological and hydrological modification of critical habitats
3. Unsustainable exploitation of living and nonliving resources.
11SIWRWMPIC- National IWRM Diagnostic Report Kiribati
The root causes of these threats lie within management and institutional deficiencies, particularly
those of a lack of effective governance, as well as the lack of information and understanding at all
levels together with a narrow sectoral focus. The SAP provides the regional framework within
which actions are identified, developed and implemented. Targeted actions within the SAP are
envisaged in two complementary, linked consultative contexts: Integrated Coastal and Watershed
Management (ICWM) and Oceanic Fisheries Management (OFM). Through the ICWM and OFM
approaches, the SAP sets out a path for the transition of the Pacific islands from sectoral to
integrated management of International Waters as a whole. The regional SIWRWMPIC proposal
is addressed specifically to the Integrated Coastal and Watershed Management context. It is
noted here that, for low coral islands, the watershed, being the land area that contributes to the
recharge of fresh groundwater, is generally the entire island.
1.2 Linkage with the Pacific Regional Action Plan on Sustainable Water Resource
Management
The regional SIWRWMPIC assists Pacific small island developing states (SIDS) to implement the
Pacific Regional Action Plan (RAP) (SOPAC and ADB 2003). The Pacific RAP on sustainable
water management articulates the Pacific’s position on water resources management and was
endorsed by all Pacific countries in 2003 at Pacific Ministerial and Heads of State level meeting in
Auckland, New Zealand. The Pacific RAP on sustainable water management aims to improve the
assessment and monitoring of water resources, to reduce water pollution, improve access to
technologies, strengthen institutional arrangements, and leverage additional financial resources in
support of IWRM and is structured around six thematic areas. Each theme section consists of key
messages to stakeholders with supporting statements drawn from the discussions of the
respective working groups at the High–Level Consultation in Sigatoka Fiji in 2002 as a precursor
to the Third World Water Forum held in Kyoto in March 2003. The six thematic areas in the RAP
are:
1. Water resources management
2. Island vulnerability
3. Awareness
4. Technology
5. Institutional arrangements
6. Finance
The Pacific RAP provides a framework for small island nations and calls for:
1. National water sector assessments
2. Broadly-based national water vision
3. National water action agenda and plans
4. Empowerment of communities
5. Design of capable institutions
6. Integrated investment plans
7. Regional support
8. Dialogue with investors and donors
The Pacific RAP was also submitted as a Type 2 Partnership Initiative on Water, Sanitation and
Hygiene to the Commission for Sustainable Development in Johannesburg during the World
Summit on Sustainable Development in August 2002 and announced at the Third World Water
12SIWRWMPIC- National IWRM Diagnostic Report Kiribati
Forum (WWF) in Kyoto, Japan in March 2003. This Partnership initiative has since evolved into
the Pacific Partnership Initiative on Sustainable Water Management with the support from the
Asian Development Bank (ADB) and is the implementation vehicle for the regional SIWRWMPIC
through the linkages between its many small island partners.
1.3 Aim of the SIWRWMPIC
The overall aim of the regional SIWRWMPIC is to assist Pacific Island Countries achieve
sustainable, equitable, safe and efficient management of water resources and wastewater
through Integrated Water Resource and Sanitation Management (IWRM) and Water Use
Efficiency (WUE) plans based on regionally-appropriate best practices and demonstrations of
barrier removal.
1.4 Scope of this Report
This report provides general background information on the Republic of Kiribati and analyses the
current but evolving state of integrated water resource and sanitation management within the
country under the six themes of the RAP. It details the intimate links between other sectors,
especially human health, the engagement with stakeholders, other activities related to IWRM,
capacity development and resource needs for removing barriers to implementation of IWRM. The
report draws heavily on the plethora of reports and publications that are available for Kiribati and
the Government of Kiribati (GOK) policy initiatives over the past 20 years. These have
established a clearly enunciated, long-term roadmap for water and wastewater management and
use in the country.
This report explicitly recognises the direction provided by the overall policy aim of the Kiribati
Draft National Water Resources Policy: “To ensure that communities have affordable access to
sustainable water supply systems providing water of suitable quality and appropriate quantities
and to appropriate sanitation to meet all reasonable health, environmental, and development
needs.”
Its specific policy objectives are to:
1. Improve the safety of freshwater supplied from groundwater and rainwater systems.
2. Protect fresh groundwater resources from adverse human impacts.
3. Sustainably manage all aspects of the use and conservation of freshwater.
4. Improve knowledge of the quality and quantity of the nation’s freshwater resources and
demand for them.
5. Improve knowledge and management of water resources under climatic extremes and
change.
6. Improve outer island water supplies.
7. Increase community awareness and understanding of water resource and sanitation
issues.
8. Increase community participation in water resource and sanitation management.
9. Increase the use of rainwater harvesting.
10. Develop instruments to help manage demand and allocation of water.
11. Review and revise, where necessary, all legislation, regulations and organisational
responsibilities relevant to water and sanitation.
12. Ensure that people working in the water and sanitation sector have appropriate
13SIWRWMPIC- National IWRM Diagnostic Report Kiribati
knowledge and skills.
13. Ensure an adequate supply of trained personnel for the water and sanitation sector.
14. Ensure cost effective planning, operation and maintenance of water supply and
sanitation systems.
While water for traditional subsistence crops and providing for the near-shore environment are
important, it is clear from these and goals that the provision of adequate, sustainable safe water
supplies to ensure human health and wellbeing is the overwhelming priority in Kiribati.
14SIWRWMPIC- National IWRM Diagnostic Report Kiribati
2. General overview
2.1 Country Background Information
2.1.1 Location, distribution and topography
The Republic of Kiribati became an independence sovereign state, after decades of British
colonial rule, on 12th July 1979. It lies in the central and western Pacific between 4° N and 3° S
and 172° E and 157°W (see Figure 1). The nation consists of 32 low-lying coral islands and one
raised coral island in three main island groups, the Gilberts, Phoenix and Line Islands, (see
Figure 2) scattered over three million km2 of the central and western Pacific. Eleven of these
islands are currently unoccupied. Most islands are usually not more than 2 km wide, and, except
for the raised island of Banaba, are not more than 6 m above sea level. Banaba, a former
phosphate island, rises to 81 m above mean sea level. Total land area is estimated to be 811
km2. The Gilbert group contains 90.5% of the country’s population and has a land area of 286
km2.
Figure 1. Location of the Republic of Kiribati in the central Pacific.
Source:
The capital, South Tarawa located in Tarawa atoll (see Figure 3) in the Gilberts, is highly
15SIWRWMPIC- National IWRM Diagnostic Report Kiribati
urbanised and has 43.5% of the nation’s population. Key national statistics are listed in Table 1.
Of particular note is the limited land area which constrains water supply options. The quantity and
quality of freshwater available to island communities is partly known in only two atolls (ADB
2004), Tarawa in the Gilberts and Kiritimati in the Line Islands. South Tarawa has three main
centres, Betio, Bairiki and Bikenibeu although the population is spread out over 35 km from
Bonriki to Betio which follows the main road. North Tarawa is not connected by road to South
Tarawa and remains rural with a population of less than 6,000 spread over the 43 km from Buariki
to Buota. Mean tidal range in Tarawa is 2.2 m.
Total land area of the eight islands in the Phoenix Group some 1750 km east of Tarawa, is 28.6
km2. Its only inhabited island is Kanton (Canton) with land area of 9 km 2. The Line Group also has
eight islands with land area of 496 km2, extending over a north-south line 2,100 km long, lying
between 3,280 and 4,210 km east of Tarawa, and beginning 800 km south of Hawaii. This Group
has 9.5% of the country’s population and the largest island in Kiribati, and the largest atoll in the
world, Kiritimati Island, a designated growth centre, with an area of 388 km2. Kiritimati was used
for atmospheric nuclear testing during the post war period as a British colony.
Table 1: Summary of some of the key features of the Republic of Kiribati
Property Value
Geographic location1 between 4° N and 3° S, and 172° E to 157° W
1
Composition 32 coral atolls, 1 raised coral island (Banaba)
Land area (km2) 1 811
Ocean area (km2) 3,000,000
1
Length of coast (km) 1,143
Length of coast/land area (km-1) 1 1.41
1
Highest elevation (m above mean sea level) 81 (Banaba)
Fraction of land elevation < 10 m above msl 99
(%)2
Climate 1 Tropical
Cyclones No
4
Mean annual rainfall (P mm) 2048 (Tarawa)
Coefficient of variation annual rainfall (CV,%) 3 48 (Tarawa)
3
Annual potential evaporation (E mm) 1795 (Tarawa)
Mean annual Aridity ratio = E/P 0.88 (Tarawa)
4
Principal water sources Reticulated groundwater (South Tarawa,
Kiritimati)
Private groundwater wells
Public groundwater wells & galleries (outer
islands)
Private rainwater tanks
Desalination*
Seawater (washing, toilet flushing)
16SIWRWMPIC- National IWRM Diagnostic Report Kiribati
Estimated per capita demand freshwater 50 (Tarawa)
(L/cap/day) 4
Estimated sustainable yield safe freshwater 49 (Tarawa reticulation system)‡
(L/cap/day) 5
Agencies responsible for water supply PUB (South Tarawa)
MPWU (outer islands)
Households
1
Population 92,428 (2005)7
Population growth rate (%) 1 1.8 (2005)7
Mean population density (cap/km2) 127
Maximum population density (cap/km2) 15,637 (Betio, Tarawa)
GDP/capita US$1,9001
Environmental Vulnerability Index (EVI)2 3.70
6
EVI ranking (out of 235 countries) 34/235
1
CIA World Factbook (2005)
2
Pratt and Mitchell (2003)
3
Falkland and Woodroffe (1997)
4
Fakland (2005)
5
Alam et al.(2002)
6
Kaly et al. (2003)
7
Preliminary results 2005 census
*
Desalination plants are currently inoperative.
†
Assumes no losses from reticulation system
‡
Excludes use of private wells or raintanks
2.1.2 Climate, soils, hydrogeology, vegetation and agriculture
The climate of Kiribati is tropical. Weather is controlled by the seasonal movements and annual
variations of the Inter-tropical Convergence Zone and the Equatorial Doldrum Belt (Falkland
1992). The nation spans across 3,500 km of the equator and rainfall is strongly correlated with
position of the Pacific warm pool (Falkland 1992, 2005). Average annual rainfall in the Gilberts
ranges from 1,300 mm south of the equator to 2,000 mm on Tarawa, and over 3,200 mm in the
northernmost islands, while it is less than 1,000 mm in Kiritimati in the eastern Line Islands. There
are no rainfall measurements for nine atolls. Annual rainfall is highly variable with coefficients of
variability as high as 74% in the Gilbert Islands, 80% in the Phoenix Islands and 91% in the Line
Islands (ADB 2004). Table 2 summarises the known and estimated island rainfalls and their
coefficients of variability. Figure 4 shows the strong correlation between rainfall in South Tarawa
and the sea surface temperature anomaly in the Nino 3.4 central Pacific region. Long and severe
droughts of up to 16 months, highly correlated to ENSO events, are common with an average
frequency of 6 to 7 years (White et al. 1999a).
The soils of the low coral islands consist of unconsolidated Holocene coral sands and gravels
overlying Pleistocene karst limestone. The hydraulic conductivity of the surface sediments is
much higher than rainfall rates so that surface ponding occurs rarely (Wheatcraft and Buddemeier
1981) and usually close surrounding relatively impermeable surfaces such as roadways and
runways. This means that there are no perennial surface streams in Kiribati. The large hydraulic
conductivity also means that surface contaminants are quickly transported into shallow
groundwater and that the soils are generally infertile. The islands are mainly covered with coconut
17SIWRWMPIC- National IWRM Diagnostic Report Kiribati
and pandanus palms. The mining of phosphate has left the surface of Banaba in a generally
barren state although small pockets of fertile soils remain.
18SIWRWMPIC- National IWRM Diagnostic Report Kiribati
Figure 2: Three main island groups of the Republic of Kiribati
Kiritimati
Tarawa Atoll
Gilbert
Phoenix
Line
Source:
Figure 3: Tarawa Atoll, Bonriki in the southeast to Betio in the southwest
Source:
19SIWRWMPIC- National IWRM Diagnostic Report Kiribati
Figure 4: Correlation between annual rainfall in South Tarawa and the 12 month Nino 3.4
sea surface temperature anomaly
5,000 2.5
12 mth Nino 3.4 SST anom
4,500 Rain
2.0
4,000 Nino 3.4
12 mth Rain (mm)
1.5
3,500 1.0
3,000
0.5
2,500
0.0
2,000
-0.5
1,500
1,000 -1.0
500 -1.5
0 -2.0
Jan-82
Jan-50
Jan-54
Jan-58
Jan-62
Jan-66
Jan-70
Jan-74
Jan-78
Jan-86
Jan-90
Jan-94
Jan-98
Jan-02
Source: White et al. 1999
The generally poor atoll soil offers little potential for agricultural development apart from the major
agricultural export crop, copra, which is harvested as coconuts from abundant coconut trees and
processed locally. Seaweed is also grown in the Gilbert and Line Islands and exported. The vast
fishing waters around the islands of Kiribati are renowned for their fish which are one of the
principal sources of protein for the country and a major source of external revenue. The other
main protein sources are pigs and chickens and it has been estimated that Kiribati has on
average 2.5 pigs and 4 chickens per household (Saville and Manueli 2002).
Table 2: Mean annual rainfalls and coefficients of variability in Kiribati
Atoll/Island Island Annual Rainfall Coefficient of
Group (mm) Variability
Banaba Gilbert 1,847 0.60
Makin 2,821 0.37
Butaritari 3,107 0.29
Marakei 2,053 0.45
Abaiang 2,158 0.41
Tarawa (North) 1,949 0.50
Tarawa (South) 1,949 0.49
Maiana 1,543 0.55
Abemama 1,518 0.49
Kuria 1,518 0.64
Aranuka 1,518 0.67
Nonouti 1,507 0.65
20SIWRWMPIC- National IWRM Diagnostic Report Kiribati
Tabiteuea (North) 1,418 0.59
Tabiteuea (South) 1,418 0.74
Beru 1,355 0.57
Nikunau 1,242 0.63
Onotoa 1,230 0.59
Tamana 1,425 0.65
Arorae 1,826 0.51
Kanton Phoenix 958 0.80
Orona (Hull) 1171 0.60
Enderbury 1000
Birnie 1000
Rawaki (Phoenix) 1000
Manra (Sydney) 1000
Mackean 1000
Nikumaroro (Gardner) 1319 0.57
Teraina (Washington) Line 3,021 0.36
Tabuaeran (Fanning) 2,107 0.43
Kiritimati (Christmas) 974 0.75
Malden 676 0.91
Starbuck 700
Vostock 800
Millennium (Caroline) 900
Flint 1,000
Source: ADB. 2004. Sectoral Strategy and Action Program. Promotion of Effective Water
Management Policies and Practices
Shaded rainfalls in italics for uninhabited atolls in Table 2 are estimated.
A relatively small amount of fish is also farmed from ponds in South Tarawa. In Kiritimati in the
Lines group, a large amount of milk fish is farmed with a potential market in Honolulu. Small
family-owned market gardens produce fruit and vegetables for local markets and fruit, particularly
bananas are grown in the wetter northern islands of the Gilberts for inter-island trade mainly to
South Tarawa. Compost, mostly with a substantial component of pig manure, is used to enrich
the soil in market gardens. Banaba has the potential to grow crops for inter-island markets
because of pockets of phosphate-rich soils but fresh water limitations and transport remain
barriers to this.
2.1.3 Demography and socio-economic aspects
The population of Kiribati is generally drawn from one ethic group and speaks a common
language, I-Kiribati, The 2005 census estimates that there were 92,428 people in Kiribati spread
over 21 atolls and one raised coral island. These live in a total of 14,172 households in 185
villages (2005 census). Table 3 details the island populations at the 2005 census. The country’s
population has grown approximately exponentially at a rate of 1.8% per annum since 1963 (see
21SIWRWMPIC- National IWRM Diagnostic Report Kiribati
Figure 5). The rural population is scattered throughout 8,932 households in 169 villages in outer
islands and North Tarawa with an average size of less than 50 households per village and an
average of 5.8 people per household. In general, outer island communities live under subsistence
conditions.
Figure 5: Population increase in Kiribati, rural outer islands, and urban South Tarawa
100,000
90,000 South Tarawa
80,000 Outer Islands
Total Kiribati
70,000
Population
60,000
50,000
40,000
30,000
20,000
10,000
-
1910 1930 1950 1970 1990 2010
Year
Source: Government of Kiribati 2005
The highly urbanised and densely settled South Tarawa has a population of 40,212 in 5,240
households with an average of 7.7 people per household. Island population densities in the main
port of Betio exceed 15,000 people/km2. The exponential growth rate of the urban South Tarawa
population since 1963 is 4% while that for rural outer islands is 0.9%. This inward migration from
rural areas to urban centres is common throughout Pacific Island countries (Ward 1999).
The Government of Kiribati has recognised that continued urbanisation of South Tarawa poses
significant risks and in the early 1990’s identified four alternate growth centres in Beru, Butaritari,
and Tabiteuea North in the Gilberts and Kiritimati in the Line islands. Apart from Kiritimati in the Line
Islands, these growth centres remain to be developed. The problem of equitably supporting a low
density, dispersed rural population and one high density urban centre spread across such a large
area of the central Pacific is a major challenge for the government.
The country earns export income from the sale of fishing rights in its extensive national waters,
from the export of copra and seaweed and from remittances from overseas I-Kiribati, especially
seamen working in merchant ships. Overseas income is also earned from selling fishing licences
to other nations. Revenue from fishing licenses amounted to about 23% of Gross National
Product in 2001-2002.
Table 3: Island populations of Kiribati 2005
Island No. of Distance
Atoll/Island Group Villages from Persons Households Cap/Households
Tarawa
(km)
Banaba Gilbert 3 450 301 61 4.9
22SIWRWMPIC- National IWRM Diagnostic Report Kiribati
Makin 2 190 2388 328 7.3
Butaritari 11 173 3267 564 5.8
Marakei 8 82 2738 437 6.3
Abaiang 18 51 5478 806 6.8
Tarawa (North) 15 0 5704 898 6.4
Tarawa (South) 16 0 40212 5240 7.7
Maiana 12 45 1909 354 5.4
Abemama 14 152 3398 592 5.7
Kuria 5 134 1081 202 5.4
Aranuka 3 146 1158 227 5.1
Nonouti 9 266 3176 568 5.6
Tabiteuea (North) 13 294 3603 606 5.9
Tabiteuea (South) 6 294 1306 251 5.2
Beru 10 403 2238 462 4.8
Nikunau 6 496 1912 373 5.1
Onotoa 5 451 1611 332 4.9
Tamana 3 544 869 196 4.4
Arorae 2 620 1254 275 4.6
Kanton Phoenix 1 1751 41 9 4.6
Orona (Hull) 1 1756 ? ? ?
Enderbury 0 1821 0 0 0
Birnie 0 1790 0 0 0
Phoenix 0 1880 0 0 0
Sydney 0 1849 0 0 0
Mackean 0 1517 0 0 0
Gardner 0 1524 0 0 0
Teraina
(Washington) Line 9 2900 1154 197 5.9
Tabuaeran
(Fanning) 9 3000 2536 411 6.2
Kiritimati
(Christmas) 4 3200 5094 783 6.5
Malden 0 3483 0 0 0
Starbuck 0 3524 0 0 0
Vostock 0 4021 0 0 0
Caroline 0 4214 0 0 0
Flint 0 4125 0 0 0
Total 185 92428 14172 6.5
23SIWRWMPIC- National IWRM Diagnostic Report Kiribati
Total (Outer
Island) 169 52,216 8,932 5.8
Source: Government of Kiribati 2005 Census
The principal form of employment in Kiribati is through the government. Approximately 10% of the
population is formally employed in the cash economy, with two-thirds of the jobs provided by the
public sector. Many in both the rural areas and in urban South Tarawa rely on subsistence
activities to support families. The government-subsidised harvesting of coconuts for shipping to
the government’s copra factory in Betio is a principal source of income in rural areas.
Remittances sent home from I-Kiribati working overseas, particularly seamen working on
merchant ships, are an important source of external income. Other internal sources of income
include the local marketing of fish, vegetables, fruit and toddy. In South Tarawa, provision of
minibus services and other service industries are additional sources of income.
The relatively low per capita Gross Domestic Product (GDP) should not be taken as an indication
of poverty. Most adult I-Kiribati own or have access to land. Land ownership, traditionally has
social, political and cultural significance and carries with it fishing, harvesting and resource rights
and provides access to building materials and food. Land ownership is of central importance in
Kiribati (Talu et al. 1979).
There are cultural influences in small island nations that have a direct bearing on water
management. At their heart is the conflict between the demands of a highly urbanised society and
the traditions and practices of subsistence communities developed over millennia (Jones 1997;
White et al. 1999). In island communities, access to land and common property resources is
essential for survival, even in urban areas (Jones 1997). Land tenure has customary rights
including ownership of groundwater and in some islands allegiance is to the extended family not
to society at large. Finally, there is a marked reluctance to share knowledge and skills (Talu et al.
1979; Crennan 2002). To alter these characteristics to achieve better water and wastewater
management involves behavioural change, which is a long-term process.
The geographic setting of Kiribati and the hydrogeology of its islands impose significant problems
for the sustainable delivery of water and sanitation services across widely dispersed and isolated
communities, from low density subsistence populations to high density urban areas, with mostly
limited land areas (except Kiritimati), limited good quality freshwater, increasing populations and
with significant climate variability. Added to these difficulties are human and financial resource
limitations which make sustainable, equitable and efficient water resource management a major
challenge.
24SIWRWMPIC- National IWRM Diagnostic Report Kiribati
3. Integrated water resources management for Kiribati
3.1. Water resources management
3.1.1 Sources of freshwater
Sources of freshwater for Kiribati’s island communities are restricted to rainwater, shallow
unconfined groundwater (generally within less than 2 m of the surface), imported water or
desalination (Falkland 2002). Seawater is used by many for bathing. The need for reliable power
supply to run desalination units, their maintenance and operational requirements means that
desalination plants are often difficult for small, isolated rural island communities to maintain. Of
five desalination plants installed in Kiribati over the past seven years only one is partly operational
on the island of Banaba. The raised island of Banaba uniquely has fresh water pools in
subterranean caves that could serve as an emergency source of water in times of severe drought
(Overmars and Butcher 2001). In addition, during the British Phosphate Commission period water
was imported in phosphate boats and stored in large 4,500 m3 storage tanks on the island. Water
in these tanks is currently unused because of the presence of rust suspension in the water.
3.1.1.1 Bottled water. Bottled water was produced in South Tarawa from a privately owned
reverse osmosis desalination plant using seawater as feedstock. This is no longer working due to
operational problems. Currently, between 300 and 500 m3 of bottled water are imported annually.
Its price of about US$1.00 per/litre puts it beyond the reach of squatters and many subsistence
communities.
3.1.1.2 Shallow fresh groundwater. Shallow fresh groundwater is the principal source of
freshwater in Kiribati’s low coral islands and is restricted to a relatively thin freshwater lens,
mostly confined to the unconsolidated Holocene sediments overlying seawater in the karst
limestone (Wheatcraft and Buddemeier 1981).
The viability of groundwater lenses in low coral atolls as sources of freshwater is determined by
the thickness of the freshwater lens, generally between about 1 and 25 m. Thin lenses are more
vulnerable to rainfall variability and over-extraction. Lens thickness depends on the groundwater
recharge rate, the hydraulic conductivity of the unconsolidated aquifer, the width of the island, the
intensity of mixing of the base of the freshwater lens with the underlying seawater, the peripheral
discharge of groundwater at the edge of the lens to the sea and the groundwater extraction rate.
The extremely large hydraulic conductivity of the Pleistocene karst limestone aquifers means that
tidal pressure signals are rapidly transmitted throughout the karst aquifers. The pressure from the
karst system is then transmitted vertically upward through the overlying unconsolidated sand
aquifer. This forces diurnal fluctuations of the groundwater across the islands. This creates a wide
transition or mixing zone between freshwater and seawater and advects salt into the upper
freshwater zone (Oberdorfer et al. 1990, Underwood et al. 1992). In relatively thick lenses,
chloride contents in the upper groundwater may be up to 200 mg/L and in thinner lenses may
reach 2,000 mg/L, above the WHO (2004) drinking water guideline value of 250 mg/L. In times of
severe drought the salinity of freshwater lenses can increase dramatically and is particularly
important in islands with thin freshwater lenses.
The quantity and quality of freshwater available to island communities is partly known in only two
atolls; Tarawa in the Gilberts and Kiritimati in the Line Islands. Where hydraulic conductivities of
the unconsolidated surface sediments or the underlying karst limestone are very large (of order
1,000 m/day), and where rainfalls small or island width is small (of order 100 m), useable fresh
groundwater lenses are absent (Wheatcraft and Buddemeier 1981).
3.1.1.3 Rainwater harvesting. The westernmost island of the nation, Banaba, relies almost totally
on the collection of rainfall for its water supply (Overmars and Butcher 2001). However, the
sophisticated rainfall collection and storage scheme installed in the 1960’s under the British
25SIWRWMPIC- National IWRM Diagnostic Report Kiribati
Phosphate Commission is in urgent need of restoration. In some other islands, such as Kiebu in
Makin, and atolls such as Nonouti, also in the Gilbert Group, groundwater is brackish, particularly
during droughts, and rainwater harvesting is important. Rainfall collection has been used in
Kiribati for many years, but it is regarded, at best, as a supplementary source of water. The
potential for increasing rainwater harvesting is large and enactment of building regulations
obliging house owners to construct gutters and tanks for the harvesting of rainwater is recognition
of its importance.
There are several reasons why rainwater is underused. Firstly, the cost of rainwater collection
and storage is beyond many particularly in outer islands, so that building regulations are largely
ignored. Secondly, there is a cultural preference for the taste of groundwater. This is because of
the traditional use of toddy for drinking. Rainwater mixed with toddy does not taste as good as
when mixed with groundwater. Thirdly, many building roofs are made using traditional materials
such as pandanus and coconut thatch. These are less than ideal for rainwater harvesting.
Fourthly, many conventional-sized affordable rainwater tank systems would fail during the
frequent droughts. Finally, people do not realise the risks involved in drinking untreated
groundwater. Despite the regulations, many public buildings with large suitable roof areas, such
as maneaba’s (meeting houses), continue to be constructed without rainwater collection and
storage systems. There is currently little information about the quantity, condition or quality of
rainwater harvesting systems.
An incentive Loans Scheme for government employees to install rainwater harvesting and/or
sanitation facilities has been operating in South Tarawa since 2002. This incentive scheme based
on a revolving fund was established under the SAPHE1 Project to assist households to purchase
6,000 litre capacity plastic rainwater tanks. In the years 2002 to 2004, about 710 loans were given
for roof rainwater harvesting and storage equipment. Repayments of loans of up to a maximum
of AU$1,500 are guaranteed by ensuring loans are given only to people with regular incomes and
by recovering regular repayments from fortnightly salaries. The scheme is administered by the
Kiribati Housing Corporation. Under the water component of the Kiribati Adaptation Program
Phase II (KAPII) it is planned to attempt to trial this scheme in rural areas and outer islands. In
some outer islands, such as those in Nonouti or Banaba in the Gilberts, communities are forced
to rely solely on collected rainwater. These communities are most vulnerable to droughts
(SOPAC 2001). Because of the lengths of the major droughts suffered in Kiribati it is extremely
difficult for households to store sufficient water to meet demand throughout droughts.
3.1.2 Types of freshwater use
Water is used by the community for domestic drinking consumption, cooking and washing, for
agriculture, and for industry. There is relatively little tourism in Kiribati although there is potential
for an expansion, particularly in the northern Gilberts and in Kiritimati. Daily groundwater
production figures are available for the reticulated water supply system in South Tarawa (currently
around 2,300 m3/day), but not from the other reticulated groundwater supply systems in Kiritimati.
In the agriculture sector, fresh groundwater is used by traditional crops, such as coconuts and
babwai (swamp taro), hand-irrigated vegetable and fruit crops and livestock, mainly pigs and
chickens. There are an estimated total number of over 34,000 pigs and 55,000 chickens in the
country. Apart from coconuts, there is little information on freshwater use in either agriculture or in
industry, although it is estimated that 2 pigs require the water equivalent to one human. Sap flow
measurements have shown that mature coconut trees are estimated to use approximately 150
L/day of groundwater, equivalent to the current reticulated supply of a family of 5 people (White et
al. 1999). There is little information on actual water use from various available water sources, or
its quality, in either urban or rural areas, apart from water supply figures for South Tarawa.
1
Sanitation, Public Health and Environment Improvement Project
26You can also read


