Granta EduPack for Eco Design- A White Paper - Ansys
←
→
Page content transcription
If your browser does not render page correctly, please read the page content below

Granta EduPack for Eco Design-
A White Paper

M.F. Ashby1, A. Miller2, F. Rutter2, C. Seymour2, and U.G.K. Wegst3

1
 Engineering Department, University of Cambridge
2
 Ansys Materials Education Division
3
 Thayer School of Engineering, Dartmouth College

First published as ‘The CES EduPack Eco Selector—Background Reading’, February 2005.
Version 6 © October 2021, ANSYS Inc.

                                       © 2021 ANSYS, Inc.                              ED U CAT I O N R E SO U R C E S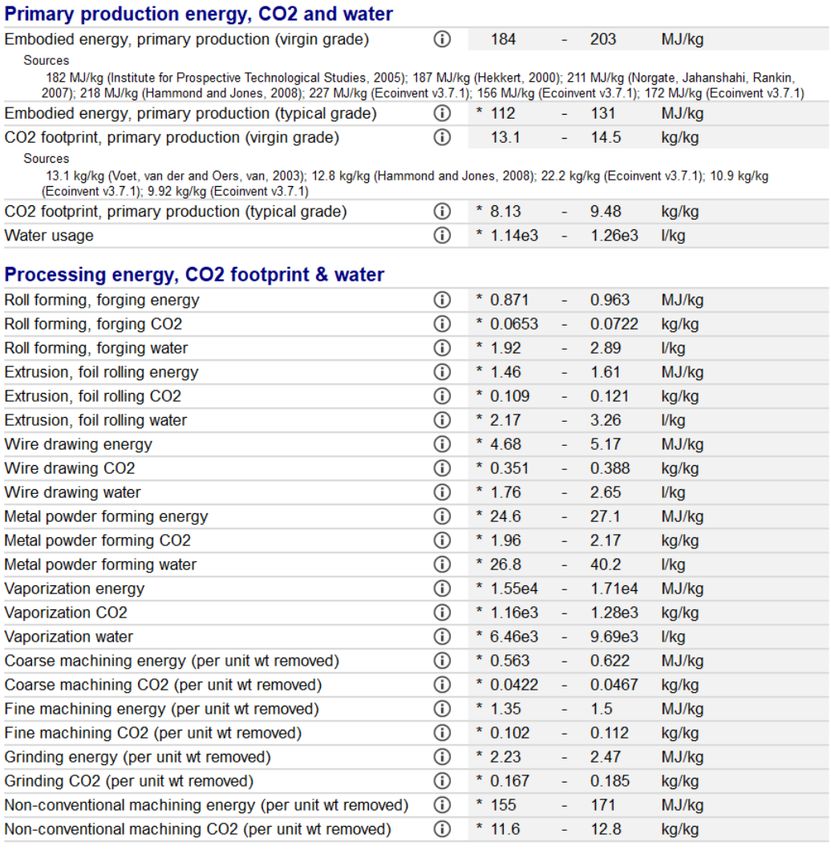
Abstract
Concern for the damaging effect of human activity on the environment prompts efforts to analyze and correct them.
The focus of this report is on the role of materials and processes in this, and on data, methods, and supporting
software to support design to minimize the damage. The approach is a broad one, seeking to develop a resource
that, although approximate, has wide applicability. This is only possible if prerequisites of strict procedure and
exactitude are relaxed. The method allows greater rigor and precision to be incorporated as the data to enable
them becomes available.

The report introduces the problem, describes the Granta EduPack software that incorporates the method, and the
MaterialUniverse data that supports it. The data and a version of the software appropriate for teaching are also
available as the Granta EduPack Eco Design Edition. Here we document sources of the data, the ways in which
estimates have been made for the numerous materials for which no eco-data are available, and illustrate the use
of the system for selection. Numerous further examples can be found in the text “Materials and the Environment”
by Ashby.

Table of Contents

Abstract.................................................................................................................................                 2
1. Introduction: the material’s life-cycle................................................................................                                3
2. Materials selection in design.............................................................................................                             4
  The design process.............................................................................................................                         4
  Materials selection.............................................................................................................                        4
3. Material and energy-consuming systems..........................................................................                                        6
  The use-patterns of products.............................................................................................                               7
4. The Granta eco data..........................................................................................................                          9
  Geo-economic data............................................................................................................                           9
  Material production: energy and emissions......................................................................                                         10
  Material processing energies at 30% efficiency.................................................................                                         11
      Melting. ........................................................................................................................................   11
      Vaporization..................................................................................................................................      11
      Deformation..................................................................................................................................       11
  End of Life..........................................................................................................................                   12
  Bio-data..............................................................................................................................                  12
  Sustainability, and possible substitutes..............................................................................                                  12
  Aggregated measures: eco-indicators................................................................................                                     12
  Sources of data...................................................................................................................                      13
5. Data estimates...................................................................................................................                      14
  Filling the holes: data estimation.......................................................................................                               15
6. Using the data...................................................................................................................                      16
  The material production phase..........................................................................................                                 17
  The product-manufacture phase........................................................................................                                   20
  The use phase....................................................................................................................                       21
  The product disposal phase...............................................................................................                               21
7. Case studies.......................................................................................................................                    21
  The energy content of containers......................................................................................                                  21
      The problem. ................................................................................................................................       21
      The method and results. ..............................................................................................................              21
   Crash barriers.....................................................................................................................                    22
      The problem. ................................................................................................................................       22
8. Summary and conclusions.................................................................................................                               24
9. References.........................................................................................................................                    25

 2                                                                          © 2021 ANSYS, Inc.                                                                 GRANTA EDUPACK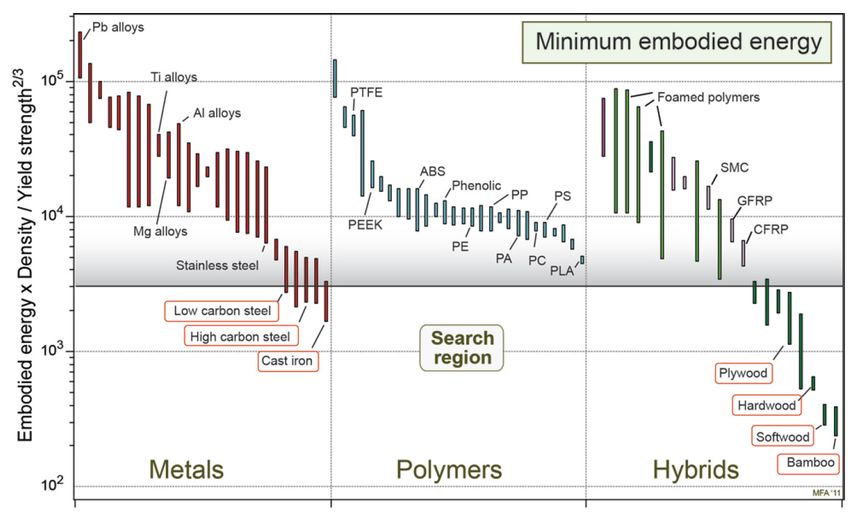
1. Introduction: the material’s life-cycle

All human activity has some impact on the environment in which we live. The environment has some
capacity to cope with this, so that a certain level of impact can be absorbed without lasting damage.
But it is clear that current human activities exceed this threshold with increasing frequency, diminishing
quality of life and threatening the well-being of future generations. The position is dramatized by the
following statement: at a global growth rate of 3% per year we will mine, process, and dispose of more
“stuff” in the next 25 years than in the entire history of human civilization. Design for the environment
(Eekels, 1993; Fiskel and Wapman, 1994) is generally interpreted as the effort to adjust our present
product design efforts to correct known, measurable, environmental degradation; the time-scale of this
thinking is ten years or so, an average product’s expected life. Design for sustainability is the longer
view: that of adaptation to a lifestyle that meets present needs without compromising the needs of
future generations (Brundlandt, 1987). The time-scale here is less clear—it is measured in decades or
centuries—and the adaptation required is much greater. This report focuses on the role of materials and
processes in achieving both of these.

        Figure 1. The material life-cycle. Ore and feedstock are mined and processed to yield a material. This is
    manufactured into a product that is used and at the end of its life, discarded or recycled. Energy and materials are
                                       consumed in each phase, generating waste.

The nature of the problem is brought into focus by examining the materials lifecycle, sketched in Figure 1.
Ore and feedstock, most of them non-renewable, are processed to give materials; these are manufactured
into products that are used, and, at the end of their lives, disposed, a fraction perhaps entering a recycling
loop, the rest committed to incineration or land-fill. Energy and materials are consumed at each point in
this cycle (we shall call them “phases”), with an associated penalty of CO2 and other emissions—heat,
and gaseous, liquid, and solid waste.

The problem, crudely put, is that the sum of these unwanted by-products now often exceeds the capacity
of the environment to absorb them. Some of the injury is local, and its origins can be traced and remedial

3                                                  © 2021 ANSYS, Inc.                                           GRANTA EDUPACK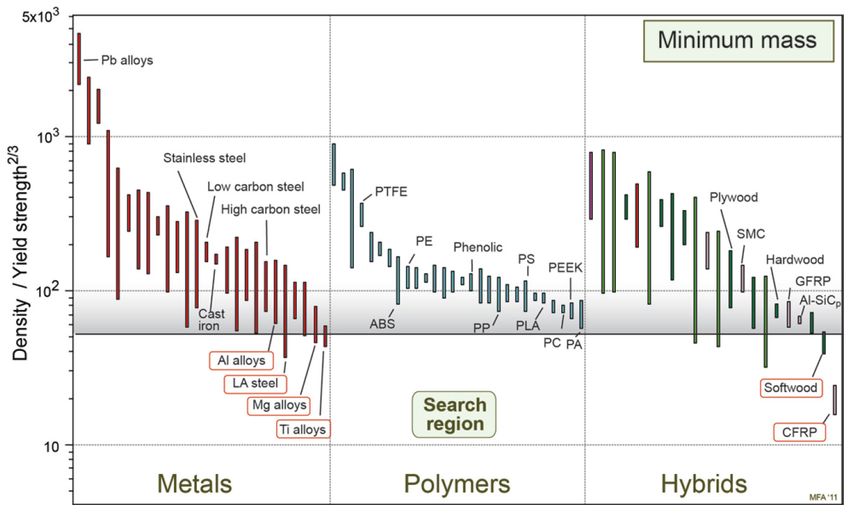
action taken. Some is national, some global, and here remedial action has wider social and organizational
prerequisites. Much present environmental legislation aims at modest reductions in the damaging
activity; a regulation requiring 20% reduction in—say— the average gasoline consumption of passenger
cars is seen by car-makers as a major challenge.

Sustainability requires solutions of a completely different kind. Even conservative estimates of the
adjustment needed to restore long-term equilibrium with the environment envisage a reduction in the
flows of Figure 1 by a factor of four (see, for example, von Weizsäcker et al, 1997); some say ten (Schmidt-
Bleek, 1997). Population growth and the growth of the expectations of this population more than cancel
any modest savings that the developed nations may achieve. It is here that the challenge is greatest,
requiring difficult adaptation, and one for which no generally-agreed solutions yet exist. But it remains
the long-term driver of eco-design, to be retained as background to any creative thinking.

2. Materials selection in design

The design process
The essential steps in the design process are
described in the flow chart of Figure 2 (Cross,
2000; French 1985; Pahl and Beitz, 1997; Ullman,
1992; Ulrich and Eppinger, 1995). A market need
is identified. Concepts to fill it are developed and
critically reviewed. Promising concepts pass to the
embodiment or “layout” stage, where the most
suitable is selected for detailed design, analysis,
production, planning, and costing. The output is a
product specification, enabling prototyping, testing,
and the establishment of full production.

The environmental impact of a product is frequently
explored using the techniques of Life Cycle
Assessment (LCA). An LCA analysis, as the name
implies, examines the life cycle of a product and Figure 2. The design flow-chart showing need, concept
assesses the eco- impact it creates. This requires generation, embodiment, and detailing. On the left: the
                                                         design tools that support the process. On the right: the
information of the life-history of the product at a                       material data-needs.
level of precision that is only available after the
product has been produced and used. It is a tool for the evaluation and comparison of existing products,
rather than one that guides the design of those that are new. The difficulty is that decisions taken in the
early stages of design lead to commitments that cannot easily be changed later; for this early decision-
making, LCA comes too late. Instead a design tool is required that guides environmental awareness and
exploits the information available early in the design process—the “concept” and “embodiment” stages
of Figure 2.

Materials selection

Unbiased materials selection is best achieved by considering all materials to be viable candidates
until shown to be otherwise. Efficient selection (Ashby, 2005) involves four steps, which we here call
translation, screening, ranking, and supporting information (Figure 3). The steps can be likened to

4                                            © 2021 ANSYS, Inc.                                    GRANTA EDUPACK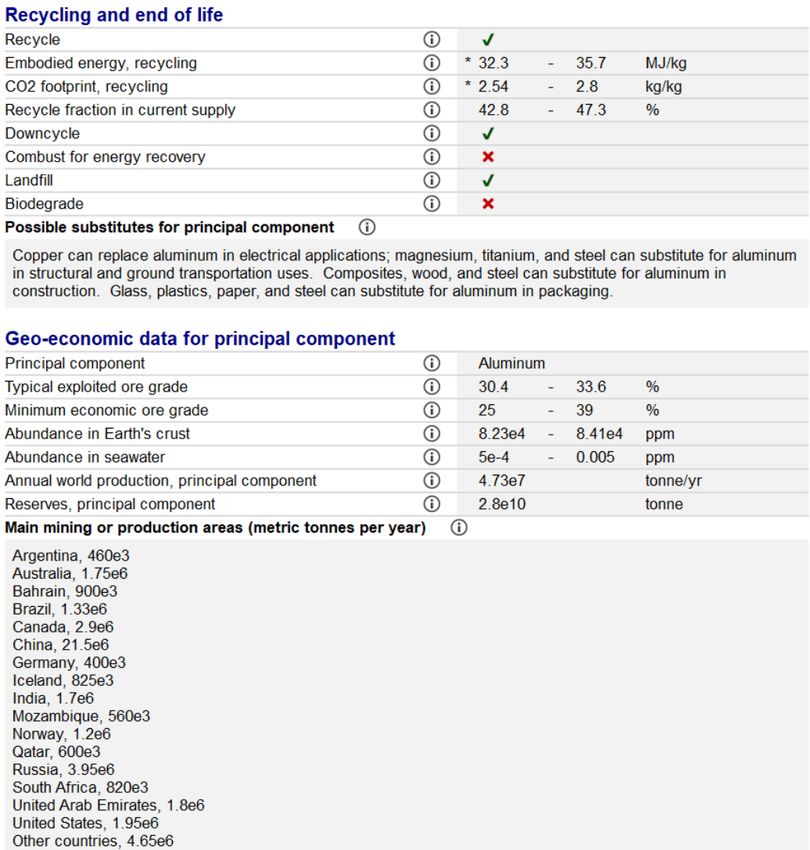
those in selecting a candidate for a job. The company needs are first
                                   analyzed and translated into a job specification. The job is advertised,
                                   defining essential skills and experience, thereby screening-out potential
                                   applicants unable to meet the job requirements and allowing a shortlist
                                   to be drawn up. Applicants submit CVs, which allows candidates to the
                                   ranked by the strength of evidence that they can do the job effectively
                                   and efficiently. References and interviews are then sought for the short-
                                   listed candidates, building a file of supporting information.

                                       Texts on material selection (Dieter, 1991; Charles et al, 1997; Budinski
                                       and Budinski,1999; Farag, 1989; Lewis, 1990; Ashby, 2005) describe
                                       how these steps are implemented to select materials and processes.
                                       In the translation step the design requirements are reformulated as
                                       constraints on material properties and process attributes and as one or
                                       more objectives: minimization of cost, or of weight, or of environmental
                                       impact, for instance. In screening, these constraints are used to eliminate
                                       materials that cannot meet the requirements. It is effectively performed
                                       using a computerized database containing material attributes: values
                                       for physical, mechanical, thermal, and electrical properties; and—in a
  Figure 3. The strategy for materials database for eco- selection—attributes relating to the environmental
    selection. The four main steps—
  translation, screening, ranking, and
                                       impact of the production of the material itself: its energy content, the
  supporting information—are shown greenhouse and acidification gases created by its production, its toxicity,
                  here.                and so forth. The design requirement that “the service temperature of
                                       a candidate material must be greater than 250°C” imposes the limit
that the maximum service temperature of any viable candidate must be greater than this; the design
requirement of “electrical insulation” imposes a limit on electrical resistivity, and so forth. Attribute
limits are the analog of the job advertisement that requires that the applicant “must have a valid driving
license”, or “a degree in computer science”. They do not, however, provide any level of performance
optimization.

Ranking is achieved by the use of material indices derived from the objective mentioned above. These
are groupings of material properties that characterize performance: the materials with the largest values
of an index maximize some aspect of performance. The specific stiffness, E/ρ, is one such index (E is
Young’s modulus and ρ the density); the specific strength σy/ρ is another ( σy is the yield strength). There
are many material indices, each measuring some aspect of efficiency for a given function; a catalog, with
derivations, can be found in Ashby (2005). They are the analog of the job advertisement that states that
“typing speed and accuracy are a priority”, or that “preference will be given to those with a proven track
record of success in this environment”, implying that applicants will be ranked by these criteria.

Indices are used with material selection charts. These are plots of one material property or a combination
of material properties against another shown schematically in Figure 4. Material indices can be plotted
on a material selection chart, identifying materials that have attractive values of the index. The procedure
allows ranking of materials according to cost per unit of function, mass per unit of function or, as described
below, environmental impact per unit of function.

5                                            © 2021 ANSYS, Inc.                                     GRANTA EDUPACK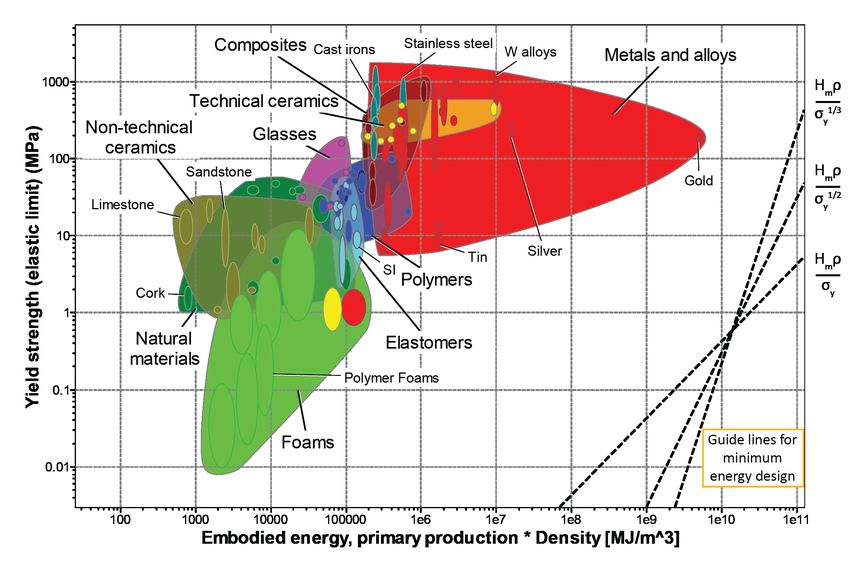
The output of the screening and
ranking steps is a ranked short-list of
materials that satisfy the quantifiable
requirements of the design. To proceed
further we seek a detailed profile of the
top-ranked candidates: their supporting
information (Figure 3, second box
from the bottom). Typically, it is non-
quantifiable information: examples of its
use, design guidelines, failure analyses,
processing information, or details of
availability and pricing. Supporting
information helps narrow the short list
to a final choice, allowing a definitive
match to be made between design
requirements and material attributes.
The parallel, in filling a job, is that of
taking up references and conducting Figure 4. A schematic E – ρ chart showing guidelines for selecting materials
interviews—an opportunity to probe                            for light, stiff structures.
deeply into the character and potential
of the candidate.

It is, of course, unrealistic to think of minimizing the environmental impact of material production and
usage as the only objective, there are always other considerations: cost, reliability, performance. The
method of penalty-functions for materials selection, built into the methodology, allows an optimum
compromise to be reached (Ashby, 2005).

3. Material and energy-consuming systems

The most obvious ways to conserve materials is to make products smaller, make them last longer, and
recycle them when they finally reach the end of their lives. But the seemingly obvious can sometimes be
deceptive. Materials and energy form part of a complex and highly interactive system, of which Figure
5 is a cartoon. Here primary catalysts of consumption such as new technology, planned obsolescence,
increasing wealth and education, and population growth influence aspects of product use and, through
these, the consumption of materials and energy and the by-products that these produce. The connecting
lines indicate influences; a green line suggests positive, broadly desirable influence; red line suggests
negative, undesirable influence, and red-green suggests that the driver has the capacity for both positive
and negative influence.

The diagram brings out the complexity. Follow, for instance the lines of influence of new technology
and its consequences. It offers more material and energy-efficient products, but by also offering new
functionality it creates obsolescence and the desire to replace a product that has useful life left in it.
Electronic products are prime examples of this: 80% are discarded while still functional. And observe,
even at this simple level, the consequences of longer life—a seemingly obvious measure. It can certainly
help to conserve materials (a positive influence) but, in an era in which new technology delivers more
energy-efficient products (particularly true of cars, electronics, household appliances today), extending
the life of old products can have a negative influence on energy consumption.

6                                           © 2021 ANSYS, Inc.                                    GRANTA EDUPACK
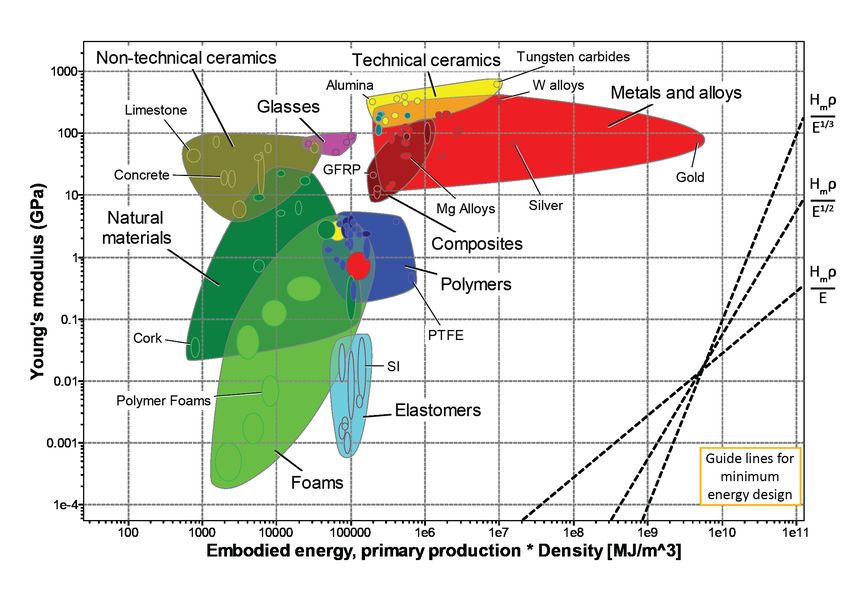
Figure 5. The influences on consumption of materials and energy. It is essential to see eco-design as a systems problem, not
  solved by simple choosing “good” and avoiding “bad” materials, but rather that of matching the material to the system
                                                      requirements.
As a final example, consider the bi-valent influence of industrial design. The lasting designs of the past
are evidence of its ability to create products that are treasured and conserved. But today it is frequently
used as a potent tool to stimulate consumption by deliberate obsolescence, creating the perception that
“new” is desirable and that even slightly “old” is unappealing.

The use-patterns of products

Table 1 suggests a matrix of product use- patterns. Those in the first row require energy to perform
their primary function. Those in the second could function without energy but, for reasons of comfort,
convenience, or safety, consume energy to provide a secondary function. Those in the last row provide
their primary function without any need for energy other than human effort. The load factor across the
top is an approximate indicator of the intensity of use—one that will, of course, vary widely.
                                          Table 1. Use matrix of product classes.

                                     High Load Factor        Modest Load Factor            Low Load Factor          Energy
                                                                                                                   Intensive
               Primary                    Family car                Television              Coffee maker
           power-consuming                 Train set                 Freezer               Vacuum cleaner
                                            Aircraft                                       Washing machine
              Secondary             Housing (heat, light)        Car-park (light)         Household dishes
           power-consuming                                                                Clothing (washing)

                 Non                        Bridges                 Furniture                    Canoe
           power-consuming                   Roads                   Bicycle                      Tent
                                                                                                                 Material
                                                                                                      Low impact Intensive
                                High impact

7                                                © 2021 ANSYS, Inc.                                          GRANTA EDUPACK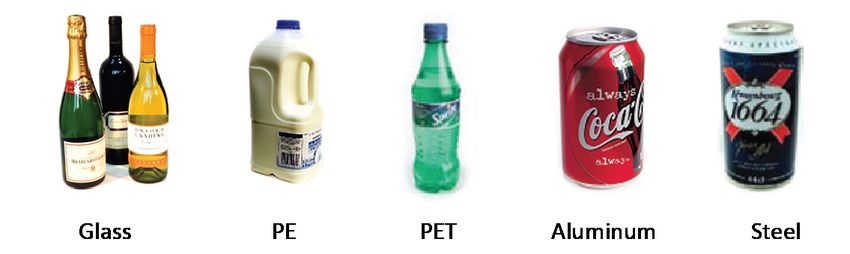
The choice of materials and processes influences all phases of Figure 1: production, through the drainage
of resources and the undesired by-products of refinement; manufacture, through the level of efficiency
and cleanness of the shaping, joining, and finishing processes; use, through the ability to conserve energy
through light-weight design, higher thermal efficiency and lower energy drainage; and (finally) disposal
through a greater ability to allow disassembly and recycling. Our aim has been to create a tool to assist
the designer in minimizing the undesired consequences of the four phases.

It is generally true that one of the four phases of Figure 1 dominates the picture. Simplifying for a moment,
let us take energy consumption as a measure of both the inputs and undesired by-products of each phase
and use it for a character-appraisal of use-sectors. Figure 6 presents the evidence, using this measure.
It has two significant features, with important implications. First, one phase almost always dominates,
accounting for 80% or more of the energy—often much more. If large changes are to be achieved, it is this
phase that must be the target; a reduction by a factor of 2, even of 10, in any other makes little significant
difference to the total. The second: when differences are as great as those of Figure 6, precision is not the
issue—an error of a factor of 2 changes very little. It is the nature of people who measure things to wish
to do so with precision, and precise data must be the ultimate goal. But it is possible to move forward
without it: precise judgments can be drawn from imprecise data.

         Figure 6. Approximate values for the energy consumed at each phase of Figure 1 for a range of products
                                                 (data from Bey, 2000).

8                                              © 2021 ANSYS, Inc.                                         GRANTA EDUPACK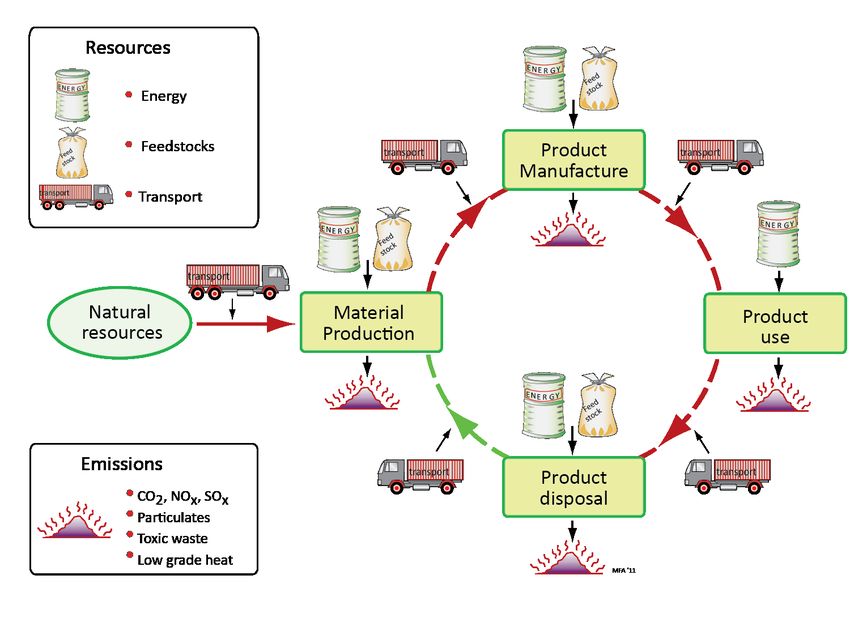
4. The Granta eco data                                        Table 2. Eco-data for engineering materials

                                                           Geo-economic data for principal component
Table 2 lists eco attributes included in Granta’s
                                                              Principal component (material name)
MaterialUniverse data module for research and                 Annual world production (tonnes/yr)
industrial product development. This data is                             Reserves (tonnes)
available for these applications via the industrial              Typical exploited ore grade (%)
Granta Selector software. It is also available to               Minimum economic ore grade (%)
support teaching through the Granta EduPack Eco                 Abundance in earth’s crust (ppm)
Design Edition. We now describe this data.                       Abundance in sea water (ppm)
                                                           Material production: energy and emissions
Geo-economic data                                                   Production energy (MJ/kg)
                                                                       CO2 creation (kg/kg)
The first block of data shown in Table 2 contains                      NOx creation (kg/kg)
                                                                       SOx creation (kg/kg)
information about the resource base from which
the material is drawn and the rate at which it is              Indicators for principal component
being exploited. The annual world production is                         Eco-indicator 95
simply the mass of the material extracted annually                      Eco-indicator 99
from ores or feedstock. The reserves (listed for                            EPS value
elements only) are estimates of today’s known              Material processing energy at 30% efficiency
economically recoverable ores or feedstock from                 Minimum energy to melt (MJ/kg)
which the material is extracted or created. The               Minimum energy to vaporise (MJ/kg)
resource base (not listed in the database because of        Minimum energy to deform 90% (MJ/kg)
its uncertainty) is an estimate of what this quantity                        End of life
might become if all possible sources, including                           Recycle (yes/no)
those not yet assayed, were known.                                     Down-cycle (yes/no)
                                                                       Biodegrade (yes/no)
                                                                        Incinerate (yes/no)
Taken at their face value the reserves and the
                                                                          Landfill (yes/no)
resource base allow estimates of the resource                       Recycling energy (MJ/kg)
life—the time to exhaust the resource—by dividing            Recycle as fraction of current supply (%)
them by the annual world production. But, although
                                                                              Bio-data
such calculations are possible, they are futile. The                       Toxicity rating
reserves are estimates made by mining companies             (non-toxic, slightly toxic, toxic, very toxic)
who, for economic reasons, have little interest in         Approved for skin and food contact (yes/no)
declaring known reserves extending beyond a                              Sustainability
ten-year time- scale. The resource base is still less             A renewable resource (yes/no)
well defined: historically, improved exploitation
                                                           Possible substitutes for principal component
technology has often expanded the resource base
                                                                                Text
faster than exploitation has diminished it.

All this sounds like an argument for dismissing data for reserves and resources completely. They must
be viewed in a very critical way—it is easy to be misled by them. But there is an ultimate point at which
consumption will outstrip the rate of discovery of recoverable ore, and at that point use patterns must
start to change. Material reserves will never “run out”, but as the resource base diminishes, the material
cost will rise, making their lower-value uses untenable. The data now available are an inadequate indicator,
but the continuing near-exponential growth in consumption makes conclusions less sensitive to this than
might be thought. Current values for these quantities are given to allow comparisons between materials,
and to enable the user to make his or her own judgment.

9                                          © 2021 ANSYS, Inc.                                      GRANTA EDUPACK
As an indicator of the limits that technology might sooner or later address, we list, for the elements, the abundance in the earth’s crust and oceans. If recovery of a material were sufficiently important, processes might be necessary to extract them from “ores” with these minute yields. It is already done for a few; magnesium is economically extractable from seawater, as is bromine; aluminum and silicon are so abundant in the Earth’s crust that they could be extracted almost anywhere. The data are presented as a reminder of this aspect of resource distribution. What is economic at present? The range of concentrations of currently-mined reserves— the typical exploited ore grade—is given as one indicator; more significant is the minimum economic ore grade, also given, since it is the measure of where extraction cost and market value come into balance. But this, too, must be heavily qualified. Ore grades vary enormously—those viable at the highest grade are usually small in volume, and, for various reasons (geographical, or chemical), unable to meet market needs; the leaner ores may be more accessible, so that the market comes into equilibrium despite the differences in sourcing. Material production: energy and emissions Most of the energy consumed in the four phases of Figure 1 is derived from fossil fuels. Some is consumed in that state—as gas, oil, coal, or coke. Much is first converted to electricity and then used. The European average conversion efficiency is about 30%. Not all electricity is generated from fossil fuels—there are contributions from hydroelectric, nuclear, and wind/wave generation. But with some exceptions (e.g., Norway at 70% hydro) the predominant energy sources remain fossil fuels. The fossil-fuel energy consumed in making one kilogram of material is called its embodied energy. Some of the energy is stored in the created material and can be reused, in one sense or another, at the end of life. Polymers made from oil (as most are) contain energy in another sense—that of the oil that enters the production as a primary feedstock. Natural materials such as wood, similarly, contain “intrinsic” or “contained” energy, this time derived from solar radiation absorbed during growth. Views differ on whether the intrinsic energy should be included in the embodied energy or not. There is a sense in which not only polymers and woods, but also metals, carry intrinsic energy that could— by chemical reaction or by burning the metal in the form of finely-divided powder—be recovered, so omitting it when reporting embodied energy for polymers but including it for metals seems inconsistent. For this reason we have chosen to include intrinsic energy from non-renewable resources in reporting production energies, which generally lie in the range 50–500 MJ/kg. The existence of intrinsic energy has another consequence: that the energy to recycle a material is sometimes much less than that required for its first production, because the intrinsic energy is retained. The recycling energy, listed in the database, is—despite its approximate nature—a useful indicator of the viability of recycling. Typical values lie in the range 10–100 MJ/kg. The production of 1 kg of material is associated with undesired gas emissions, among which CO2, NOx, SOx and CH4 cause general concern (global warming, acidification, ozone-layer depletion). The quantities can be large—each kg of aluminum produced by using energy from fossil fuels creates some 9 kg of CO2, 40 grams of NOx and 90 grams of SOx. Production is generally associated with other undesirable outputs, particularly toxic wastes and particulates, but these can, in principle, be dealt with at source. 10 © 2021 ANSYS, Inc. GRANTA EDUPACK
Wood, bamboo, and other plant-based materials, too, contain intrinsic energy, but unlike man-made
materials it derives from sunlight, not from non-renewable resources. The embodied energy data for
these materials does not include this intrinsic energy, and the emissions take account of the CO2 absorbed
during their growth.

Material processing energies at 30% efficiency

Many processes depend on casting, evaporation, or deformation. It is helpful to have a feel for the
approximate magnitudes of energies required by these.

Melting.
To melt a material, it must first be raised to its melting point, requiring a minimum input of the
heat C p(Tm-To), and then caused to melt, requiring the latent heat of melting, Lm
                                                                                                 (1)

where Hmin is the minimum energy per kilogram for melting, Cp is the specific heat, Tm is the melting point,
and To is the ambient temperature. A close correlation exists between Lm and CpTm.
                                                                                                 (2)

and for metals and alloys Tm>>To, giving
                                                                                                 (3)

Assuming efficiency of 30%, the estimated energy to melt one kilogram, H*min, is
                                                                                                 (4)

the asterisk recalling that it is an estimate. For metals and alloys, the quantity H*min lies in the range 0.4-4
MJ/kg.

Vaporization
As a rule of thumb, the latent heat of vaporization, Lv, is larger than that for melting, Lm, by a factor of
24±5, and the boiling point Tb is larger than the melting point, Tm, by a factor of 2.1±0.5. Using the same
assumptions as before, we find an estimate for the energy to evaporate 1 kg of material (as in PVD
processing to be
                                                                                              (5)

again assuming an efficiency of 30%. For metals and alloys, the quantity Hv* lies in the range 3 to 30 MJ/
kg.

Deformation
Deformation processes like rolling or forging generally involve large strains. Assuming an average flow-
strength of (σy + σuts)/2, a strain of ε=90%, and an efficiency factor of 30%, we find the work of deformation
per kg to be
                                                                                                  (6)
where σy is the yield strength and σuts is the tensile strength. For metals and alloys, the quantity WD* lies in
the range 0.01 to 1 MJ/kg. We conclude that casting or deformation require processing energies that are
small compared to the embodied energy of the material being processed, but the larger process energies
required for vapor-phase processing may become comparable with those for material production.

11                                          © 2021 ANSYS, Inc.                                    GRANTA EDUPACK
End of Life Quantification of the process of material recycling is difficult. Recycling costs energy, and this energy carries its burden of gases. But the recycle energy is generally small compared to the initial embodied energy, making recycling—when it is possible at all—an energy-efficient proposition. It may not, however, be one that is cost efficient; that depends on the degree to which the material has become dispersed. In-house scrap, generated at the point of production or manufacture is localized and is already recycled efficiently (near 100% recovery). Widely distributed “scrap”—material contained in discarded products— is a much more expensive proposition to collect, separate, and clean. Many materials cannot be recycled, although they may still be reused in a lower-grade activity; continuous- fiber composites, for instance, cannot be re-separated economically into fiber and polymer in order to recycle them, though they can be chopped and used as fillers. Most other materials require an input of virgin material to avoid build-up of uncontrollable impurities. Thus the fraction of a material production that can ultimately re-enter the cycle of Figure 1 depends both on the material itself and on the product into which has been incorporated. Despite this complexity, some data for the fraction re-entering the cycle of Figure 1 are available and—where this is so—it is listed as recycle as fraction of current supply. More usually, the position is characterized by indicating simply whether the material can or cannot be recycled, down-cycled, biodegraded, incinerated, or committed to landfill. Bio-data Some materials are toxic, creating potential problems during production, during use, and during disposal. The database ranks toxicity on a four-point scale: non-toxic, slightly toxic, toxic, and very toxic. More pertinent, often, is information about whether a material can be used in contact with skin or food, for children’s toys, or for storing medical supplies. An indication of this is approval by the Federal Drug Administration (FDA) or equivalent bodies. The database indicates this under the heading approved for skin and food contact. Sustainability, and possible substitutes The record ends with an indication of whether or not the material derives from a renewable resource, and a list of alternatives should its use be undesirable. Aggregated measures: eco-indicators A designer, seeking to cope with many interdependent decisions that any design involves, inevitably finds it hard to know how best to use data of the type listed in Table 2. How are CO2 and S0O productions to be balanced against resource depletion, toxicity, or ease of recycling? This perception has led to efforts to condense the eco-information about a material into a single measure or indicator, giving the designer a simple, numeric ranking. To do this, four steps are necessary, shown in Figure 7. The first is that of classification of the data listed in Table 2 according to the impact each causes (global warming, ozone depletion, acidification etc.). The second step is that of normalization to remove the units (of which there are several in Table 2) and reduce them to a common scale (0-100, for instance). The third step is that of weighting to reflect 12 © 2021 ANSYS, Inc. GRANTA EDUPACK
the perceived seriousness of each impact, based on the classification of Step 1: thus global warming
might be seen as more serious than resource depletion, giving it a larger weight. In the final step, the
weighted, normalized measures are summed to give the indicator. Details can be found in EPS (1993),
Idemat (1997), EDIP (1998), and Wenzel et al (1997).

                                        Figure 7. The steps in calculating an eco-indicator.
                    Difficulty arises in step 3: there is no agreement on how to choose the weight factors.

The use of a single-valued indicator is criticized by some. The grounds for criticism are that there is no
agreement on normalization or weighting factors1, that the method is opaque since the indicator value
has no simple physical significance, and that defending design decisions based on a measurable quantity
like energy consumption or CO2 generation carries more conviction than doing so with an indicator.

The system we have developed is intended to provide information in whatever format the designer
chooses to use it. For this reason we have included data for two indicators where values are available: the
Dutch eco-indicator and the Swedish EPS indicator. At the time of writing there is no general agreement on
how best to used eco-data in design. But on one point there is international agreement (Kyoto Protocol,
1997): that the developed nations should progressively reduce CO2 emissions—a considerable challenge
in times of industrial growth, increasing affluence and growing population. Thus there is a certain logic in
using CO2 emission as the “indicator”, though it is more usual at present to use energy.

Sources of data

The raw data on which later manipulations are based are drawn from a number of sources, catalogued in
Table 3. Some take the form of publications or reports, some as software, some are available online. The
sources and their nature are listed in the References section of this report.

1 The different normalization and weight factors used in the Idemat, EDIP, and EPS methods, for instance, lead to radically
different rankings of materials.

13                                                © 2021 ANSYS, Inc.                                          GRANTA EDUPACK
Table 3. Data sources for eco-attributes of materials.
Nature of data Origins
World production, reserves and resources, US GS Mineral Commodity Summaries (1996, 1998, 2000)
prices for commodities www.plasticstechnology.com/pricing/resins
Abundance in sea water and the Earth’s crust Emsley J. (1998)
Average and minimum ore grade Smithells, C.J. (1998)
US GS Mineral Commodity Summaries (1996, 1998, 2000)
Embodied Energy Allen & Alting (1986)
APME (1992 –1999)
Boustead & Hancock (1979)
Boustead model 4 (1999)
BUWAL (1996)
Frischknecht R.(1996)
Plastics Industry (2000)
Szargut et al (1988)
Szokolay (1980)
Weivel and Stritz (1995)
Recycle Energy Chapman & Roberts (1993)
Plastics Industry (2000)
Recycling information www.recycle-steel.org, etc.
Eco-indicator Goedkoop et al (2000)
EPS value EPS (1993)
Standards ISO 14001 (1996)
ISO 14040 (1997, 1998, 1999)
5. Data estimates
Life cycle assessment (LCA) techniques2, now documented in standards (ISO 14040, 1997, 1998) analyze
the eco-impact of products once they are in service. These techniques have acquired a degree of rigor, and
now deliver essential data documenting the way materials influence the flows of energy and undesired
outputs of Figure 1. But if applied with full rigor, they are both time-consuming and expensive.
Streamlined LCA relaxes the rigor to allow an affordable first-look. But all of these require that the
product already exists, has lived, and died; without information derived from the product in service, LCA
methods, relying as they do on a quantitative breakdown of material and process-content of the product,
cannot be applied. LCA methods are an essential intermediate step in eco-accountability, generating
generally accepted information and establishing the credentials of an ability to analyze the eco-influence
of products. But it is clearly better to design-in the qualities we seek from the very start rather than
searching for ways to introduce them into a product that is already in production. This is the goal of eco-
design.
2 See, for example, Goedkoop et al 2000 (Eco-indicator method); EPS, 1993 (Environmental Priorities Strategy); MIPS – Schmidt-Bleek 1997,
1998, 1999 (Material Intensity per Service Unit method); Wenzel et al 1997, EDIP, 1998 (EDIP method); Bey, 2000 (Oil Point method).
14 © 2021 ANSYS, Inc. GRANTA EDUPACKTaking a material and process standpoint, three requirements emerge for an eco-design tool. First, the
tool should help with the concept stage when details are not yet set, and to do this it must be based on
function, not on quantity. The second is practicality: if designers are really going to use eco-information
in their work, the data must be easy to find, instantly accessible, and include—even if approximately—as
wide a range of materials and processes as possible. The third follows from this; eco-data of any sort
exist only for a tiny handful of materials and processes (perhaps 100 out of 60,000 or more); the advice
offered by LCA practitioners to those who ask for data for a non-documented material is “assume it is
like one that is documented”. This sits badly with the precision demanded by other aspects of LCA, and
supposes a deep enough knowledge of materials to be able to make an appropriate choice. So the third
requirement is that of developing more credible estimates, allowing greater confidence in the data and
the application of the method.
This cannot be achieved without some sacrifice of rigor. There is no suggestion here that loss of rigor is
desirable. The suggestion, rather, is that the best way forward lies in an adaptable approach, incorporating
breadth, using approximate methods based on the best currently available data, but with the capacity
to replace approximations with more precise methods and data as these become available. It is this
approach that we develop here.
Filling the holes: data estimation.
We have tried to find better ways for estimating missing data than that mentioned earlier: the use, as
a substitute, of data for a “similar” material that is characterized. This begs the question: what does
“similar” mean? Belonging to the same material class (meaning polymer, or metal, or ceramic), certainly,
but after that? Similar strength? Similar thermal conductivity? There are ways of defining “similarity”
but—without exploration—it is not obvious which way is helpful here.
Table 4. The classification used for estimation.
Exploration is possible by searching for
correlations, using physical reasoning to guide Material Families Material Classes
the choice. Taking embodied energy (units MJ/
Ceramic
kg) as an example, the correlation might be Ceramics
expected with the minimum economic ore- Cement and concrete
grade: the lower the grade, the greater the Alloy
mass of useless material that must be moved or Element
crushed or sifted to recover it. In fact, we find the Metals
Element (research purity)
correlation too poor to be of any use. Another
possibility is that of price. One might have lower Metal
expectations of this—price is influenced not Elastomers
only by the real cost of production but also by Polymers Thermoplastic
market forces. But we find that, on segregating Thermoset
materials into the families and classes of Table 4, Natural materials (general)
the correlation between embodied energy and Natural Materials
Wood
price averaged over eight years (evening out
Composite
some of the speculative elements) is remarkably
strong. Not, perhaps, so surprising—it has been Ceramic-based composite
suggested that, if an international currency Composites Metal-based composite
independent of nationality were needed, energy Polymer-based composite
might be the answer. Wood-based composite
15 © 2021 ANSYS, Inc. GRANTA EDUPACKMathematical fits to the data have been used to fill holes for commercially pure metals, for polymers, and
for ceramics. No claim is made that these are particularly precise, only that they are better—considerably
better—than the simple guess at a “similarity”.
Alloys, polymer blends, and composites are treated by assuming (when no direct measurements are
available) that a lower bound for energy and gas emissions is given by a linear combination of data for
their constituents—“a rule of mixtures”. (For metallic alloys even this does not always work: stainless
steels, for example, are not made by mixing commercially pure nickel and chromium into iron but by
using much cheaper ferro-chrome as alloy agents). The lower bound underestimates real energy inputs
because the process used to create the alloy from its ingredients itself requires energy, but—as discussed
in Section 3—this is usually small. As a bound it is useful, capturing (for instance) the effect of including
rare-earths and other alloying agents in otherwise cheap hosts. Composites are treated in a similar way:
the energy value is the weighted sum of the constituents, ignoring processing, and should again be seen
as a lower bound.
6. Using the data
The eco attributes are available within the MaterialUniverse data, accessible via the Granta Selector
software for research and industrial applications, and for teaching via its incorporation into the Granta
EduPack Eco Design Edition. It can be used for retrieval—as a reference source for environmental and
other information about a given material process—or it can be used for rational selection. Retrieval is
simply a case of browsing or searching the database and choosing the material of interest. The result is
illustrated in Table 5, which shows eco-attributes for one grade of aluminum.
Rational selection is typically a two-stage process in which we must first ask—as we did in Section 2—which
phase of the life cycle of the product under consideration makes the largest impact on the environment?
This audit process is described in our separate paper “The Granta EduPack Eco Audit Tool—A White
Paper”. The answer guides (Figure 8) the effective use of the data in substituting of selecting materials,
as we now discuss.
Table 5. The eco-attributes of one grade of aluminum alloy.
16 © 2021 ANSYS, Inc. GRANTA EDUPACKFigure 8. Rational use of the eco data starts with an analysis of the phase of life to be targeted. The decision then guides
the method of selection to minimize the impact of the phase on the environment.
The material production phase
If material production is the dominant phase of life it is this that we must target. Drink containers (Figure
9) provide an example: they consume materials and energy during material extraction and container-
production, but (apart from transport, which is minor) not thereafter.
Figure 9. Containers for liquids: glass, polyethylene, PET, and aluminum. All can be recycled.
Which carries the low penalty of embodied energy?
We use the energy consumed in extracting and refining the material (the embodied energy of Table 2)
as the measure; CO2, NOx, and SOx emissions are related to it, although not in a simple way. The energy
associated with the production of one kilogram of a material is Hm, that per unit volume is Hmρ where
ρ is the density of the material. The bar-charts of Figures 10(a) and (b) show these two quantities for
ceramics, metals, polymers and composites. On a “per kg” basis (upper chart) glass, the material of
the first container, carries the lowest penalty. Steel is higher. Polymer production carries a much higher
burden than does steel. Aluminum and the other light alloys carry the highest penalty of all. But if these
same materials are compared on a “per m3” basis (lower chart) the conclusions change: glass is still the
lowest, but now commodity polymers such as PE and PP carry a lower burden than steel; the composite
GFRP is only a little higher. But is comparison “per kg” or “per m3” the right way to do it? Rarely. To deal
with environmental impact at the production phase properly we must seek to minimize the energy, the
CO2 burden or the eco-indicator value per unit of function.
17 © 2021 ANSYS, Inc. GRANTA EDUPACKFigure 10 (a) and (b). The energy per unit mass and per unit volume associated with material production,
plotted with Granta EduPack.
To select materials with the lowest eco-impact per unit of function we make use of performance indices.
Performance indices that include energy content, CO2 burden or eco-indicator are derived in the same
way as those for weight or cost. Thus the best materials to minimize embodied energy of a beam of
specified stiffness and length are those with large values of the following index:
18 © 2021 ANSYS, Inc. GRANTA EDUPACK(7)
where E is the modulus of the material of the beam. The stiff tie of minimum energy content is best made
of a material of high E/Hmρ; the stiff plate, of a material with high E1/3/Hmρ and so on.
Selection for a constraint on strength works similarly. The best materials for a beam of specified bending
strength and minimum energy content maximize:
(8)
where σf is the failure strength of the beam-material.
Other indices follow in a similar way. TableTable 6. Examples of indices to minimize impact in the production phase.
6 contains examples of other indices for
eco-selection to minimize impact during Function Maximize*
the production phase of life. Materials Minimum energy content for given
with the lowest values of these, and which tensile stiffness
meet all other design constraints, are the Minimum CO emissions for given
2
best choice to meet the functions listed tensile strength
here. The method of deriving them is fully Minimum energy for given bending
documented elsewhere (Ashby 2011). stiffness (beam)
The Granta EduPack search engine allows Minimum energy for given bending
these combinations to be created, and stiffness (panel)
combined with other constraints to enable
Minimum CO2 for given bending
an optimized selection. Once a short-list strength (beam)
of potential candidates is established,
Minimum CO2 for given bending
supporting information can be sought for
strength (panel)
them via the references at the end of this
report or through the built-in web-links Minimum eco-indicator points for
given thermal conduction
library of the software.
*Hm=embodied energy content per kg E=Young’s modulus
Figures 11 and 12 are a pair of materials [CO2]=CO2 production/kg σf=failure strength
Ie=eco-indicator/kg ρ=density
selection charts for minimizing embodied
energy Hp per unit of function (similar
charts for CO2 burden can be made using the Granta EduPack software). The first shows modulus E
plotted against Hmρ; the guide-lines give the slopes for three of the commonest performance indices.
The second shows strength σf plotted against Hmρ; again, guide-lines give the slopes. The two charts give
a survey of data for minimum energy design. They are used in exactly the same way as the E-ρ and σf-ρ
charts for minimum mass design.
Most polymers are derived from oil. This leads to statements that they are energy-intensive, with
implications for their future. The two charts show that, per unit of function in bending (the commonest
mode of loading), most polymers carry a lower energy penalty than primary aluminum, magnesium, or
titanium, and that several are competitive with steel.
19 © 2021 ANSYS, Inc. GRANTA EDUPACKFigure 11. A selection chart for stiffness at minimum embodied energy. It is
used in ways detailed in Ashby (2011).
Figure 12. A selection chart for strength at minimum embodied energy. It is used in ways
detailed in Ashby (2011).
The product-manufacture phase
Vapor-forming methods are energy-intensive, casting and deformation processing are less so. Certainly
it is important to save energy in production. But higher priority often attaches to the local impact of
emissions and toxic waste during manufacture, and this depends crucially on local circumstances. Paper
making (to take an example) uses very large quantities of water. Historically the waste water was heavily
polluted with alkalis and particulates, devastating the river systems into which it was dumped. Today,
20 © 2021 ANSYS, Inc. GRANTA EDUPACKthe best paper mills discharge water that is as clean and pure as it was when it entered. Production sites of many heavily industrialized countries are terminally polluted; those producing the same materials elsewhere, using best-practice methods, have no such problems. Clean manufacture is the answer here. The use phase The eco-impact of the use phase of energy-consuming products has nothing to do with the energy content of the materials themselves—indeed, minimizing this may frequently have the opposite effect on use-energy. Use-energy depends on mechanical, thermal and electrical efficiencies; it is minimized by maximizing these. Fuel efficiency in transport systems (measured, say, by MJ/km) correlates closely with the mass of the vehicle itself; the objective then becomes that of minimizing mass. Energy efficiency in refrigeration or heating systems is achieved by minimizing the heat flux into or out of the system; the objective is then that of minimizing thermal conductivity or thermal inertia. Energy efficiency in electrical generation, transmission, and conversion is maximized by minimizing the ohmic losses in the conductor; here the objective is to minimize electrical resistance while meeting necessary constraints on strength, cost, etc. The product disposal phase The environmental consequences of the final phase of product life has many aspects. The aggregation of these into the single “indicator” does not appear to be a helpful path to follow. Most energy consumed in the production of metals such as steel, aluminum, or magnesium is used to reduce the ore to elemental metal, so that these materials, when recycled, require much less energy. Efficient collection and recycling makes important contributions to energy saving. Limited data are available for recycle energies, and for the fraction of current supply currently met by recycling. The simple Boolean (yes/no) classification in Table 2 signals that a given material can be recycled, reused in a lower grade activity, bio-degraded, incinerated, or committed to landfill. 7. Case studies The methods are illustrated below by case studies. The energy content of containers The problem. The containers of Figure 9 are examples of products for which the first and second phases of life— material production and product manufacture—are ones that consume energy. Thus material selection to minimize energy and consequent gas and particle emissions focuses on these. Table 7 summarizes the requirements. The masses of five competing container types, the material of which they are made, and their specific energy contents are listed in Tables 8(a) and (b). Production involves molding or deformation; approximate energies for each are listed. All five of the materials can be recycled. Which type carries the lowest energy penalty per unit of fluid contained? The method and results. A comparison of the energies in Tables 8 (a) and (b) shows that the energy to shape the container is 21 © 2021 ANSYS, Inc. GRANTA EDUPACK
always less than that to produce the material in the first place. Only in the case of glass is the forming
energy significant. The dominant phase is that of material production. Summing the two energies for
each material and multiplying by the container-mass per liter of capacity gives the ranking shown in
the second last column of Table 8 (a). The steel container carries the lowest energy penalty, glass and
aluminum the highest.
                                         Table 8(a). Details of the containers.

           Container Type               Material            Mass (g)        Mass/Liter Energy/Liter
                                                                               [g]       [MJ/L]
            PET 400 mL bottle               PET                  25               62                 5.4

             PE 1L milk bottle        High density PE            38               38                 3.2
            Glass 750mL bottle          Soda glass              325               433                8.2

              Al 440 mL can         5000 series Al alloy         20               45                 9.0

             Steel 440 mL can        Plain carbon steel          45               102                2.4

                     Table 8(b). Data for the materials of the containers (MaterialUniverse data).
                  Material           Embodied Energy                  Forming           Forming energy
                                        [MJ/kg]                       method               [MJ/kg]
            PET                                   84            Molding                       3.1
            PE                                    80            Molding                       3.1
            Soda glass                            14            Molding                       4.9
            5000 series Al alloy               200              Deep drawing                 0.13
            Plain carbon steel                    23            Deep drawing                 0.15

Crash barriers

The problem.
Barriers to protect driver and passengers of road vehicles are of two types: those that are static—the
central divider of a freeway, for instance—and those that move—the fender of the vehicle itself (Figure
13).

          Figure 13. Two crash barriers, one static, the other—the fender—attached to something that moves.
                                            Different eco-criteria are needed.

22                                            © 2021 ANSYS, Inc.                                           GRANTA EDUPACK
The static type line tens of thousands of Table 9. Design requirements for the crash barriers.
miles of road. Once in place they consume
no energy, create no CO2, and last a long Function Crash barrier
time. The dominant phases of their life Constraints Must be recyclable
are those of material production and Objective Maximize strength per unit embodied energy,
manufacture. The fender, by contrast, is OR
part of the vehicle; it adds to its weight Maximize strength per unit mass
and thus to its fuel consumption. The Free variables Choice of material
dominant phase is use. So, if eco-design
is the objective, the criteria for selecting
materials for the two sorts of barrier will differ.
In an impact the barrier is loaded in bending. Its function is to transfer load from the point of impact to
the support structure where reaction from the foundation or from crush-elements in the vehicle support
or absorb it (Table 9). We have seen that to transmit a bending load at minimum embodied energy
requires materials that maximize:
(9)
To do so at minimum weight requires instead materials with large values of:
(10)
Figures 14 and 15 plots these two quantities for metals, polymers, and polymer-matrix composites.
Figure 14 guides the selection for static barriers. It shows that embodied energy (for a given load
bearing capacity) is minimized by making the barrier from carbon steel or cast iron; nothing else comes
close. Figure 15 guides selection for the mobile barrier. Here CFRP (continuous fiber carbon-epoxy, for
instance) excels in its strength per unit weight, but it is not recyclable. Heavier, but recyclable, are alloys
of magnesium, titanium, and aluminum. Polymers, which rank poorly on the first figure, now become
candidates—even without reinforcement, they can be as good as steel.
Figure 14. Material choice for the static barrier is guided by the bending strength per unit of embodied energy. Cast irons,
carbon steels, or low alloy steels are the best choice. (Here the number of materials has been limited to 50 for clarity).
23 © 2021 ANSYS, Inc. GRANTA EDUPACKYou can also read