GREATER ESSEX LOCAL AGGREGATE ASSESSMENT 2020
(COVERING THE CALENDAR YEAR OF 2019).
←
→
Page content transcription
If your browser does not render page correctly, please read the page content below
GREATER ESSEX LOCAL AGGREGATE ASSESSMENT 2020 (COVERING THE CALENDAR YEAR OF 2019).
EXECUTIVE SUMMARY
This is the seventh Local Aggregate Assessment (LAA) produced on behalf
of the Greater Essex authorities1, reflecting the position at the end of 2019.
It should be noted that the Aggregate Survey is undertaken annually to
provide primary data for all sales and reserves information.

The Aggregate Survey that informs this LAA was undertaken during March
to May 2020, through much of which the nation was in lockdown for the
prevention of Coronavirus spread. Despite this, 92% of sites provided a
response. However, it cannot be subsequently inferred that any combined
figures presented represent 92% of their true value. Production rates vary
significantly across sites and, due to reasons of commercial confidentiality, it
would not be appropriate to speculate on those values which may have been
derived from those sites where surveys were not returned. As such, any
trend analysis factoring in the latest data must be treated with caution.

A national aggregate survey is currently being undertaken (summer 2020),
which hopes to capture all sales reported in 2019, including any sites that
did not have the opportunity to previously respond due to lockdown
restrictions. Any results provided via the National Survey will be considered
and reviewed in the next edition of the LAA which will be published in 2021,
which will also assess sales in 2020.

Extraction and Processing Facilities within Greater Essex

There are 33 sand and gravel quarries in Greater Essex, 23 of which were
active2. Of the 10 inactive sand and gravel quarries, four are considered as
long term ‘dormant’3 and six are permitted, but not actively extracting, as of
31 December 2019. In addition, during 2019, three sites are pending
determination and/or Legal Agreements and a single site ceased mineral
extraction/closed.

There are no hard-rock quarries and one further quarry produces sand and
gravel as well as silica sand. Greater Essex also has two brick clay quarries
and a single chalk quarry. These latter two types are not reported on
through the Local Aggregate Assessment as they are not classed as
aggregates. There were 43 processing facilities that add value to mineral
products co-located with mineral and transhipment facilities.

Sand & Gravel Sales

Sales increased between 2010 and 2019, from 2.99 million tonnes (Mt) to
3.17Mt. Within this time, the highest sales were in 2014 (4.37Mt) and lowest
in 2012 (2.3Mt). The ten-year average sales (2010 to 2019) figure (3.26Mt)
and the three-year sales (2017 to 2019) average (3.38Mt) are below the
apportioned tonnage of 4.45 Million tonnes per annum (Mtpa) provision
made in the adopted Development Plan. The last three years of sales show
a decrease from 3.41Mt in 2017 to 3.17Mt in 2019, which amounts to a
1
  Essex County Council, Southend-on-Sea Borough Council and Thurrock Council.
2
  Due to the Aggregate Survey that informs this LAA being undertaken during ‘lockdown’, this
total number of active sites is yet to be confirmed.
3
  Therefore, are omitted from the landbank and permitted preserve calculations.

FINAL Oct 2020                                                                          Page iii

Greater Essex Local Aggregate Assessment: 2019

decrease of 7%. However, some of this decrease could be attributed to the
lower than expected survey response rate due to staff being on furlough as a
result of the lockdown.

Sand and Gravel Permitted Reserves & Landbank

Permitted reserves were 33.10Mt in December 2019. The apportionment4
landbank stood at 7.44 years at the end of 2019, whilst the ten-year sales
average landbank stands at 10.14 years. Therefore, the landbank is
sufficient. In addition, at of the time of writing (September 2020) there exist
three pending permissions across Greater Essex, which would permit the
working of 5.5Mt of sand and gravel which, if granted and/or all legal
agreements are signed, would further increase the landbank.

Marine-Won Sand and Gravel

Greater Essex is served by the Thames and East Coast dredging regions,
with a total of 8.57Mt of material removed from the seabed in 2019. This
was an increase of 1.51Mt compared to that removed in 2018. Licenses
have been granted that permit the extraction of a total of 11.73Mt per annum
from the Thames and East Coast regions combined. At this rate, current
estimates suggest there are 29 years of primary marine aggregate
production permitted in the Thames Estuary and 15 years within the East
Coast region. This data is collected in a different manner to terrestrial sand
and gravel extraction and not impacted by data collection issues related to
COVID-19.

Imports and Exports

Across Greater Essex, there are 11 mineral transhipment facilities5. Whilst it
can be stated that nearly 1.6Mt of material was imported into Greater Essex
during 2019, there were not enough operators reporting on exportation to
present data, due to commercial confidentiality.

Secondary and Recycled Aggregate

It has been assessed that within Essex and Southend-on Sea, there is inert
recovery capacity of 2.118Mtpa, and that 1.05Mt of recycled aggregate was
produced in 20146. There is additional CD&E waste capacity within
Thurrock, which also make a contribution to the total amount of recycled
aggregate available within Greater Essex. During 2019, two permissions
were granted that would increase the inert recovery capacity in Greater
Essex, by at least 0.2Mtpa, which would therefore provide a potential total
capacity of approximately 2.3Mtpa, if these facilities were developed.

Across the whole of the Greater Essex Area a number of aggregate
recycling sites are co-located with other minerals and/or waste sites and are

4
  CLG (2009) National and regional guidelines for aggregates provision in England 2005-2020.
The Apportionment figure is that used to calculate the landbank in adopted EMLP (2014) and the
Thurrock Core Strategy and Policies for Management of Development (2015). The figure is
4.45Mtpa across both authorities.
5
  This consists of both rail and wharf transhipment facilities.
6
  This Is the latest data available

Page iv                                                                        FINAL Oct 2020
Contents
temporary in nature. Consequently, available capacity fluctuates. Additional
capacity will continue to be encouraged where located in accordance with
relevant mineral and waste plan policies.
It is not known whether secondary aggregates are produced in any
significant quantity, but the lack of heavy industry, in Essex at least,
suggests that there will be little.
2019 Headline Figures
Performance in Comparison
2019 with 2018
Land-won sand & gravel sales 3.17Mt
3.56Mt
(Million tonnes (Mt)) ( 11.0%)
Permitted reserves of sand and gravel at end of
33.10Mt
year 29.98Mt
( 10.4%)
(Million tonnes (Mt))
Landbank based on apportionment 7.44 years
6.74 years
(years) ( 10.4%)
Ten-year rolling annual average sales
(Mt) 3.26Mt
3.56Mt
( 8.4%)
(Ten-year period 2010 – 2019)
Landbank based on ten-year rolling average
10.14 years
sales 9.30 years
( 8.7%)
(years)
Three-year rolling average sales
(Mt) 3.38Mt
3.46Mt
( 2.3%)
(Three-year period 2017 – 2019)
1.60Mt
Wharf & Rail depot imports (Hard rock) 1.12Mt
( 42.9%)
Value cannot
Value cannot be
be provided8,
Wharf & Rail depot Exports provided7, due to
due to
(Sand & Gravel) commercial
commercial
confidentiality
confidentiality.
Source: Essex County Council (2020).
7
Even when amalgamating data for both types of transhipment facility, there remains too few
sites reporting the exportation of material from Greater Essex to provide data for reasons of
commercial confidentiality.
8
Ibid
FINAL Oct 2020 Page v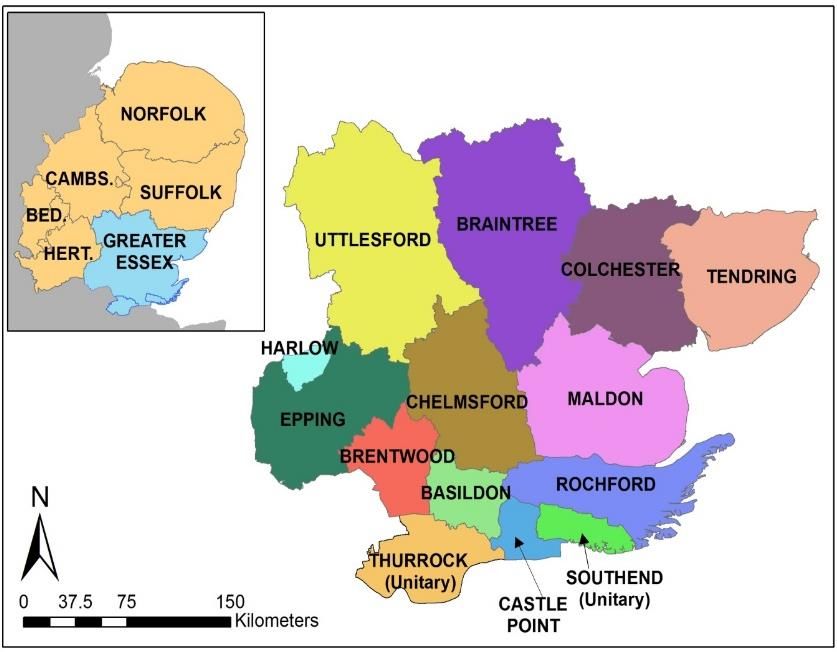
Greater Essex Local Aggregate Assessment: 2019

Page vi                                                    FINAL Oct 2020
CONTENTS

 1.           Introduction ................................................................................... 1
       1.1. Background ..................................................................................... 1
       1.2. Spatial Context ................................................................................ 1
       1.3. Summary of Key Planned Infrastructure Projects ............................ 1
            Major Construction Projects ............................................................ 3

 2.           At A Glance: Minerals In Greater Essex ...................................... 5
       2.1.   Geology ........................................................................................... 5
       2.2.   Primary Land-won Aggregate Facilities ........................................... 5
       2.3.   Transhipment Facilities ................................................................... 6
       2.4.   Processing Plants ........................................................................... 6

 3.           Land-Won Sand & Gravel ............................................................. 9
       3.1.   Introduction ..................................................................................... 9
       3.2.   Sand & Gravel Permitted Reserves .............................................. 10
       3.3.   Sales of Sand & Gravel ................................................................. 11
       3.4.   Sand & Gravel Landbank .............................................................. 12
       3.5.   Silica Sand Provision..................................................................... 14

 4.           Marine-Won Sand & Gravel ........................................................ 15
       4.2.   Marine Planning ............................................................................ 15
       4.3.   Dredging Areas & Wharf Facilities Serving Greater Essex............ 16
       4.4.   Marine Aggregate Landings .......................................................... 18
       4.5.   Planned Marine Contribution to Mineral Supply ............................ 21
       4.6.   Offsetting Land-won Production .................................................... 21

 5.           Imports & Exports of Land-Won Aggregate .............................. 23
       5.2. Methods of Mineral Transportation within Greater Essex .............. 23
       5.3. Approved & Pending Transhipment Applications in 2019 ............. 23
       5.4. Imports & Exports of Aggregate .................................................... 23
            Importation .................................................................................... 24
            Exportation .................................................................................... 24
       5.5. Potential Maximum Annual Throughput ........................................ 25

 6.           Secondary & Recycled Aggregate ............................................. 27
       6.1. Introduction ................................................................................... 27
       6.2. Recycled Aggregate Throughput & Capacity ................................ 27
            Essex & Southend-on-Sea ............................................................ 27
            Thurrock ........................................................................................ 28
       6.3. Approved & Pending Inert Recovery Facilities in 2019 ................. 29
       6.4. Potential Maximum Annual Throughput ........................................ 29
       6.5. Conclusion .................................................................................... 30

 7.           Conclusion................................................................................... 31

 Annex A Primary Extraction Facilities within Greater Essex .................. 35

 Annex B Permitted Processing Plants in Greater Essex (Dec 2019) ...... 41

FINAL Oct 2020                                                                                        Page vii
CONTENTS
 Annex C Permitted Reserves in Greater Essex (2000 - 2019)................. 46

 Annex D Apportionment & Landbank Data .............................................. 48

 Annex E Sales Data ................................................................................... 50

 Annex F Marine-Won Minerals.................................................................. 52

 Annex G Aggregate Recycling Facilities Within Greater Essex 2019 .... 54

 Annex H Local Plan Production & Indicative Future Housing
 Requirements .............................................................................................. 62

Page viii                                                                                 FINAL Oct 2020
1. INTRODUCTION
  1.1. Background
1.1.1.   Mineral Planning Authorities (MPAs) are required9 to produce a Local
         Aggregate Assessment (LAA) annually to ensure that there is a steady and
         adequate supply of aggregates. This LAA reports on the Greater Essex10
         position at 31 December 2019. It is to be noted that the Plan Area pursuant
         to the Essex Minerals Local Plan (2014) covers the administrative area of
         Essex only. Southend-on-Sea and Thurrock have their own Local Plans
         relevant to their own administrative areas.
  1.2. Spatial Context
                                    Map 1:   Spatial Context of Greater Essex
1.2.1.   Greater Essex is within
         the East of England,
         as identified in the
         map. It borders Kent
         and the London
         Boroughs of Enfield,
         Waltham Forest,
         Redbridge and
         Havering. Greater
         Essex is comprised of
         the administrative
         areas of Essex,
         Southend-on-Sea and
         Thurrock. Essex sits
         within a two-tier
         administrative system
         formed of the County
         Council and 12 Local Councils. Southend-on-Sea and Thurrock are unitary
         authorities who operate separately to Essex County Council and its
         constituent local authorities.
  1.3. Summary of Key Planned Infrastructure Projects
1.3.1.   The level of demand for mineral resources11 will be predicated on the amount
         and type of development in and close to Essex.

1.3.2.   The Mineral Products Association (MPA) published an overview of
         construction and mineral products markets in the East of England12. This
         included reference to the construction outlook between 2019 and 202313.

1.3.3.   Total construction is forecast to increase by an average of 1.2% per annum
         (pa) over 2019 to 2023 compared to overall expected growth of 1.3% pa on
         9
            Required by the National Planning Policy Framework (NPPF, 2019)
         10
            Greater Essex is formed of the Authorities of Essex, Southend-on-Sea and Thurrock. These are
         amalgamated in statistical/data collection activities to protect commercial confidentiality.
         11
            Including the generation and use of recycled/secondary aggregates
         12
            Mineral Products Association (Aug 2020) published an overview of construction and mineral
         products markets in the East of England
         13
            This forecast was produced in 2019, therefore does not account for the disruption caused by
         the coronavirus pandemic

         FINAL Oct 2020                                                                           Page 1
Greater Essex Local Aggregate Assessment: 2019
average for the UK. Growth is expected to be driven by private housing, (the
largest subsector in the region) with some additional support from public
sector construction in the housing and non-housing subsectors. The
extension in Beaulieu Park in Essex and redevelopment of Purfleet, (both
valued at £1 billion respectively) are noted as significant projects within the
East of England region.
Housing Delivery
1.3.4. The housing stock in Essex increased by approximately 7,300 new homes in
2018/19 to 642,320. A number of Essex authorities are preparing Local
Plans, which will continue to deliver significant new homes beyond 2033.
The majority of this growth is being directed to the existing major growth
centres in the County, along with strategic urban extensions. Further
options being explored potentially include a number of new garden
communities across Greater Essex. Whilst the scale of development is still
to be defined, such levels of development forecast housing growth will need
to be supported by significant new physical and social infrastructure. Figure
1 provides an indication of the possible scale and distribution of housing
growth as committed to in Local Plans.
Figure 1: Indicative Housing Growth as Committed to in Local Plans
(April 2019)
Notes: All asterisk explanations are provided in Annex H, Local Plan Production &
Indicative Future Housing Requirements (page 62)
Source: Essex County Council (2020)
Page 2 FINAL Oct 2020Introduction
Major Construction Projects
1.3.5. In addition to this growth, there are also major developments/construction
projects14 that are either planned, programmed or underway in Essex and/or
in adjoining authorities. These are set out in the table below.
Table 1: Summary of Key Infrastructure Projects
Infrastructure Potential Delivery
Lead Decision Pathway
Scheme Date
M11 Junction 7a ECC Planning Application 2022
M25, Junction 28 Highways England Nationally 2022/23
Significant
Infrastructure
Project
Chelmsford North ECC Planning Application 2024
East Bypass
A120/A133 Link ECC Planning Application 2024
Road and Rapid
Transit System
Beaulieu Park ECC/ Network Rail Planning Application 2025
Station
A12 Widening (19 – Highways England Nationally 2027/28
25) Significant
Infrastructure
Project
Lower Thames Highways England Nationally 2027/28
Crossing Significant
Infrastructure
Project
New A120 route ECC/ Highways 2028 or beyond
England
Bradwell B Nuclear China Generation Nationally Not defined
Power Station Nuclear Power Significant
Corporation (CGN) Infrastructure
and EDF Energy Project
A13 Widening Thurrock Highways Planning Application 2021
(A128 to A1014)
London Gateway DP World Local Development 2023 or beyond
Port Order
Tilbury 2 Port of Tilbury Nationally 2021/22
(Tilbury Port Significant
Expansion) Infrastructure
Project
14
This constitutes large one-off developments, urban extensions or new roads/transport
projects, that would generate any significant additional demand for aggregates and/or produce
significant quantities of waste.
FINAL Oct 2020 Page 3Greater Essex Local Aggregate Assessment: 2019
Source: Essex County Council (2020). Additional information is outlined in Annex H.
1.3.6. It is important to note that the A12 widening route announcement (28 August
202015), for the section between junctions 23 (Kelvedon South) to 25 (Marks
Tey), announcement builds on the October 2019 Preferred Route
Announcement for junctions 19 to 23. The result is a full preferred route for
the A12 Chelmsford to A120 widening scheme from Junction 19 to Junction
25. This would directly impact on the reserves and availability of aggregate
and non-aggregate reserves/sites, as specified in the Essex Mineral Local
Plan.
1.3.7. With regard to Southend-on-Sea specifically, there are currently no major
developments/construction projects that have completed the planning
process, although there are noted to be three such developments currently
being developed. These are Seaways (in the appeals process); Fossets
Farm (including Football Stadium is in the planning stage); and Queensway
regeneration application is expected to be received by the Authority
imminently.
1.3.8. Highway maintenance is a major and on-going activity which gives rise to
‘road planings’. Road planings are produced when the surface layer of a
tarmac road or footpath is removed. They are also known as road scalpings
or road scrapings and can be used as further road materials as an
alternative to primary aggregates. Their use is considered environmentally
sound as bitumen is a natural substance and re-using them also reduces
pressure on quarried aggregate stocks. The tonnage of Road Planings
arising Essex and Thurrock Authority Areas in 2019 was 70,842 tonnes.
15
Highways England (Aug 2020) A12 Chelmsford to A120 widening scheme
Page 4 FINAL Oct 20202. AT A GLANCE: MINERALS IN GREATER ESSEX
2.1. Geology
2.1.1. Geology dictates where viable mineral resources occur and consequently
where extraction can take place. The predominant economic mineral is
sand and gravel, but Greater Essex also contains silica sand, brick clay,
brickearth and chalk. Sales figures within this report only relate to sand and
gravel and imported crushed rock. Silica sand, brick clay, brickearth and
chalk are not classed as aggregates and are therefore not required to be
reported on though the Local Aggregate Assessment. However, the
inclusion of silica sand is made to provide a fuller picture of the provision of
the main minerals in Greater Essex.
2.2. Primary Land-won Aggregate Facilities
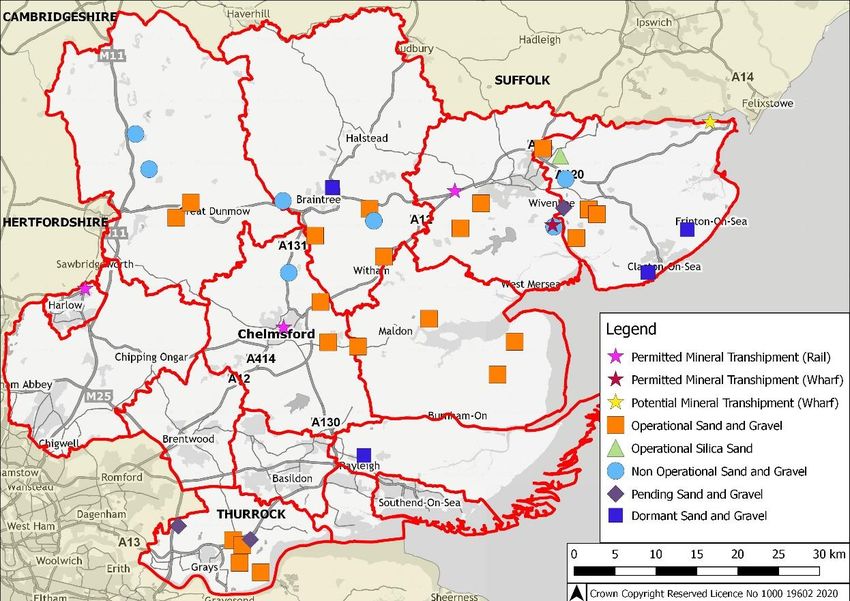
2.2.1. There are 33 sand and gravel
quarries in Greater Essex, 23 Figure 2: Sand & Gravel Quarries
of which were active16. Of the
10 inactive sand and gravel
quarries, four are considered
as long term ‘dormant’17 and
six are permitted, but not
actively extracting in Greater
Essex as of 31 December
201918 as presented in Figure
2. In addition, during 2019,
three sites are pending
determination and/or Legal
Agreements and a single site
ceased mineral
extraction/closed.
2.2.2. The Aggregate Survey 2019
revealed that there was at
least 3.23Mtpa potential sand
and gravel production Source: Essex County Council (2020)
capacity19. There is assumed
to be significantly more
capacity within Greater Essex, as this figure is based on a 59%20 response
rate for this particular aspect of the Aggregate Survey.
2.2.3. There are a further four facilities extracting other minerals within the Greater
Essex area:
16
Due to the Aggregate Survey that informs this LAA being undertaken during ‘lockdown’, this
total number of active sites is yet to be confirmed.
17
Therefore, are omitted from the landbank and permitted preserve calculations.
18
As listed within Annex A. This figure is a result of the aggregate Survey being undertaken
during the furlough period; this could be subject to change.
19
Taking account of plant capabilities and planning restrictions
20
The overall response rate for the survey was 93%. Of these responses only 59% of sites
provided potential sand and gravel production capacity
FINAL Oct 2020 Page 5• One site specifically extracting silica sand;
• Two extracting brick clay;
• One extracting chalk.
2.3. Transhipment Facilities
2.3.1. Transhipment facilities provide for the movement of minerals over long
distances and are typically rail or water based. These facilities can be
thought of as ‘virtual quarries’ as mineral can be sold and distributed from
these sites. Within Greater Essex there are five rail facilities and six
wharves (of which one is inactive).
2.3.2. The location of the transhipment facilities in Greater Essex is shown in Map
2 below.
Map 2: Mineral Extraction & Transhipment Sites In Greater Essex (31
December 2019)
Source: Essex County Council (2020). The data that informs this table is in Annex A.
2.4. Processing Plants
2.4.1. On a number of extraction sites, primary processing occurs, producing a
higher quality final product as well as allowing more sustainable use of
aggregate. This can take a number of different forms such as crushing,
sieving, de-watering and through exploitation of physical and/or chemical
properties.
2.4.2. Secondary processing can also occur on extraction sites. This differs from
primary processing in that it makes a higher value final product through
manufacturing of the original material. Examples of secondary processing
are concrete batching, roadstone coating and brick/tile/block making.
Page 6 FINAL Oct 2020At A Glance: Minerals In Greater Essex
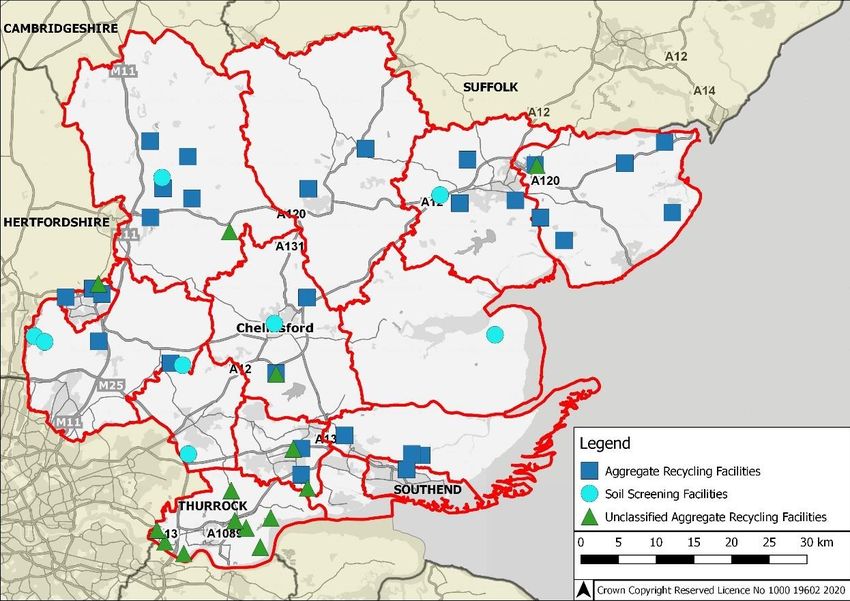
2.4.3. Any form of processing
allows for a greater range Figure 3: Processing Plant at Mineral
of products to be Extraction/Transhipment Sites
produced on site and
contributes to the
economic viability of
mineral developments.
Processing also reduces
mineral miles, which is
the term given to the
distance aggregate
travels from its extraction
point to its end use. The
map below shows where
the co-located (with Source: Essex County Council (2020)
primary extraction and
transhipment sites)
primary and secondary aggregate processing facilities are located.
2.4.4. Within Greater Essex there were 4321 processing facilities that add value to
mineral products, which have been permitted by the Mineral Planning
Authority.
Map 3: Primary and Secondary Aggregate Processing Facilities In
Greater Essex (31 December 2019)
Source: Essex County Council (2020)
21
One of which is located at a transhipment facility. (Harlow Mill)
FINAL Oct 2020 Page 7Page 8 FINAL Oct 2020
3. LAND-WON SAND & GRAVEL
  3.1. Introduction
3.1.1.   The NPPF requires that Mineral Planning Authorities (MPAs) plan for a
         steady and adequate supply of sand and gravel by maintaining a landbank
         of at least seven years22.

3.1.2.   Within Greater Essex the primary method of calculating the sand and gravel
         landbank is via the annualised apportionment as adopted through policy,
         which was based on the “National and Sub-national Guidelines for
         Aggregates Provision in England”, (2005 – 2020), and which provided a
         figure of 4.45Mtpa for Greater Essex.

3.1.3.   The NPPF however states that mineral provision should be based (inter-alia)
         on a rolling average of ten years’ sales data and other relevant local
         information. This is ‘sense checked’ through an average of the last three-
         years of sales, as advocated by the PPG. For the purposes of this years’
         edition of the LAA the ten-year rolling average sales is calculated from 2010
         to 2019. Henceforth, any reference to ten-year rolling average sales is
         describing this time-period.

3.1.4.   Both landbank calculation methods are presented later in this section, to
         ensure the adopted policy in the MLP is accurately reflected, whilst also
         acknowledging the ten-year rolling sales figure.

3.1.5.   Data contained within this chapter is based on information provided to the
         Mineral Planning Authority by operators in Greater Essex via the annual
         Aggregate Survey. This provides the most accurate information available, at
         the lowest reporting level, at which commercial confidentiality can be
         maintained. However, the information in this LAA is only as accurate as the
         information provided within the survey returns and therefore, may be subject
         to inaccuracies such as:

         •    Operator(s) may not provide information on site(s) within their control for
              various reasons;
         •    Accidental errors on the form, not able to be detected by the MPA.

3.1.6.   It should be noted that the Aggregate Survey that informs this LAA was
         undertaken during March to May 2020, much of which the nation was in
         lockdown for the prevention of Coronavirus spread. Despite this, 92% of
         sites provided a response. However, it cannot be subsequently inferred that
         any combined figures presented represent 92% of their true value.
         Production rates vary significantly across sites and, due to reasons of
         commercial confidentiality, it would not be appropriate to speculate on those
         values which may have been derived from those sites where surveys were
         not returned. As such, any trend analysis factoring in the latest data must be
         treated with caution.

         22
           Landbanks for seven years are required for sand and gravel (NPPF Paragraph 207, f). The
         landbank is determined by comparing the permitted reserve and the estimate of the demand of
         mineral per annum.

         FINAL Oct 2020                                                                       Page 9
Greater Essex Local Aggregate Assessment: 2019
3.1.7. The effect of this under-reporting will impact on sales and reserves figures
as well as on the landbank.
3.1.8. A national aggregate survey is currently being undertaken (summer 2020),
which hopes to capture all sales undertaken in 2019, including any site(s)
that did not have the opportunity to respond due to lockdown restrictions.
Any results provided via the National Survey will be considered and
reviewed in the next edition of the LAA which will be published in 2021,
which will include sales reported in 2020.
3.2. Sand & Gravel Permitted Reserves
Figure 4: Permitted Sand & Gravel Reserves in Greater Essex (2000 to
2019, 20 years)
Source: Essex County Council (2020).
Note 1 2019 data collection impacted by furlough due to COVID-19 and therefore
sales are potentially under-reported.
Note 2: Y axis not at zero. The data that informs this table is located in 0
3.2.1. There has been a clear reduction in the amount of mineral permitted for
extraction in Greater Essex over the last 20 years. Actual permitted
reserves were 68.42 million tonnes (Mt) in 2000, but at the end of 2019
stood at just 33.10Mt. This does however equate to an increase of 10%
from the 2018 value (29.98Mt). The graph above also identifies the amount
of reserve that was pending determination and/or legal agreements as of
31st December 2019, which is important in terms of understanding delivery of
local plans and aggregate. The “pending reserve” is 5.5Mt across both
Essex and Thurrock Mineral Planning Areas and may or may not be added
to the permitted reserve in the future. If this 5.5Mt was added to the
permitted reserve, it would total 38.60Mt.
3.2.2. This overall 20-year reduction in permitted reserves is the result of the rate
of sales being higher than the rate of material being added to the reserve
Page 10 FINAL Oct 2020Land-Won Sand & Gravel
through planning permissions. This local reduction follows a national trend
and is not considered to be a significant local planning issue as the sand and
gravel landbank remains above the minimum seven years.
3.2.3. During 2019, 14 applications relating to sand and gravel extraction were
determined, of which:
• Three23 planning applications had their relevant legal agreements signed,
which boosted the permitted reserve by 6.3Mt;
• Three were pending determination and/or pending subject to the signing
of legal agreements and would increase the permitted reserve by 5.5Mt24;
• Six applications were for operational changes and/or extensions of time
and had no impact on the permitted reserve; and
• The remaining two, also related to operational/site alterations, are
pending determination.
3.3. Sales of Sand & Gravel
Figure 5: Greater Essex Sales of Land Won Sand & Gravel (2000 to
2019, 20 years)
Source: Annual collated Aggregate Survey data, correct as of 31st December annually.
Note 1 2019 data collection impacted by furlough due to COVID-19 and therefore
sales are potentially under-reported.
Note 2: Y axis not at zero. The data that informs this table is located in Annex D.
3.3.1. In similarity to the reduction seen in the amount of permitted reserves, there
has been a downward trend in sand and gravel sales across the previous 20
years, although this has not been uniform. Sales in 2000 were recorded as
4.04Mt but after fluctuating, in 2019 reduce to 3.17Mt. More recently,
following a reduction in sales from a peak in 2014 (4.37Mt, just 2% below the
annual apportionment, as set out in current Guidelines), sales had been
23
ESS/19/17/BTE (Rayne Quarry), ESS/01/18/CHL (Sheepcotes farm) & ESS/03/18/BTE
(Bradwell Quarry
24
ESS/17/18/TEN (Wivenhoe Quarry,3.8Mt), 19/01799/FUL (Medina Farm, 0.2Mt) and
19/01709/FUL (Orsett Quarry &Walton Hall Farm, 1.5Mt)
FINAL Oct 2020 Page 11Greater Essex Local Aggregate Assessment: 2019
generally increasing up until 2019, where they then reduce to a similar level
experienced in 2013 (3.18Mt). However, as previously set out, survey
returns were not received for all active sites due to staff being furloughed
and as such the dataset is incomplete, and should therefore be considered
an interim value, until such time all returns can be provided. Therefore, this
apparent reduction in 2019 must be treated with caution and the reported
level of sales is likely be lower than the level of sales that actually occurred.
3.3.2. Nevertheless, it is a requirement for the LAA to report on the ten-year rolling
average sales. The PPG also requires an assessment of the last three
years of rolling average sales to help establish any particular trend in sales.
3.3.3. It should be noted that all of the average sales information will be impacted
by the reduction in survey returns covering sales in 2019, which potentially
serves to depress the overall averages. The following sales averages are
considered to be interim as the intention is to update these in the next LAA
when a more complete dataset will be obtainable. When comparing these
interim 2019 sales (3.17Mt, as noted above), it can be seen that the current
level of sales has fallen below all averages specified. The interim historic
sales average (20 year, 2000-2019) is 3.64Mt. The interim ten-year rolling
average sales figure decreased slightly to 3.26Mt, which would be an 8.4%
reduction from the average of 3.56Mt recorded over the previously reported
ten-year period (2009 to 2018). The interim three-year average sales figure
(2017 to 2019) stands at 3.38Mt.
3.3.4. The annualised plan provision apportionment value is 28.7% higher than the
2010-19 ten-year rolling sales average value, with sales not exceeding the
apportionment value since 2002 (when the apportionment stood at
4.55Mtpa). It is noted that the current ten-year rolling average sales figure
currently includes the period of recession and austerity, which is acting to
depress the average ten-year rolling average, relative to the current level of
reported sales. Importantly, the interim sales in 2019 were 3.1% below the
ten-year rolling average sales figure (2010 – 2019) of 3.26Mt. This has not
occurred since 2014, and may be a result of the incomplete dataset, which
would question the appropriateness of adopting that figure as a basis for
mineral provision in Greater Essex.
3.3.5. When considering the three-year rolling average sales, it can be seen in
Figure 5, that the sales of sand and gravel are decreasing to its lowest figure
since 2014. This is again likely due to the under-reporting the actual sales
within Greater Essex that occurred in 2019, due to the data collection impact
by furlough (COVID-19).
3.4. Sand & Gravel Landbank
3.4.1. Landbanks are calculated by dividing permitted reserve by the annual
amount of mineral to be extracted; and is reported in years. This value is the
time the landbank will last before it is exhausted, if no further mineral is
permitted for extraction.
3.4.2. As previously noted, a caveat to this data is that 2019 data collection was
impacted by furlough due to COVID-19 and therefore the calculated
landbank for 2019 must be treated with caution.
Page 12 FINAL Oct 2020Land-Won Sand & Gravel
3.4.3. As of December 2019, when using the annualised plan provision method of
calculation, the landbank stood at 7.44 years, an increase compared to
December 2018, when it stood at 6.74 years. When using the ten-year
rolling average sales method, the landbank is calculated as being 10.14
years, compared to 9.30 years recorded in the previous year. Both values
are presented in the figure below, which identifies the landbank value at the
end of each year, as informed by the annual Aggregate Survey.
Figure 6: Greater Essex Landbank (2010 to 2019)25
Source: Essex County Council (2020)
Note1 2019 data collection impacted by furlough due to COVID-19 and therefore
sales are potentially under-reported.
Note2: Y axis not at zero. The data that informs this table is located in Annex D
3.4.4. It can be seen that both landbank calculation methods have similar peaks
and troughs, although the ten-year sales method consistently results in a
higher landbank than the apportionment method. Importantly, both show at
least a seven year landbank as of 31 December 2019, with the prospect
further improved when including the ‘pending reserve’ in the landbank
calculation (Figure 6). When this ‘pending’ reserve of 5.5Mt is also
considered, it would provide an 8.67-year annualised landbank and an
11.83-year landbank under the 10-year rolling average sales method of
calculation. However, with survey returns being incomplete due to staff at
certain sites being on furlough, there is the potential that sales have been
underreported. If this is the case, the implication is that the landbank figure
in the figure above will also be overreported.
3.4.5. The Essex Minerals Local Plan is currently being assessed/reviewed due to
the statutory need to review Development Plans within five years of
adoption. The impacts of the pandemic have delayed the timetable for the
Issues and Options (Reg 18) consultation, with no current update to the
25
Prior to 2009 the apportionment was 4.55mpta, and 4.45Mtpa from 2009 onwards.
FINAL Oct 2020 Page 13Greater Essex Local Aggregate Assessment: 2019
timetable. The Essex Minerals and Waste Development Scheme will be
updated in due course with a revised timetable for all required consultation
events.
3.5. Silica Sand Provision
3.5.1. Although silica sand is not classed as an aggregate its inclusion is made to
provide a fuller picture of the provision of the main minerals in Greater
Essex.
3.5.2. Silica sand is produced at a single site within Greater Essex which is located
at Martells Quarry in Ardleigh. Therefore, it is not possible to provide sales
data for reasons of commercial confidentiality. The currently extant
permission for the site is planning permission reference ESS/53/17/TEN,
which was implemented 20 September 2018.
3.5.3. At the time of developing the now adopted Minerals Local Plan, the relevant
extant permission was application reference ESS/18/07/TEN, which
provided 0.42Mt of material. This permission described the proportional split
of the resource as 54% silica sand to 46% sand and gravel and provided the
processing plant capacity to produce silica sand which is 0.045Mtpa.
3.5.4. In order to maintain the statutory ten-year minimum landbank for silica sand,
there was a requirement to allocate an additional 0.39Mt across the plan
period, therefore an extension of the site was allocated at Slough Farm
within the Essex Minerals Local Plan (2014). This provided a total estimated
mineral yield at the site of 0.86Mt, of which 0.46Mt comprises of silica sand.
The assumed annual output of the site remains at 0.045Mtpa. As of
31 December 2019, an application on this allocated site has not been
submitted. However, it should be noted that during 2019, a Screening
Opinion request was submitted and considered with relevant pre-application
advice provided (ref: ESS/92/19/TEN/SO), with an application pending
validation in August 2020.
Page 14 FINAL Oct 20204. MARINE-WON SAND & GRAVEL
4.1.1. Marine-won aggregates are an alternative to those extracted from the land
although cannot always act as a direct substitution. They can be used for
some of the same purposes including a variety of construction purposes e.g.
road sub-base, land reclamation and beach nourishment.
4.1.2. In contrast to the earlier aspects of this document, the data collection for
marine-won sand and gravel has not been impacted by furlough due to
COVID-19 because a different collection technique was undertaken by the
Crown Estate.
4.2. Marine Planning
4.2.1. The working of marine resources has substantial economic, environmental
and social value. However, increasing additional pressures such as large-
scale renewable energy developments, fishing, as well as demand for
aggregate, led to concerns over marine degradation. The Marine and
Coastal Access Act (2009) set out the mechanism for marine planning,
which aims to tackle these concerns26.
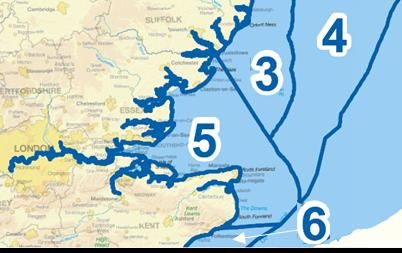
Figure 7: Marine Planning Areas Close to Greater Essex
Key: 3= East Inshore, 4 = East Offshore, 5 = South East Inshore & 6 = South
Inshore (not applicable for the purposes of this report)
Source: Essex County Council (2020) as derived from MMO Marine Planning Areas in
England
4.2.2. A key tool are marine plans, which contribute to more effective management
of marine activities and reduce the degradation of these habitats. Initially
there was a limited evidence-base, meaning decisions were undertaken on a
risk-based approach to accommodate uncertainty. Marine plans are
monitored with a view to revision in similarity to terrestrial based Local Plans.
26
Houses of Parliament PostNote Number 388 (Sept 2011) ’Marine Planning’
FINAL Oct 2020 Page 15Greater Essex Local Aggregate Assessment: 2019
4.2.3. In England, the Marine Management Organisation (MMO) brings together
planning, licensing and enforcement. The marine planning area closest to
Greater Essex is covered by the ‘South East Marine Plan’. This covers an
area of approximately 1,400 kilometres of coastline stretching from
Felixstowe to near Dover, a total of over 3,900km2 of sea. It is, however,
highly likely that the areas ‘East Inshore’ and East ‘Offshore’, could also
supply marine aggregate to the Greater Essex area, as identified in Figure 7.
4.2.4. It is noted that there are three aggregate specific policies (AGG1, AGG2 and
AGG3) in the emerging South East Marine Plan which effectively serve as
safeguarding policies against the potential of other proposals e.g. offshore
wind farm developments compromising the ability to extract known
aggregate resources.
4.2.5. Both the East Inshore and Offshore plans were adopted in June 2014, but
the South East plan is currently in an iterative process of option
development. The South East Inshore Marine Plan Draft for consultation
(and accompanying documents) were published In January 2020, with
consultation closing in April 2020. This was the final stage of statutory public
consultation before the Plan is submitted to the Secretary of State for
Environment, Food and Rural Affairs for adoption.
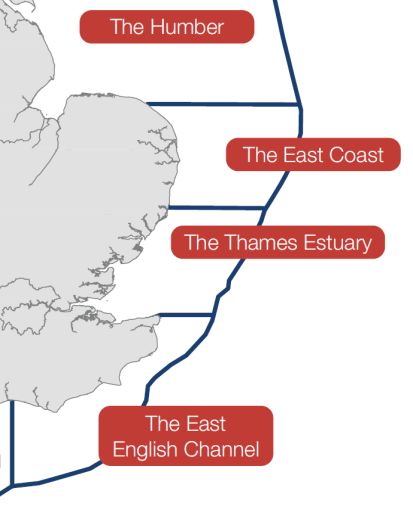
4.3. Dredging Areas & Wharf Facilities Serving Greater Essex
4.3.1. Ports can be considered as ‘virtual
quarries’ due to their ability to sell and Figure 8: Local Dredging
distribute mineral, whilst many also have Regions
processing facilities. The marine-won
material landed in the vicinity of Greater
Essex is mainly sourced from the Thames
Estuary Licensed Area, as identified in
Figure 8. This area extends eastwards
from Aldebrough in Suffolk to a line
extending east from Margate in Kent. To
the north of Aldeburgh is the East Coast
Licensing area and to the south of
Margate is the English Channel region.
4.3.2. The National and Regional Guidelines for
Aggregate Provision in England 2005 –
2020, assumed 14 million tonnes (Mt) of
Source: As derived from The
marine sand and gravel would be landed Crown Estate: Capability
in the East of England during that time. and Portfolio 2019
This equates to 0.93Mt per year, although
is not apportioned to individual authorities.
4.3.3. Although marine-won minerals contribute to the Greater Essex mineral
supply, across Greater Essex there are only ports in Thurrock that accept
marine won aggregate, with other landing points in proximity being in
adjoining authorities, namely Ipswich and within the Thames Estuary. The
ports with the potential to serve Greater Essex are shown in Table 2 and
Map 4 below. The map also identifies the licensed dredging areas closest to
Essex, alongside new dredging application areas and exploration areas.
Page 16 FINAL Oct 2020Marine-Won Sand & Gravel
Table 2: Wharves with the Potential to Serve Greater Essex (2019)
Thames Region
Landing Port Wharves
(Standard Name) / (Alternative Name(s))
Locality
Barking (London) Barking, Docklands Wharf
Cliffe (Kent) Alpha Wharf, Cliffe, North Sea Terminal
Dagenham
Hanson/ARC Dagenham, Dagenham
(London)
Denton (London) Denton, Denton B.A.D, Denton Sand, J Clubbs
Erith (London) Erith, Pioneer Wharf
Felixstowe (Suffolk) Felixstowe27
Greenhithe
Greenhithe
(London)
Greenwich Angerstein, Blackwall Wharf, Charlton, Delta Wharf, Greenwich,
Wharves (London) Murphy's Wharf, Phoenix Wharf, Victoria Deep Wharf
Canning Town, Cargo Fleet Wharf, Clarence Wharf, East India
London Docklands
Dock, Heron Quay, Millwall, Orchard Wharf, Peruvian Wharf,
Wharves (mostly
Rotherhithe, Silvertown, Thames Wharf, Thamesmead, Union
disused, (London)
Wharf, Victoria Wharf
Northfleet (Kent) Northfleet, Northfleet Brett, Robin's Wharf
River Medway
Ridham, Queenborough
Wharves (Kent)
Swale Wharves
Rochester, Rochester Hanson, Sheerness
(Kent)
Tilbury (Thurrock) Tilbury Stema
Thurrock
Purfleet, Purfleet PAL, Thurrock, West Thurrock
(Thurrock)
East Coast Region
Landing Port
Wharves
(Standard Name) /
(Alternative Name(s))
Locality
Ipswich (Suffolk) Hanson/ARC Ipswich, Brett Aggregates Ipswich
Lowestoft (Suffolk) Lowestoft
Source: The Crown Estate: Marine Aggregates Summary of Statistics (2019)
27
Felixstowe is counted as Thames Estuary (with the boundary with East Coast being roughly
27km north at Aldeburgh)
FINAL Oct 2020 Page 17Greater Essex Local Aggregate Assessment: 2019
Map 4: Marine Dredging Areas in Proximity to Greater Essex (2019)
Source: As adapted from Crown Estate: Marine Aggregates - Capability & Portfolio
2019 (2020) pages 8 and 9
Note: Each landing port will have a number of associated wharves. For example, the
landing port of West Thurrock includes the wharves of Purfleet and Thurrock as
noted in Table 2 above.
4.3.4. Paragraph 204(e) of the Revised NPPF states (inter-alia) that MPAs should
safeguard existing, planned and potential facilities for bulk mineral transport
including those for marine-dredged materials.
4.4. Marine Aggregate Landings
4.4.1. The Crown Estate collects statistics regarding marine-won mineral landed at
its ports, although these do not define the mineral’s final destination28.
Resultantly, the figures do not relate to the amount of marine-won aggregate
used within any one location, rather it is the amount landed. In this case
marine won aggregate landed in the Thames Estuary and/or at Ipswich
would usually be used within close proximity to these ports, namely within
Essex, Thurrock, Southend-on-Sea, Kent, Suffolk and London, but
potentially also further afield. However, due to their mass, landed minerals
do not have a large road based economically viable transport distance, so it
is likely these marine-won minerals will be used in the surrounding vicinity. It
is suggested that the average road delivery distance (of any aggregate) is
28
Unless it is sourced for a specific ‘significant’ project. Such projects are detailed in Crown
Estate: Marine Aggregates – Capability and Portfolio (2019) pages 14 and 15 and include locally
Container Terminal, Felixstowe, London Array Wind Farm, Thames Barrier, London, Crossrail,
London and numerous other major London projects. No such significant projects were listed
within Greater Essex.
Page 18 FINAL Oct 2020Marine-Won Sand & Gravel
38km (24 miles)29, with the cost often doubling for each 30 miles travelled.
As such aggregates are likely to only be transported long distances when it
is absolutely necessary30. BGS31 studies support this and suggests that
60km (37 miles) is the maximum typical distance bulk aggregates travel by
road. It has been concluded that although this isn’t stated as an absolute
maximum (viability would be considered on a case by case basis) it has
been inferred that travel distances of large volumes of aggregate would not
likely be greater than 37 miles. Loads may travel further, but viability
reduces rapidly the further afield it travels.
4.4.2. A Crown Estate Report32 identifies dredging and landing statistics in 2019, as
shown in the figure below. This highlights the total marine aggregate
extracted from the Thames Estuary Area, the additional amount that has
permission to be extracted and total marine aggregates landed at the
Estuary’s ports. It can be seen that a total of 1.3Mt of marine aggregate
were removed from the sea bed in 2019, meaning 39% of the annually
permitted extraction occurred. Comparatively, in 2018, 88% of the permitted
removal occurred, with the last ten-year average being 68%.
Figure 9: Marine Aggregate Extraction in the Thames Estuary Region
(2010 to 2019)
Source: Essex County Council (2020), as derived from data contained within the Marine
Aggregates - The Crown Estate Licences, Summary Of Statistics (Crown
Estate) reports between 2010 and 2019.
29
SustainableConcrete.org referenced the source as the Concrete Centre 2010
30
Mineral Products Association - Aggregates
31
British Geological Survey Planning Matters Factsheet “Construction Aggregates”, BGS, 2007
32
Crown Estate (2019) Marine Aggregates - The Crown Estate Licences, Summary Of Statistics
2019, Licences to dredge Marine Minerals on page 2 and Landing Statistics for dredged primary
aggregates on page 4 (East Coast) and page 5 (Thames Estuary)
FINAL Oct 2020 Page 19Greater Essex Local Aggregate Assessment: 2019
4.4.3. The above figure shows that there was a total of nearly 8.1Mt landed within
the Thames Estuary area during 2019, which is significantly more than the
total removed (1.3Mt). This means that a significant quantity (6.75Mt) was
extracted from other licenced areas (such as the East Coast and East
English Channel) and subsequently landed within the Thames Estuary Area,
presumably to assist with development within Greater London and
surrounding areas.
4.4.4. According to the Crown Estates Summary of Statistics (2019), only
188 thousand tonnes were landed within the East Coast region in 201933,
whilst just over 7.2Mt were removed through extraction. This means that a
significant amount was extracted but landed in other regions.
4.4.5. The following figure details the amount of marine-won mineral landed in
ports within London, Thurrock, Kent and Suffolk. It is considered that marine
dredged minerals landed at these ports have the capacity to be used in
Greater Essex.
Figure 10: Marine-Won Mineral Landed in Ports that Serve Greater
Essex (2010 to 2019)
Source: Essex County Council (2020) as derived from The Crown Estate, Summary of
Statistics, 2010 – 2019
The data that informs this table is located in Table 12.
4.4.6. There has been a general increase in the amount of marine-won aggregate
landed between 2010 and 2019, from 5.49Mt to 8.27Mt, representing an
33
Crown Estate (2019) Marine Aggregates - The Crown Estate Licences, Summary Of Statistics
2019, Licences to dredge Marine Minerals on page 2 and Landing Statistics for dredged primary
aggregates on page 4 (East Coast) and page 5 (Thames Estuary)
Page 20 FINAL Oct 2020Marine-Won Sand & Gravel
increase of 40%. Despite this general increase however, 2019 had a 3%
decrease in tonnes landed when compared to 2018 figures.
4.4.7. When ports are analysed by administrative region, since 2010 there has
been an overall increase in the marine-won aggregate coming into London
ports, (75%). Kent, comprising of three wharves, has seen an increase of
24% since 2010, whilst during the same period, Suffolk comprising of a
single wharf, has had a 65% increase in the amount of aggregate landed
whereas Thurrock, comprising a single wharf, saw a decrease of 58%34.
4.5. Planned Marine Contribution to Mineral Supply
4.5.1. Greater Essex has the potential to be served by the Thames and East Coast
dredging regions. Licenses have been granted that 8.3 Million Tonnes (Mt)
and 7.93Mt (respectively) can be extracted from these two regions annually.
This would total 11.73Mt per annum from the two regions combined. It is
stated by the Crown Estate35 that at this rate, current estimates suggest
there are 29 years of primary marine aggregate production permitted in the
Thames Estuary and 15 years within the East Coast region. It is noted that
this resource has the potential to serve markets other than Greater Essex,
with the market destination being a commercial decision, and therefore this
figure cannot be taken to equate to a marine supply for Greater Essex.
4.6. Offsetting Land-won Production
4.6.1. During the examination held into the Essex Minerals Local Plan (Nov 2013)
a number of concerns were raised claiming that marine aggregate imports to
Essex have the potential to be increased and make a greater contribution to
overall aggregate provision. As such, the Mineral Planning Authority (MPA)
should not allocate as much land-won aggregate as set out in the MLP. The
Planning Inspector ruled that the MPA were required to include a
commitment to continue to monitor the potential for increasing the proportion
of marine-won sand and gravel contributing to the future overall County
requirement. This resulted in the inclusion of Minerals Monitoring Indicator
3, as reported on through the Essex Authority Monitoring Reports.
4.6.2. However, increasing the proportion of marine-won sand and gravel to offset
the provision required from land-won sources, is outside of the remit of
Mineral Planning Authorities, as marine extraction areas are leased by the
Crown Estate, with licenses to dredge issued by the Marine Management
Organisation (MMO). Land-won and marine-won aggregate are not always
directly substitutable in any event36. Similarly, it has been noted37 that
substituting land-won for marine aggregates is linked to economic
circumstances and is ultimately market driven.
34
Source of this data is derived from The Crown Estate, Summary of Statistics, 2010 – 2019
35
Crown Estate (2019) Marine Aggregates – Capability and Portfolio
36
At the EoEAWP meeting (9 Feb 2019), it was noted that marine aggregates in the East tend to
be more sand-rich and therefore can’t simply use dredging to achieve a 50:50 sand:gravel mix
so therefore not directly substitutable. A more directly substitutable source would be off the
north eastern coast (c. Hull)
37
Source: EoEAWP meeting (9 Feb 2019),
FINAL Oct 2020 Page 21Greater Essex Local Aggregate Assessment: 2019
4.6.3. Subsequent conversations with the industry have established that marine
sources are not constrained by resource availability or by a limit on permitted
reserves. Instead, it is believed that constraints are focussed around
production capability limited by existing dredger numbers (and their
production rate), and their ability to access the market, which is determined
by the capacity and location of wharfs and associated infrastructure. As
such it is not considered appropriate to reduce land-won reserves based on
the assumption that they will be replaced by marine-won reserves.
4.6.4. MPAs can ensure that marine-won sand is able to make an important
contribution to land-won mineral by ensuring that wharves and ports are
safeguarded from the encroachment of incompatible development that may
compromise the ability of these marine facilities to carry out their function. In
this regard, MPAs are supported by the NPPF which incorporates the ‘Agent
of Change’ Principle (para 182). This principle states that where the
operation of an existing business or community facility could have a
significant adverse effect on new development (including changes of use) in
its vicinity, the applicant (or ‘agent of change’) should be required to provide
suitable mitigation before the development has been completed.
4.6.5. The Essex MPA is currently developing a Wharf Baseline Capacity Study to
further address the required commitment to continue to monitor the potential
for increasing the proportion of marine-won sand and gravel contributing to
the future overall County requirement, and specifically to report on Mineral
Monitoring Indicator 3. The requirement of the indicator was to assess
whether the amount of marine aggregate landed in Greater Essex is within
90% of existing capacity. Should this be the case, this would necessitate the
need to engage with the minerals industry, port authorities and district
authorities where landings occur to establish whether marine aggregate
supply is being constrained. This report will form part of the evidence base
for the MLP Review.
Page 22 FINAL Oct 20205. IMPORTS & EXPORTS OF LAND-WON AGGREGATE
5.1.1. Historically, approximately 75% of the mineral extracted within Greater
Essex has been used within the area, with the majority of that exported
going to London. Greater Essex is heavily reliant on hard rock importation,
used as construction material and rail ballast, as well as limestone
specifically used in cement making. A pattern of long-distance supply has
emerged, with Greater Essex exporting its sand and gravel, whilst importing
hard rock38.
5.1.2. More recent analysis of the amount of sand and gravel used within Greater
Essex compared to that exported is prevented, due to the need to protect
commercial confidentiality and the small number of transhipment
facilities/operators providing information via the annual aggregate survey.
5.2. Methods of Mineral Transportation within Greater Essex
5.2.1. There are three bulk transport modes for mineral movement: road, rail and
water. For internal, relatively short movements, the road network is the most
efficient and heavily used mode of transportation, as this route offers
flexibility and the ability to deliver to any final destination. Rail and water
however provide the most effective long-distance transhipment
opportunities, despite involving ‘double handling’ i.e. loading and unloading
of aggregate on to lorries at each end.
5.2.2. There are six wharf (two of which are inactive) and five rail transhipment
sites within Greater Essex39 that facilitate long distance movement of
aggregate. There is also some cross-boundary movement of aggregate by
road into and from neighbouring areas, although exportation to London is
predominantly by rail.
5.3. Approved & Pending Transhipment Applications in 2019
5.3.1. During February 2019, the Secretary of State approved an aggregate berth
and rail terminal to manage up to 1.6Mt tonnes of mixed aggregate per
annum at Tilbury in Thurrock40. This facility would receive marine dredged
aggregates and crushed rock aggregates. The permission also includes
aggregate recycling and secondary aggregate facilities.
5.4. Imports & Exports of Aggregate
5.4.1. The Mineral Products Association (MPA) published an overview of
construction and mineral products markets in the East of England41 in 2020.
This included reference to inter-regional flow of mineral products at a
regional level but was based on the 2014 National Aggregate Survey data.
This helps to identify a difficulty in obtaining raw data regarding these
38
From areas such as the East Midlands and limestone from the South West.
39
As listed within Annex A. This value is a result of the Aggregate Survey being undertaken
during the Furlough period; this could be subject to change.
40
Ref: TR030003, Aggregate Berth, Port of Tilbury (Expansion) Order 2019, at Site of Former
Tilbury Power Station.
41
Mineral Products Association (Aug 2020) published an overview of construction and mineral
products markets in the East of England
FINAL Oct 2020 Page 23You can also read