GREEN FINANCE AND ITS RELATION TO ASSET CLASSES - DIVA PORTAL
←
→
Page content transcription
If your browser does not render page correctly, please read the page content below
Linköping University | Department of Management and Engineering
 Master thesis, 30 credits | Master’s program - Economics
 Spring 2021 | LIU-IEI-FIL-A--21/03673--SE

Green Finance and its Relation to Asset
Classes
 - Analyzing the dependency structure with a DCC-GARCH
 and a cross-quantilogram approach

Linda Ivarsson
Mona Ebadian

Supervisor: Gazi Salah Uddin

 Linköpings universitet
 SE-581 83 Linköping, Sverige
 +4613 28 10 00, www.liu.se
Title:

 Green Finance and its Relation to Asset Classes
Analyzing the dependency structure with a DCC-GARCH and a cross-quantilogram approach

 Authors:
 Linda Ivarsson
 liniv939@student.liu.se
 Mona Ebadian
 moneb865@student.liu.se
 Supervisor:
 Gazi Salah Uddin
 Publication type:
 Master Thesis in Economics

 Master’s Program in Economics at Linköping University

 Advanced level, 30 credits
 Spring semester 2021
 ISRN Number: LIU-IEI-FIL-A--21/03673--SE
 Linköping University

 Department of Management and Engineering (IEI)

 www.liu.se
Abstract
In this master thesis, we present the first empirical study that investigates the correlation- and
dependence structure of green finance with major asset classes such as cryptocurrency,
commodities, equity and currency on a global level. Over the years, green finance and sustainability
questions have become more and more central in the literature. By using daily data between 2013
and 2020, we aim to investigate the correlation and dependence structure between green finance and
the elected asset classes. By utilizing a DCC-GJR-GARCH(1,1) model and a cross-quantilogram
approach, we reach the conclusion that green finance has a decaying dependency over time, hence
amplifying a diversification effect. The results also indicate a stronger tail-dependence during
financial turmoil. In addition, our results imply a negative dependency to currency. We also
observed similarities between the Asian and the American green economy market and its
connectivity to our assets. We find implications that gold might not be considered a safe haven for
all green finance indices. Finally, Bitcoin has a volatile dependency to green finance. Our assets
present varying values at different quantiles for green finance which could have crucial implications
for volatile market conditions and hedging purposes. Our results could therefore have important
implications for policymakers, investors and for portfolio allocation decisions.

Keywords: Commodity, Cross-quantilogram, Cryptocurrency, Currency, DCC-GJR-GARCH,
Dependency, Equity, Green bonds, Green economy, Green finance, Uncertainty
Acknowledgements
Firstly, we want to give our genuine thanks to our supervisor and associate professor Gazi Salah
Uddin who continuously motivated and challenged us throughout this thesis. Secondly, we want to
thank Rebecka Gärderup and Thea Nguyen for their helpful comments and recommendations. We
also want to thank Bo Sjö, Axel Hedström and David Stenvall for their insight and helpful
comments in regard to the methodological section. Lastly, we want to thank each other for a good
collaboration, and we wish one another well for the future challenges that lie ahead.

Best regards,

 Linda Ivarsson Mona Ebadian
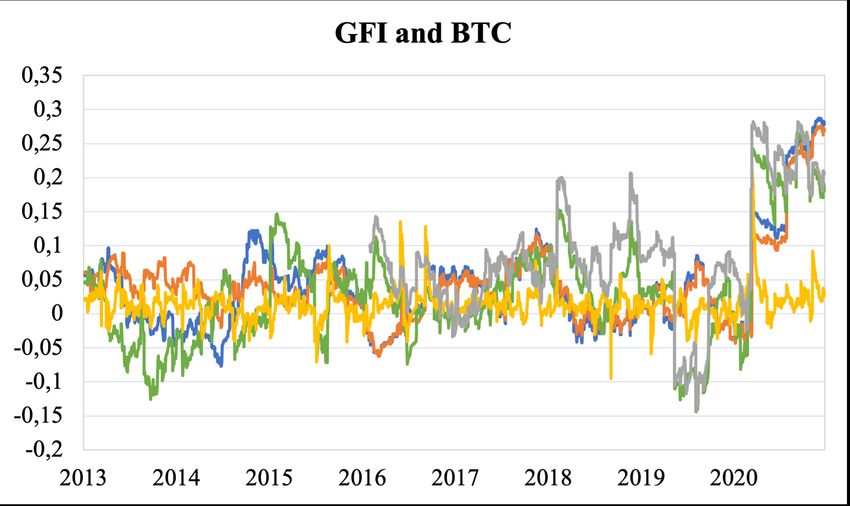
Table of content
1. Introduction 1
2. Stylized facts of green finance 5
 2.1 Stylized facts of assets 7
3. Literature review 9
 3.1 Green finance and conventional asset classes 9
 3.2 Studies on national and international level 12
 3.3 Green versus conventional bonds 13
 3.4 Ethical and behavioral perspective of green financing 14
4. Data 17
5. Method 25
 5.1 ARCH and GARCH 25
 5.1.1 GJR-GARCH 26
 5.1.2 DCC 27
 5.2 The cross-quantilogram 29
6. Results and analysis 33
 6.1 DCC-GJR-GARCH(1,1) 33
 6.2 Cross-quantilogram 39
 6.2.1 The cross-quantile dependence between green finance and asset classes 40
 6.2.2 Cross-quantile correlation after controlling for uncertainties 43
 6.3 Rolling sample estimations for the green indices and asset classes 44
7. Conclusion 51
1. Introduction
Globally, green finance has gained wide interest and has become increasingly attractive to investors
and policy makers. Green finance, which centers around combining the world of finance with
environmental- and sustainable actions (Wang and Zhi, 2016), has had a high, though steady,
development during more recent years (Sustainable Banking Network (SBN) and International
Finance Corporation (IFC), 2019). In terms of green finance concepts and tracking, the green bond1
market is the most evolved financial instrument (IFC, 2017). This can partly be illustrated by the
total amount of global green bond and green loan issuance which, according to the Climate Bond
Initiative (CBI) (2020), increased by 51% between the years 2018 and 2019. Even with the
economic and financial shocks associated with the COVID-19 pandemic, green finance continues to
offer a reliable pathway for issuers (IFC, 2020). To highlight the increasing demand for green
finance, the IFC made an analysis during 2016 where they estimated that the nationally determined
contributions of 21 emerging market countries will lead to an investment opportunity of $23 trillion
for the period 2016 to 2030 (IFC, 2017). Overall, there is a prominent increase in the demand for
green finance. According to Lewis (2001), the feeling of participating in a new self-sustaining
movement and having a positive influence as well as impact on climate related issues, is one of the
key factors for investing in green finance. On account of the increasing demand that green finance
has had, the comprehension of the subject and how it relates to other assets has become more
essential, particularly for policymakers, investors and issuers.

A scale-up of green finance would not only combat climate change but will also promote economic
development and job opportunities. However, public investment is not going to be enough to
finance the green transformation. According to Berensmann et al. (2017), most of the investment
must come from the private sector. It is therefore necessary that the financial system – banking,
capital markets and insurance – is aligned with sustainable development. The alignment of the
financial system with sustainable development would require actions across the entire financial
system and the participation of all parties. Including international financial institutions, banks,
institutional investors, market players such as credit rating agencies and stock exchanges, as well as
central banks and financial regulatory authorities (Berensmann et al., 2017).

1
 Green bonds are any form of bond instrument where the proceeds will be used solely to fund or refinance new or
existing qualifying green projects (Green Bond Principles (GBP), 2017).
 1
Access to finance is frequently referred to as one of the keystones for green finance to prevail (Lee
et al., 2021; Taghizadeh-Hesary and Yoshino, 2020). In 2015 the United Nations (UN) constituted
two key drivers for green finance initiatives: The United Nations Sustainable Development Goals
(SDGs) and the Paris Agreement (SBN and IFC, 2019). The SDGs are known as the blueprints to
achieve a better and more sustainable future for all (SDGs, 2021), whereas the Paris Agreement is
based upon the United Nations Framework Convention on Climate Change (UNFCCC). The Paris
Agreement was forged with the intent of facilitating the combination of financial flows and
reducing greenhouse gas emissions (UNFCCC, 2021). These two drivers were a significant reason
why the amount of green bonds issued by the IFC was four times greater in 2015 than in 2013 (IFC,
2017, 2020). As a consequence of these initiatives, the green bonds issuance reached record high
levels in 2020 (CBI, 2020; IFC, 2020).

In terms of green finance, the global banks have in recent years taken more and more involvement
in providing finance for green purposes. To exemplify this, the European Investment Bank (EIB)
has at least 25% of its investments in projects supporting biodiversity, clean air, clean water,
sustainable transport, renewable energy and energy efficiency (European Commission, 2017).
Overall, banks are increasing green lending, green credit and investing more in green technology. A
number of Multilateral Development Banks (MDB), along with the International Development
Finance Club (IDFC), have developed the MDB-IDFC Shared Standards for Climate Mitigation
Finance Monitoring. These principles provide the taxonomy of qualifying industries for climate
mitigation finance. Meanwhile, policy makers around the globe are collaborating with the financial
sector to develop green finance guidelines. Efforts are generally based on outlining the product or
process requirements that financial players should meet in order to become more sustainable
(European Commission, 2017).

Granted, green instruments differ from the conventional ones, hence offering one type of
diversification for investors, but only a limited number of studies have analyzed its correlation and
dependency structure. Most recently Pham (2021) presented a new empirical study analyzing the
dependence structure between green bonds and green equity. Pham (2021) found that green bonds
and green equity are more connected during extreme market movements, thus have a weaker
dependence under normal market conditions. Moreover, green bonds are connected with
fixed-income markets such as corporate and treasury bonds, whereas green equity has the highest
connectivity with the general equity and energy markets. Further, studies have analyzed green
bonds with other asset classes. A uni-directional dependency between oil and renewable energy was
stated by Reboredo et al. (2017), whereas other studies have argued that this dependency is

 2
bi-directional (Reboredo, 2015; Uddin et al., 2019). In addition, previous literature has found a
bi-directional dependency between oil and green bonds (Lee et al., 2020). Thus, it is important for
policy makers to have these relations in consideration to maintain the stability of the green market.

As financial markets for green investments are expanding, both in scope and scale, and there seems
to be a transition to a low-carbon economy, an analysis of the relationship between green finance
and asset classes becomes interesting to follow and also important since there is a clear upwards
trend for green finance and green assets (CBI, 2020; European Commission, 2017; IFC, 2017).
Moreover, understanding how green finance and major asset classes affect each other will have
significant consequences for investors who would like to diversify the risks and boost the
environmental friendliness of their portfolios (Pham, 2021). This study can contribute with
meaningful insights for those who wish to have a better understanding of green finance and its
characteristics. Moreover, understanding the correlation and dependency between green instruments
and other assets is an important element in risk minimization. The greater the correlation between
two assets, the smaller the effect of diversification and vice versa.

There are several contributions that our study offers to this field. To the best of our knowledge, up
to now there has been no attempt to uncover the correlation and dependency between green finance
and asset classes such as cryptocurrency, commodities, equity and currency. The chosen variables
are included since we found a gap in previous research for these asset classes in combination with
green finance, thus we want to contribute with new insights in this field. Moreover, these assets are
the most frequently used in hedging2 and diversification purposes. Bitcoin has had an increasing
demand in recent years and is elected as a less conventional asset to expand the limited research.
Moreover, previous literature has focused on the correlation between green bonds or renewable
energy and oil (Lee et al., 2020; Reboredo et al., 2017; Uddin et al., 2019) as well as technology
(Ahmad and Reis, 2018; Maghyereh et al., 2019). Thus, there is a lack of studies regarding green
finance’s dependency with asset classes, which is significant for future policy implications to meet
the incentives of the UN. Lastly, we provide updated data on a global level, since former literature
has focused on national level data.

Former research is limited and somewhat narrow, thus the aim of this study is to investigate the
correlation- and dependence structure of green financing with the elected assets. In this context, we
ask the following research question:

2
 A hedge is described as an asset that, on average, is either uncorrelated or negatively correlated with other assets and
is used as a way to reduce risk (Shahzad et al., 2020).
 3
- Does a correlation and dependency exist between green finance and the elected asset
 classes?

To address the research question, we firstly utilize a DCC-GJR-GARCH3(1,1) model. Secondly, we
apply the cross-quantilogram to get a complete picture of the characteristics of green finance and
our elected assets. Using daily data from 2013-01-02 to 2020-12-23, we conclude that the green
finance indices have a decaying dependency over time, hence amplifying diversification effects.
Moreover, our findings imply a negative dependency to currency. We also found similarities
between the Asian- and the American green economy market and its connectivity to our assets. Our
results indicate that gold might not be considered a safe haven for all green finance indices. In
addition, Bitcoin has a volatile dependency to green finance. We find varying values at different
quantiles for green finance which could have crucial implications for volatile market conditions and
hedging purposes. The results could therefore have important implications for policymakers,
investors and for portfolio allocation decisions.

The rest of this study is organized as follows: Section 2 presents a summary of the stylized facts of
green finance and our assets. Section 3 provides a brief overview of the existing related literature
whereas section 4 and 5 discusses the data and methodology. Empirical results and discussion of the
findings are presented in Section 6. Lastly, Section 7 summarizes and concludes.

3
 DCC-GJR-GARCH stands for Dynamic Conditional Correlation - Glosten Jagannathan and Runkle - Generalized
Autoregressive Conditional Heteroskedasticity.
 4
2. Stylized facts of green finance
While finance is described as a key element of green finance, the main publications that publish
similar works turn out to be those that focus on environmental and climate change. Thus, there is a
wide gap in the existing literature since the importance of green finance is widely acknowledged.
Clearly, green finance is of paramount political importance which could be observed by the
intensive debates among international organizations and national governments ever since the term
was first introduced (Zhang et al., 2019). In order for the SDGs to be accomplished, Sachs et al.
(2019) state that we must increase the financing of investments that provide environmental
advantages through instruments such as green bonds, green equity and green banks. This will
further promote green growth and high employment and is therefore important to give attention to.

The SBN and IFC (2019), as well as Lee et al. (2020), define green bonds as key tools for the
development of green finance. In addition, the SBN and IFC (2019) confirmed a steady increase in
green bond issuance in both developed as well as emerging countries. In terms of green finance, it is
typically referred to what it finances, such as investments in green technology or activities, and not
by what it accomplishes. The G20 Green Finance Study Group (GFSG) (2016) describes green
finance as: Financing of investments that provide environmental benefits in the broader context of
environmentally sustainable development. Green finance includes efforts to internalize
environmental externalities and adjust risk perceptions with the aim to encourage environmentally
friendly investments and reduce environmentally harmful investments. In order to provide a
benchmark for active investment decisions, investment managers and asset owners usually use
different indices. For instance, the Nasdaq Green Economy Global Benchmark Index (QGREEN) is
a market-capitalization weighted index that was first presented in 2010 (Nasdaq, 2021.b). The index
“must be involved in the reduction of fossil-sourced fuels, products, services, and lifestyles” and in
at least one of the thirteen “green” sub-sectors defined in Nasdaq’s taxonomy (European
Commission, 2017). QGREEN has had an increased value over the last couple of years (Nasdaq,
2021.b), which could be due to the overall increased awareness in the green finance sector and
increasing knowledge for green investments-and projects. Furthermore, investments in green equity
are often made by index investing or equity funds and the market offers many indexes to identify
and track the performance of green firms and investments (European Commission, 2017). Instead of
identifying green bonds and green equity as securities belonging to the same capital market, it is
more likely that investors view green bonds as a fixed-income investment and green equity as an
equity investment (Pham, 2021). Although index providers are generally open about the
methodologies used to classify green firms for their indices, the “green” delimitation approaches

 5
used by green equity funds are complicated and contested. As a result, labels and certification
schemes to certify the greenness of funds have been created. Overall, in the green listed equity
segment, methodologies used to delimit “green” are heterogeneous in a high level and efforts are
yet to be made to harmonize such definitions (European Commission, 2017).

Multiple countries have set general policy goals for environmental action. However, only a few
countries and businesses have set specific goals and clear targets for how to engage the private
sector in achieving a green economy (IFC, 2017). Numerous financial institutions, foreign
programs, standard-setters and regulatory bodies have formed their own pathways to green finance
and there are different definitions of green finance across the financial sectors and institutions (IFC,
2017). The findings of Ning (2019) shows that the green financial system is explicitly applicable to
the growth of high-energy-consuming industries. Moreover, one of the most crucial levers of
macroeconomic regulation and control is the green finance market since green finance is an
innovative financial pattern that strives to protect the environment thus ensuring the fair use of
capital and resources (Wang and Zhi, 2016).

Zhang et al. (2019) describe several reasons why this field is of importance. First, the number of
investments in green-and climate-initiatives has risen exponentially and has retained a strong
growth trend in recent years. Second, there is an increasing awareness and interest in this area from
a consumer, firm and investor perspective. Since the demand is increasing, the supply of green
finance naturally follows. The key contributors to the fast-growing trend in green finance are
mainly coming from the United States, Europe and a few other developed countries. Moreover, it is
crucial that emerging countries like China and India actively participate in this discussion since
these two countries represent a fair share of global greenhouse gas emissions. While developed
countries are primarily the source of finance, without strong participation from developing countries
it is difficult to achieve successful green financing or investment (Zhang et al., 2019). According to
Ng (2018) the trend of sustainability reporting is likely to continue in China since incentives for
such reporting are instigated by the emergence of a green financing system. Since China is a
member of G20, China is aligned with the international community through the Paris Agreement
and commits sustainability investments under the green financing initiative (Berensmann et al.,
2017). For green bond issuances, it is noted that foreign capital market surveillance, even though it
differs from regulatory requirements in China, complements the implementation of a relatively
more dynamic green financing framework, although it needs some degree of assurance. The use of
green finance revenues through the Global Financial Centre of China (GFCC) will also allow for a
substantial allocation of financial resources from the international capital market to sustainable

 6
infrastructure projects in the geographical area. The proposed structure of the emerging green
financing system demonstrates the value of the interactions between national policies and
market-based financial structures.

2.1 Stylized facts of assets
In regard to risk management and hedging strategies, the presence of asymmetric uncertainty is
critical and high volatility is usually considered problematic, thus investors aim to reduce it. In
addition, high levels of volatility are known to be especially disadvantageous in falling markets, a
problem that arises directly from volatility asymmetry (Cont, 2005). This highlights the importance
of further exploring how the volatility of different markets will affect green finance. Reboredo
(2018) found that green bonds can be considered as an effective diversification tool for the equity
market. In regard to currency, Campbell et al. (2010) found that, despite their low average returns,
currencies are attractive to risk‐minimizing global equity investors. In addition, with a modest long
position in the U.S. dollar, a risk-minimizing currency strategy for a global bond investor is close to
a full currency hedge.

Naeem et al. (2021) stated that positive effects between green bonds with commodities during
bullish market conditions was a result of the high returns of green bonds, generated after the
escalation of commodity returns. In terms of oil and green bonds, Lee et al. (2020), found that
investors and portfolio managers should acknowledge their asymmetric relationship and nonlinear
transmission mechanism when making portfolio and hedging decisions. Furthermore, the results
indicated a bi-directional dependency between oil and green bonds under bear market conditions.
However, under bullish market environments, investors should have them in their portfolio for
diversification purposes. In addition, Naeem et al. (2021) concluded that there is an asymmetric
relationship between green bonds with gold and oil. Gold is frequently mentioned as a hedging
instrument, or even as a safe haven4 (Naeem et al., 2021; O'Connor et al., 2015; Shahzad et al.,
2020). The group of people that invest in the gold market are known as “gold bugs”, meaning that
they consider gold as an ultimate safe asset (He et al., 2018). Furthermore, gold has often been
attributed as a safe haven for equity markets (Huynh et al., 2020). Overall, commodities are still
subject to ever-increasing price volatility as a result of extreme market risks associated with
financialization.

4
 Safe haven is defined as an instrument that will retain or lose little value during financial turmoil, for instance during
the stock market crash. These instruments are either uncorrelated or negatively correlated with other assets (Elie et al.,
2019).
 7
The potential role of cryptocurrencies and Bitcoin in the future financial markets remains unclear.
Baur et al. (2018) and Dyhrberg (2016) found small positive correlations for Bitcoin with traditional
asset classes, thus suggesting that such decoupling and diversification benefit is only present in the
short run and may diminish in the long run. Studies of Huynh et al. (2020) conclude that Bitcoin,
together with gold, are the most vital assets for hedging, which is a common feature that these two
assets have with green bonds. However, the usage of Bitcoin in portfolio diversification and
hedging purposes is still underexplored in regard to green bonds and even less for other green
indices.

 8
3. Literature review
Green finance is a newly explored study field where the majority of the previous literature focuses
on exploring the correlation between green bonds and renewable energy with asset classes such as
oil, technology and clean energy. Previous literature on a national level mainly focuses on the case
of China and the United States and a void for the global perspective is visible. Below, we present
the existing literature related to green finance that has been presented so far.

3.1 Green finance and conventional asset classes
The main literature within green finance uses a time series approach that centers around green
bonds. Nguyen et al. (2020) provided a wavelet correlation study proving that green bonds have low
or negative correlation with stocks and commodities. Thus, combining green bonds with asset
classes is important to obtain diversification benefits. The results also displayed that co-movement
among stocks, commodities and clean energy is found relatively high. Their result is supported by
Reboredo and Ugolini (2020), stating that green bonds are weakly connected with the stocks,
energy and high-yield corporate bond markets. The green bond market is closely linked to the
fixed-income and currency markets, receiving sizable price spillovers from those markets and
transmitting negligible reverse effects. Furthermore, the global green bond market closely co-moves
with the treasury-, corporate- and currency market and they also found that shocks in stock markets
have a positive impact on bonds.

Prior to the study of Reboredo and Ugolini (2020), Reboredo had done several studies with similar
conclusions, using time series regression with green bonds, oil and renewable energy as key
variables. Firstly, green bond prices weekly co-moves with stock- and energy commodities and are
strongly dependent on fixed-income markets (Reboredo, 2018). Secondly, green bonds, treasury and
corporate bonds show a strong connectedness between them and are weakly connected with
high-yield corporate bonds, stocks and energy assets (Reboredo et al., 2019). Thirdly, extreme oil
price movements increase the Vector Autoregressive model (VAR) of renewable energy by around
30%. Oil returns exhibit significant time-varying average and symmetric tail-dependence with all
the renewable energy indices with the exception of the solar energy index (Reboredo, 2015). Lastly,
Reboredo et al. (2017) provided evidence of weak dependency between oil and renewable energy
returns in the short-run, but a stronger dependency in the long-run. There is evidence of non-linear
causality running from renewable energy indices to oil prices at different time horizons and mixed
evidence of causality running from oil to renewable energy prices.

 9
Uddin et al. (2019) found a bi-directional dependency between oil and renewable energy using a
cross-quantilogram approach, supporting the study of Reboredo (2015) who in comparison used
copulas and Conditional-VAR (Co-VAR) as the investigated method. Positive influence on
renewable energy stock returns is observed only during extreme market conditions and renewable
energy depends on oil in the market conditions but not in opposite ones (Uddin et al., 2019).
Investments in non-renewable energy are less correlated with the stock market, compared with
those in renewable energy. There is also a unidirectional causality going from renewable energy to
the stock market (Lundgren et al., 2018).

In the case of technology versus renewable energy, the existence of a unidirectional spillover
moving from tech index to New Energy Global Innovation Index is found (Ahmad and Reis, 2018).
Clean energy and technology equities share a bi-directional dependency, and the interdependence is
stronger for clean energy and technology equites than for oil (Maghyereh et al., 2019). Bondia et al.
(2016) suggests a unidirectional short run causality from technology stock prices to stock prices, a
bi-directional short-run Granger causality between interest rates and tech stock prices and a
short-run bi-directional causality between interest rates and stock prices of alternative energy
companies. Through Granger causality, Lee et al. (2020) found the existence of a bi-directional
causality between oil prices and green bonds as well as a unidirectional causality between the
geopolitical market and green bonds. Therefore, it is important for both investors and market
participants to take oil prices and geopolitical risks into consideration when dealing with green
bonds. These results are foremost important for policy makers to maintain a stability on the green
bond market.

Using a wavelet-based Granger causality and wavelet correlation approach, Ferrer et al. (2021)
presents a limited connectedness between the green bond market and the general stock market, the
renewable energy equity sector and the crude oil market. The connectedness between the global
green bond market, the conventional financial and energy markets mainly occur at shorter time
horizons. There is evidence of green bonds appearing as a beneficial tool to fight against climate
change without having to give up part of the return generated by traditional assets, particularly for
conventional bonds. In sum, Ferrer et al. (2021) concluded a strong connectedness in return and
volatility between green bonds, treasury and investment-grade corporate bonds and a bidirectional
causality between these assets. Another perspective is given by Hammoudeh et al. (2020) who
found that there is no significant Granger causality running from green bonds to equity index, U.S.

 10
10-year Treasury bond index or CO-emission allowances and that there is no causal effect between
green bonds and the clean energy index.

Clean energy is one aspect of green finance, where the correlation with oil is fairly examined
(Kumar et al., 2012; Managi and Okimoto, 2013; Pham, 2019). Managi and Okimoto (2013) found,
through Markov-switching-VAR (MSVAR), that there is a positive relationship between oil prices
and clean energy prices after structural breaks. Additionally, Pham (2019) found that the correlation
structure varies between clean energy and oil. By using a generalized VAR and a Multivariate
generalized autoregressive conditional heteroskedasticity model (MGARCH(1.1)), Pham (2019)
found that the relationship varies across clean energy stock-sub sectors but is heterogeneous over
time. Hence, the type of clean energy stock will have an effect on both hedging cost and
effectiveness of a portfolio. Finally, through VAR models and Granger causality, Kumar et al.
(2012) stated that stock prices for clean energy firms are separately affected by oil prices and
technology stock prices. In addition, they also concluded that investor’s view stocks from clean
energy companies and high technology firms in the same way. The existing literature does not
indicate a robust and clear correlation between clean energy and oil.

Elie et al. (2019) stated that oil could be seen as a weak safe haven for clean energy. By using a
cross-quantilogram, the authors found that both crude oil and gold are no more than weak safe
havens for clean energy indices, where the results indicated that the superior of the two (although
still weak) is the crude oil. Clean energy and commodities on the other hand have an asymmetric
connection which has great importance when modeling the equity price volatility. Additionally,
Yahya et al. (2020) found that non-ferrous metals are a strong safe haven for clean energy. There is
asymmetric connectedness among the non-ferrous metals and clean energy assets since the lower
quantiles, i.e. during bear market conditions, exhibit a strong dependence as opposed to the
connectedness in the median and top quantiles, i.e. during bull market conditions. The authors used
cross-quantilogram together with Granger causality to determine the dependence between clean
energy and non-ferrous metals and found that the dependence structure is time-varying and
asymmetric with potential for extreme co-movements. The results also indicated a bi-directional
causality among assets that intensifies with the increase in the lag order.

 11
3.2 Studies on national and international level
China is a major player in green financing and is thus naturally an important research focus (Zhang
et al., 2019). Therefore, most of the existing studies regarding green finance have been done at a
national level, either for China or for the US. In the case of China, Ning (2019) provides a Grey
relational analysis stating that green financial systems, where green credit is one major component,
have an impact on the high-energy-consuming industries in China. There is also a unidirectional
correlation going to the green financial system to high-energy-consuming industries. Using panel
data regression as an alternative method, Jiang et al. (2020) showed a significant positive
relationship between the green finance index for China and poverty alleviation, whereas Liu et al.
(2020) found a strong spatial dependence between green finance and green economy in the Chinese
regions. Ren et al. (2020) used a vector error correction model (VECM) where they concluded that
improvements in green finance contributes to a reduction in carbon intensity in the case of China.
However, the Granger causality test shows that green finance does not play an important role in
promoting the development of new energy. Further, an increase in carbon intensity inhibited the
development of non-fossil energy and reduced green finance investment in the short term.

Another perspective is presented by Troster et al. (2018) who found Granger causality from changes
in energy consumption to economic growth for the United States. Further, there exists lower-tail
causality running from oil price changes to changes in renewable energy consumption and changes
in renewable energy consumption are sensitive to economic growth at the lowest quantiles of the
distribution. There is a bi-directional causality between renewable energy consumption and
economic growth for lower quantiles and a unidirectional causality going from renewable energy to
economic growth for the highest tail. To compare Chinese and American commodities, Jian et al.
(2016) used a cross-quantilogram approach where they found that there is evidence of significant
bi‐directional dependence between the two markets across commodities. This effect is greater in
extreme quantities and moderately stronger from the United States to China. To our knowledge, the
existing literature does not study the relationship between green finance and commodities on a
global level which motivates us to investigate this relationship further.

There are several examples of what other countries have done so far to promote green finance. The
Reserve Bank of India has included lending to small renewable energy projects as part of its
Priority Sector Loan requirement, requiring banks to devote 40% of the lending to key sectors such
as agriculture and small and medium-sized enterprises (Berensmann et al., 2017). In the case of
Indonesia, the Indonesian financial regulator (Otoritas Jasa Keuangan) released a Green Finance

 12
Roadmap in 2014 which was a work plan for promoting sustainable finance for the period
2015-2019. This Roadmap was unique internationally since a systematic plan grew out of a decade
of development of sustainable finance in Indonesia and has helped Indonesia to continue towards a
greener economy (United Nations Environment Programme (UNEP) Inquiry, 2015). Another
successful country in the aspect of green finance is Brazil. As early as in 2005, the São Paulo Stock
Exchange in Brazil established a Corporate Sustainability Index. Furthermore, The Central Bank of
Brazil has launched requirements for banks to monitor environmental risks, building on a voluntary
Green Protocol from the banking sector (Berensmann et al., 2017). Additionally, the Brazil’s
banking association (Federação Brasileira das Associações de Bancos) has developed a
standardized assessment methodology and automated data collection system to monitor flows of
finance for green economy sectors (Berensmann et al., 2017).

3.3 Green versus conventional bonds
Most of previous literature has compared green bonds and conventional bonds with panel-data
regressions. Amongst them, Zerbib (2019) reached the conclusion that a green bond has significant,
but small, lower yield than a conventional bond. The results from the matching method used,
indicated a limited impact on the prices and Zerbib (2019) points out the opportunity for issuers to
broaden their views. By using the same matching method as Zerbib (2019), Wang et al. (2020)
documented a significant and robust positive pricing effect for green bonds. In addition, Gianfrate
and Peri (2019) used propensity score matching to reach the conclusion that green bonds are more
convenient for the issuer. Their results indicated, in contradiction to general assumptions, that even
with the extra cost that comes with certifications, green bonds compared to conventional bonds will
on average be cheaper for the issuer. Along with the results from Febi et al. (2018), who found that
green bonds have a minor liquidity risk, these studies indicate the existence of incentives for issuers
to choose green bonds.

Through pooled ordinary least squares (OLS), Febi et al. (2018) reached the conclusion that green
bonds are more liquid than conventional bonds and that liquidity is positively correlated to the
green bond yield spread. Furthermore, Tang and Zhang (2020) found that institutional ownership
increases when firms issue green bonds and that the positive stock returns are not driven by the
lower cost of debt. Their results indicated that the stock prices are responding positively to green
bond issuance. Moreover, there are different drivers for green bonds and conventional bonds.
Tolliver et al. (2020) used an exploratory factor analysis with a Structural equation analysis (SEM)
to determine the unique drivers for the green bond market. The authors concluded that there are

 13
macroeconomic drivers, such as size of the economy and stock market capitalization, as well as
institutional drivers, such as capital account openness and rule of law, which drives green bond
market growth. In addition, their results indicate that institutional factors have an indirect effect on
green bond issuance through its influence on macroeconomic factors.

In contrast to the previously mentioned studies with panel data regressions, Pham (2016) examined
the relationship between the two bond types with time series analysis and a Multivariate Dynamic
conditional correlation-GARCH approach (MDCC-GARCH (1,1)). Pham found a positive
relationship between green bonds and conventional bonds as well as spillover effects to the green
bond market as a result from shocks on the conventional bond market. This relationship was also
studied by Broadstock and Cheng (2019) who deepened the definition of the relationship and
included its sensitivity. They found that the connection between green- and conventional bonds is
sensitive to economic policy uncertainty, oil prices, changes in financial market volatility as well as
daily economic activity. Broadstock and Cheng (2019) also found three phases of the correlation
whereas the third phase showed that macroeconomic conditions are increasingly affecting the
connection between the two bonds' stock prices. To analyze the relation between green bonds Park
et al. (2020) used a Baba–Engle–Kraft–Kroner (BBEK) model and a DCC-GARCH. They found
that green bond and equity markets have some volatility spillover effects but neither market
responds significantly to negative shocks in the other. Although green bonds do exhibit the
asymmetric volatility phenomenon, Park et al. (2020) highlights that the volatility of green bonds is
sensitive to positive return shocks.

3.4 Ethical and behavioral perspective of green financing
Green finance is receiving a great deal of attention in recent literature as global actions towards
climate change are increasing and there is a clear trend of consumers and investors wanting to
invest greener to promote a positive environmental change. Zhang et al. (2019) stated that one of
the major challenges is funding mitigation and adaptation actions to climate change and
sustainability, as well as reducing the number of energy-related investments. There is a general
consensus between leading countries that cooperation is needed in order to reduce greenhouse gas
emissions and maintain the 2°C temperature threshold of the Paris Agreement. Among academic
researchers, it has also led to growing interest (Zhang et al., 2019).

With the growing availability of local and global knowledge, individuals can do their own research
and exclude companies that do not take their social responsibility seriously. Financial investing with

 14
ethics and social responsibility can be complex but is broken down and described by Hellsten and
Mallin (2006). The term ethics usually refers to a set of our values that set some moral guidelines to
follow. Social responsibility refers to ethical behavior and our moral agency which assumes that one
takes responsibility for different actions. Despite universal consensus on the concept of benefit
maximization for firms, there is a clear demand from both a consumer and producer perspective for
more ethical and socially responsible investments. Attitudes towards green finance and
sustainability are changing and are becoming a crucial factor in investment decisions (Hellsten and
Mallin, 2006). According to Lewis (2001), many ethical investors choose to invest both ethically
and unethically at the same time, thus not putting all their money “in one ethical egg-basket”. The
reason is that investors have some kind of “moral” requirement to make enough money before
having a portfolio consisting only of ethical investments. Individuals invest green and ethically to
ease their consciences and since there is a clear social norm to invest more green, sustainable and
ethical since consumers today are more concerned about environmental issues.

It is clear that green financing is connected to climate change and should be policy driven.
However, green finance is not only applicable to environmental economists or scientists, it also
needs input from economists and financial economists. According to Zhang et al. (2019) green
finance needs to be recognized as an interdisciplinary research topic that handles policies,
investment and governance on financing and investment in climate adaptation. In recent years more
attention has been towards ethical investments that have, for example, led to the development of
ethical mutual funds and stocks. Heinkel et al. (2001) presented a model that provides evidence that
social investing impacts a firm's environmental and ethical behaviors. Exclusionary social
investment policies have seen to change risk sharing opportunities so that unacceptable firms' share
prices are reduced. As the price difference between acceptable and unacceptable firms becomes
high enough, it becomes optimal for unacceptable firms to pay the fixed cost of reforming which
makes themselves acceptable to green investors (Henikel et al., 2001). Furthermore, Zhang et al.
(2019) presents a number of keywords that have attracted much attention in relation to green
finance and investment decisions. One common keyword is Management, which reflects the
concerns about how green financing is handled by a state or in a sector. Another keyword is
Governance, suggesting that proper management is an important consideration to green finance.
Moreover, researchers are interested in Impact, i.e. how much green finance can influence
sustainability, development and growth.

Investors today are more concerned with finding investment opportunities in assets that are viewed
as “safe” and “sustainable”, i.e. less volatile. In addition, long-term investors would rather see their

 15
assets going to energy projects based on wind and sun, rather than sources such as coal, oil and gas
since these fossil fuels are subject to too many political risks, economic risks and environmental
risks (Mathews and Kidney, 2012). Most recently, it has become clear that the involvement of
institutional investors in green projects may also be boosted by pressure from investors and
regulators. From the investor’s perspective, environmentally friendly green issues increasingly
influence people's savings and investment decisions. This trend is particularly taking place among
younger generations. Savers with non-banking financial institutions are calling for tougher
compliance with environmental, social and governance requirements (Taghizadeh-Hesary and
Yoshino, 2020). Large institutional investors have strongly built an awareness of sustainable
investing that is, above all, focused on investment strategies for selecting companies with strong
environmental, social and governance (ESG) results, or to prevent or involve companies engaged in
particular sectors, such as nuclear energy. Although sustainable investment is the most advanced in
equities, green bonds are a field of considerable growth potential. In addition, institutional investors
are actively seeking sustainable investment in line with the SDGs (European Commission, 2017).

In summary, previous literature has focused on the correlation between green bonds, renewable
energy and clean energy with asset classes such as oil and technology. Few studies have presented
the dependency between these variables and, as far as we know, the correlation and dependency
between green finance and the major asset classes such as cryptocurrency, commodities, equity and
currency is still unexplored. These variables were chosen based on their frequent use in hedging and
since we could not find any previous research for these asset classes in combination with green
finance, thus we want to contribute with new insights in this field. There is an increasing demand
for green finance and green investments, hence it makes this study important for investors and
policymakers that want to invest in green instruments.

 16
4. Data
To determine the correlation- and dependence structure, daily data from 2013-01-02 to 2020-12-23
is used. The choice of period was based on the availability of the data, which is mainly collected
from databases such as Refinitiv Eikon, S&P Dow Jones Indices and Federal Reserve Bank of St.
Louis (FRED) (Table A.3). In total eleven variables5 are selected to represent green finance and the
elected asset classes. In addition, seven indices for uncertainty are included to capture volatility
aspects. To analyze the data, the variables are logarithmized to the extent to which the variables
allow. This makes the series more consistent, i.e. a more even variance, and facilitates the analysis.

As previously stated, the interest in green finance has grown quickly since the first green bond was
created in June 2007 by the EIB (Wang and Zhi, 2016; Wang et al., 2020). In this study, green
finance is represented by five indices. These indexes were chosen as a proxy for different
perspectives of green finance because of its extensive coverage of the global green market and since
there is no definitive index for green finance. Figure 1 displays the evolution of the five green
finance indices: S&P Green Bond Index (GRB), Solactive Green Bond Index (SGB), Nasdaq OMX
Green Economy Index (GEI), Nasdaq OMX Green Economy Asian USD Index (GEA) and finally
the Indxx U.S. Circular Economy Index (CEI).

5
 The variables mainly consist of indices but also the closing price for gold, oil and Bitcoin. For more information see
Table A.3.
 17
Figure 1: Green finance time trends

Figure 1. Note: GRB: S&P Green Bond Index; SGB: Solactive Green Bond Index; GEI: Nasdaq OMX Green Economy Index; GRA:
Nasdaq OMX Green Economy Asian USD Index; CEI: Indxx U.S. Circular Economy Index. Time is represented by the horizontal
axis while the vertical axis is the log return of the variables.

We employ two indices to represent the green bond market, GRB and SGB. GRB includes bonds
that are used to finance environmentally friendly projects and was first introduced on July 31, 2014,
hence the data previous to this date is back-tested (S&P Dow Jones Indices, 2021c). Previous
literature has widely used this index (Hammoudeh et al., 2020; Nguyen et al., 2020; Pham, 2016;
Reboredo, 2018; Reboredo and Ugolini 2020) as a tool to track the global green bond market. This
index strives to track the performance of the green bond market and is built using independently
validated bonds that conform with the Green Bonds Principles (Pham, 2016). The SGB is calculated
as a total return index in USD, which is a rule-based, market value-weighted index designed to
reflect the green bond market (Solactive, 2021). First presented in 2014, this index shows changes
in the green bond market values, including green bonds as defined by the Climate Bonds Initiative

 18
with at least 100 million USD and with time to maturity of at least six months (Reboredo and
Uglini, 2020).

To represent the green equity market, we rely on GEI, whereas the Asian green equity market is
represented by GRA. The GEI index is designed to monitor the success of businesses across the
spectrum of industries most closely aligned with the sustainable development business development
across all economic sectors (Nasdaq, 2021b). GRA has a similar definition as GEI but represents
the Asian green economy. GRA engages in Asian companies such as energy efficiency, renewable
energy generation, advanced materials, green building, and healthy living. Moreover, the index is
intended to serve as a global benchmark for all businesses interested in minimizing the use of fossil
fuels, products, services and lifestyles of companies domiciled in Asia (Nasdaq, 2021c). Most of the
existing literature covers the case of China, thus motivates this study to also include an Asian green
economy index.

In addition, this paper includes CEI to broaden the existing research. The index was created by
Direxion World Without Waste ETF (WWOW) and represents the shift from a linear model of
economy to a circular one and is based upon the performance of 50 U.S.-listed companies. Direxion
(2021) describes the key characteristics of the circular economy as maintaining the aim of
transforming economic output and building a greater sustainability in all six stages of the cycle;
Recycling/Material Feed, Design, Production, Sales, Use and Collection. The index was created on
the 17th of December 2020 and stretches back to 2016 (Direxion, 2021), hence the period for the
CEI index is limited to the period 2016-01-29 to 2020-12-23. To the best of our knowledge, there is
no previous study that uses the index within this field.

In addition to the green finance indices, this study uses data on the overall performance of the
financial markets where we rely on the crypto-, commodity-, equity- and currency market. The
motivation for the chosen assets is that these asset classes have not been, as far as we know, fairly
examined in combination with green finance, hence we want to give new insights in this field. The
asset classes have also been elected since, as previously mentioned, they are frequently used in risk
management and hedging purposes (subsection 2.1). The evolution of the variables is displayed in
Figure 2.

 19
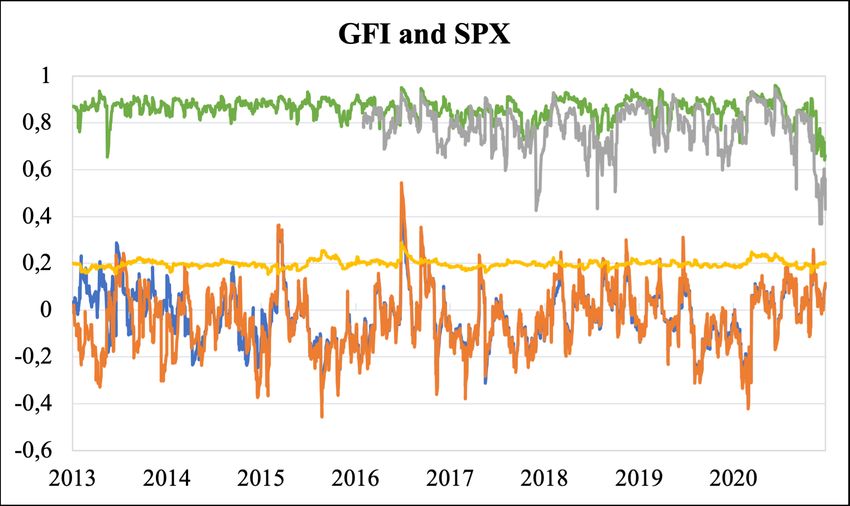
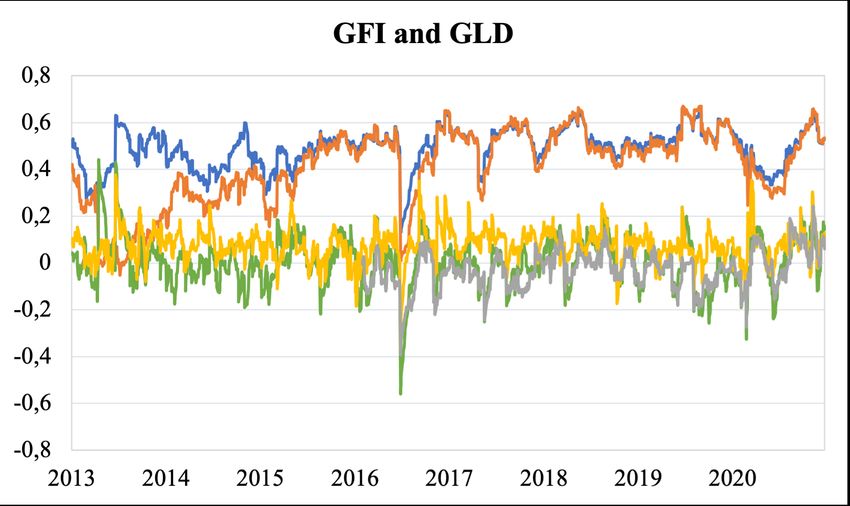
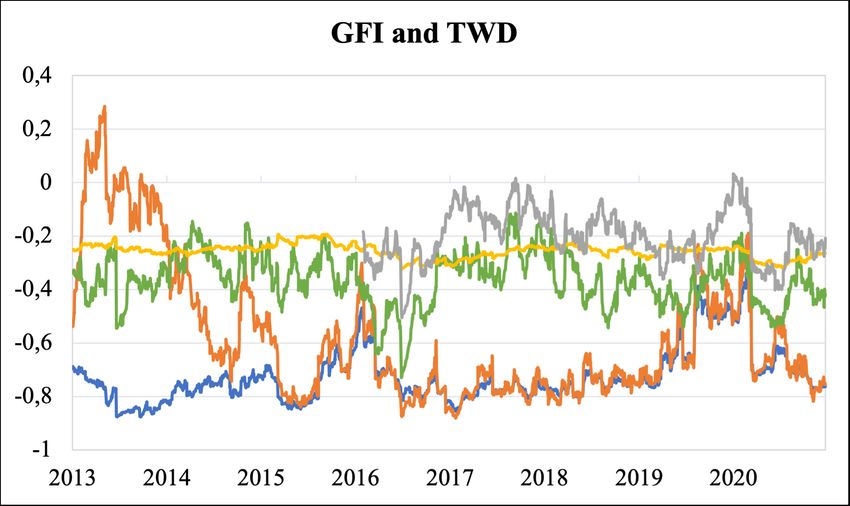
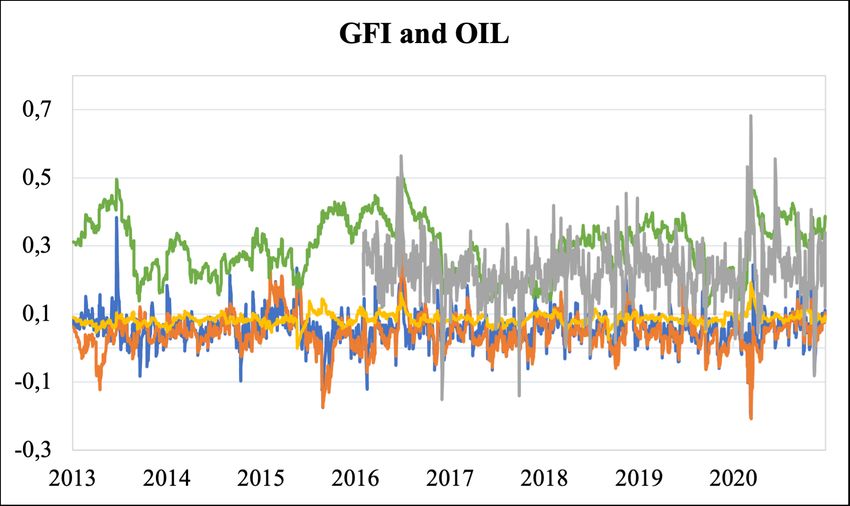
Figure 2: Asset classes time trends

Figure 2. Note: BTC: Bitcoin; GLD: CMX-Gold; GSC: S&P GSCI Commodity Index; OIL: NYM-Light Crude Oil; SPX: S&P 500
Index; TWD: Trade-weighted U.S. Dollar Index. Time is represented by the horizontal axis while the vertical axis is the log return of
the variables.

In recent years, there are new variables presented in the finance context which serves as an
alternative to conventional asset classes - this is called the crypto market. The crypto market is
considered as a high volatility-based product and for this reason it is considered as a highly toxic
investment in comparison to conventional assets. We are interested to see how our assets are
connected to these kinds of investments. For the purpose of this study, Bitcoin (BTC) will be used
to represent the crypto market since it is the dominated asset in this market.

The commodity market is represented by three variables: S&P GSCI Commodity Index (GSC),
CMX-Gold (GLD) and NYM-Light Crude Oil (OIL). The GSC is one of the most commonly known
indices that is broad-based and weighted to reflect the global commodity beta market. Further, the

 20
index is constructed to be investable by including the most liquid commodity futures, which offers
diversification with low correlations with other asset classes (S&P Dow Jones Indices, 2021b). For
example, Nguyen et al. (2020) uses this global index and concludes that it is more volatile in
comparison with returns of other comparable series, hence this index becomes interesting to include
in this study.

For many investors, GLD has become a useful portfolio diversifier since it has the potential to serve
as a hedge against portfolio fluctuations and volatility. Furthermore, GLD has traditionally been an
ideal hedge against inflation because the price of gold usually rises as the cost-of-living rises
(Conerly, 2020). GLD is a continuous series of gold futures and authors like Elie et al. (2019),
Sadorsky (2014) along with Uddin and Reboredo (2015) have previously used GLD as a
representation for the commodity market since it usually has interesting connections to other asset
classes. Gold can hedge the downside risk of stocks and work as a weak safe-haven asset for clean
energy indices. The last also holds for OIL (Elie et al., 2019). We elect to include a continuous
series of oil futures since it is an important commodity among market participants but also has been
widely examined (Lee et al., 2020; Lundgren et al., 2018; Reboredo, 2015; Sadorsky, 2014; Uddin
and Reboredo, 2015).

The S&P 500 Index (SPX) is elected to indicate the equity market and is chosen since it is a popular
index amongst investors. The SPX captures large-cap U.S. equities with 500 leading and covers
approximately 80% of the market capitalization that is available and has previously been used in
studies by Park et al. (2020), Sadorsky (2014), Uddin and Reboredo (2015) amongst others. There
are more than $11,2 trillion indexed, with indexed assets accounting for approximately $4,6 trillion
of this total (S&P Dow Jones Indices, 2021a). The Trade-weighted U.S. Dollar Index (TWD)
(FRED, 2021a) is used to track the dynamics of the currency market (Ferrer et al., 2021). The
Federal Reserve System has created the TWD to measure the calculation of the U.S. dollar based on
its competitiveness versus trading partners. The index compares the foreign exchange value of the
U.S. dollar against certain foreign currencies (FRED, 2021a).

The data span extends to the end of the year 2020, thus containing an extreme period caused by
COVID-19. The uncertainties caused by the COVID-19 pandemic have contributed to volatile data
and statistics, hence control variables are included to take the uncertainty into consideration. Aside
from the previously mentioned variables, seven control variables are included to indicate
uncertainty. Three conventional indices for uncertainty are included: CBOE market volatility index
(VIX), CBOE crude oil volatility index (OVX) and the Economic Policy Uncertainty Index for the

 21
United States (EPU). The VIX is a measure of the volatility of the SPX and calculated by
interpolating between two weighted sums of option mid quote values and is widely used in existing
literature (Broadstock and Cheng, 2019; Lundgren et al., 2018; Uddin and Reboredo, 2015).
Similarly, the OVX measures the volatility of crude oil as priced by the U.S. Oil Fund (USO). In
addition, the EPU is elected as a proxy for unforeseen market dynamics and has been included in
earlier literature such as Broadstock and Cheng (2019) and Lundgren et al. (2018).

Due to the time propinquity that our study has to COVID-19, three less conventional indices
centered around the pandemic response are included; Oxford COVID-19 Government Response
Tracker USA (OXU), Oxford COVID-19 Government Response Tracker CHN (OXC), Daily News
Sentiment Index (DNS) and Equity Market Volatility Infectious Disease Tracker (EMV). The OXU
and OXC index collects information regarding policy responses with regard to COVID-19. The data
is collected on a national level and retrieved from the University of Oxford database (University of
Oxford, 2021). This particular index stretches from 2020-01-02 to 2020-12-23. Further, DNS
measures the economic sentiment based on economics-related news articles (Federal Reserve Bank
of San Francisco, 2021). The final index included is the EMV. The index is based on three
indicators: stock market uncertainty, newspaper-based economic uncertainty, and subjective
uncertainty in business expectation investigations (Economic Policy Uncertainty, 2021).

The descriptive statistics for the data section are presented in Table 1. By using the Augmented
Dickey-Fuller test (ADF) we can conclude that the variables for green finance and the assets are all,
initially, integrated by I(1) whereas the variables representing uncertainty are integrated by I(0),
hence stationary at level. By taking the first difference of the variables representing green finance
(GRB, SGB, GEI, GEA, CEI) and the assets (BTC, GSC, GLD, OIL, SPX, TWD) all variables
becomes stationary at level and obtain the same integration order, I(0). The ADF-test displays
significant results for all the variables representing green finance and the assets, thus supporting the
differentiation of the variables.

 22
You can also read