GROWTH RATES OF THE CHOKKA SQUID LOLIGO REYNAUDII D'ORBIGNY, 1845 (CEPHALOPODA: MYOPSIDA: LOLIGINIDAE) OFF SOUTH AFRICA, INVESTIGATED OVER TWO ...
←
→
Page content transcription
If your browser does not render page correctly, please read the page content below

Folia Malacol. 29(3): 153–162

                                                                                                            https://doi.org/10.12657/folmal.029.017

            GROWTH RATES OF THE CHOKKA SQUID
            LOLIGO REYNAUDII D’ORBIGNY, 1845
            (CEPHALOPODA: MYOPSIDA: LOLIGINIDAE) OFF
            SOUTH AFRICA, INVESTIGATED OVER TWO YEARS

            Collette H. Mwanangombe1,2, Deon Durholtz3, Dawit Yemane3,
            Jean Githaiga-Mwicigi3, Warwick H. H. Sauer2, Marek R. Lipiński2,4*

            1
              National Marine Information and Research Centre (NatMIRC),
              Ministry of Fisheries and Marine Resources, P.O. Box 912, Swakopmund, Namibia;
                https://orcid.org/0000-0002-0182-5421
            2
              Department of Ichthyology and Fisheries Science, Rhodes University, P.O. Box 94,
              6140 Grahamstown, South Africa;
                WHHS https://orcid.org/0000-0002-9756-1757
            3
              Branch, Fisheries Management, Department of Environment, Forestry and Fisheries,
              Foreshore, Rogge Bay, 8012, Cape Town, South Africa;
                DD https://orcid.org/0000-0002-3234-9798; DY https://orcid.org/0000-0001-7293-2534;
                JGM https://orcid.org/0000-0003-4382-3966
            4
              South African Institute of Aquatic Biodiversity (SAIAB), 11 Somerset Rd., 6140 Grahamstown,
              South Africa (e-mail: lipinski@mweb.co.za);
                https://orcid.org/0000-0001-9362-4610
            *corresponding author
            Abstract: Growth of adult chokka squid Loligo reynaudii d’Orbigny was modelled using mantle length
            and age data derived from samples collected over two years (2003 and 2004) from a single, large cohort
            of mature and spawning squid. A total of 588 statoliths were examined (310 males, 278 females) from
            individuals of 71–425 mm mantle length (ML). The maximum size of chokka squid was 425 mm ML for
            males and 263 mm ML for females. The Francis Growth Model and Linear Growth model were selected
            for further analysis from six models considered. Males and females attain similar ages, although mantle
            length-based daily growth rates ranged from 0.75 to 1.02 (0.88 quantile _50) mm/day for males and 0.32–
            0.45 (0.38 quantile _50) mm/day for females, explaining the sexual dimorphism apparent in the sizes of
            individuals of this species.
            Key words: age; growth models; growth rates; length frequency

INTRODUCTION

   Although the chokka squid (Loligo reynaudii d’Or-                             derstanding of the population dynamics of marine
bigny, 1845) can be considered one of the most                                   organisms (Jackson 1990). The value of these pa-
comprehensively studied squid species worldwide,                                 rameters towards achieving sound management of
relatively few data on growth rates (absolute or rel-                            fisheries in general and squid stocks in particular is
ative) are currently available. Estimates of age and                             well known and documented in a number of publica-
other important parameters such as growth rate,                                  tions (Hatanaka 1986, Bigelow 1992, Arkhipkin
age-at-maturity and life span are crucial in the un-                             1994, Hatfield et al. 2001, Grist & Jackson 2004,

            This is an open access article distributed under the terms of the Creative Commons                                             Copyright ©
            Attribution License (CC BY 4.0), which permits unrestricted use, distribution, and             The Association of Polish Malacologists 2021
            reproduction in any medium, provided the original author and source are credited.    BY 4.0
154                                       Collette H. Mwanangombe et al.

Schwarz & Perez 2010, Jin et al. 2019). Estimates           recent ageing study (Lipiński et al. 2020) provide no
for these parameters can be obtained from age esti-         estimates of chokka squid growth rates.
mates based on hard structures such as gladii, beaks            This study aimed at providing growth rates of the
and statoliths, which are shown to bear periodic            chokka squid with age estimates derived from stato-
growth increments (e.g. Jin et al. 2019).                   lith daily increment analyses (details in Lipiński et
   A preliminary study of age and growth of the             al. 2020). Age data, coupled with the mantle length
chokka squid L. reynaudii (Lipiński & Durholtz              measurements of the aged individuals, are used to
1994) that used data from only 31 individuals, indi-        estimate growth rates of a large cohort of spawning
cated significant differences between males and fe-         squid, which is subject to exploitation and manage-
males. Reviews of chokka biology (Sauer et al. 2013,        ment (Sauer et al. 2013, van der Vyver et al. 2016,
van der Vyver et al. 2016, Lipiński et al. 2016) and        Lipiński et al. 2016).

MATERIALS AND METHODS
     Details of the sampling and statolith analyses are         Six growth models (linear, exponential, power,
provided by Lipiński et al. (2020) and some details         Gompertz, Schnute and Francis) were initially con-
 are repeated here. Details of images of increments,        sidered, and fitted to the mantle length-at-age data.
periodicity, validation for chokka species are provid-      However, of the six models, only four yielded accept-
ed in references given in Lipiński et al. (2020). The       able fits to the data. The Gompertz and exponential
study was conducted on material sampled from the            growth models could not be fitted to the data be-
south-east coast of South Africa in the area between        cause numerical issues with no solutions were found,
Plettenberg Bay (24°E) and Port Alfred (26°E), the          and these were not considered further. The models
main spawning grounds of the species. Squid were            fitted are given below:
 caught using hand jigging in 2003 and both hand jig-           Linear growth model:
ging and trawling in 2004 (trawling: 36% of males                              ML = a + b(age)
 and 57% of females collected in that year). All sam-
pling was conducted on spawning grounds where                  Power growth model:
mature squid move freely between spawning concen-                            ML = a(age)b
trations (see Sauer et al. 1992, Lipiński et al. 1998).
Even small sampled individuals were mature (stage              Francis growth model (Ogle 2016):
V) with few exceptions of maturity stage IV (Lipiński                                           2(
                                                                                                     age − t1
                                                                                                               )
                                                                     ML = L1(L3 − L1)[1 − r 2 ]
                                                                                            t −t
& Underhill 1995). All individuals were measured
                                                                                                      3    1

(mantle length in bins 1 cm below) and then random-                                     1−r
ly sub-sampled for statolith extraction. Length distri-              L − L2
butions of the squid sampled were visually compared         where r = 3      .
                                                                     L2 − L1
with those from the overall survey; there were no
 differences between these distributions (Lipiński et          Schnute growth model (Ogle 2016):
 al. 2020: fig. 6). Statoliths (both left and right) were
                                                                     ML = L1 + (L2 − L1)[ 1 − e−k(t
                                                                                                     −k(t − t1)
 dissected from fresh animals (Lipiński et al. 2020                                                                    ]
– references therein) washed in distilled water and                                       1−e             2    − t1)

stored in 70% ethanol. Both statoliths were later air-
 dried and prepared for light microscopy (Lipiński et       where a, b, k, L1, L2, L3 are model parameters from
 al. 2020 – references therein). The statolith prepa-       the above five models to be estimated. For the Francis
rations were viewed under transmitted light using a         growth model L1, L2, L3 are mean length at ages t1, t2,
Carl Zeiss Axioscope 5 compound microscope and              t3, t1 and t3 are ages of relatively young and old age
photographed using a Carl Zeiss high resolution dig-                               t1 + t3
ital camera mounted on the microscope. An experi-           individuals and t2 =      2 . For the Schnute growth
enced statolith reader then conducted a single count
with no repetitions of the total number of increments       model L1, L2 are mean length at age t1 and t2, where
in better prepared statolith of the pair, using the digi-   t1 and t2 are ages of relatively young and old age indi-
tal images. A total of 613 statoliths were prepared for     viduals.
 analysis, of which 588 were used for this study. The           The four models (Linear, Power, Schnute and
length and age data are summarised in Tables 1a and         Francis) were fitted to length at age data for males
1b for easy reference.                                      and females separately, and to both sexes combined.
Growth rates of chokka squid 155
Table 1a. Summary of mantle lengths (mm) corresponding to individuals collected during the November/December 2003
and 2004 research surveys that provided reliable estimates of age
Sampling Females Males
Vessel (gear) Total (M & F)
period Total Range Mean ± SE Total Range Mean ± SE
Nov/Dec 2003 Algoa (jig) 66 150–263 205 ± 2.46 106 182–425 309 ± 4.16 172
Nov/Dec 2004 Algoa (jig) 123 83–240 176 ± 1.78 134 71–375 244 ± 5.07
421
Algoa (trawl) 92 (jig+trawl) 72 (jig+trawl)
Table 1b. Summary of estimated age distributions of male and female chokka squid collected during survey years 2003
and 2004 (quoted from Lipiński et al. 2020)
Estimated age (days)
Sampling
Female Male
period
Total no. Range Mean ± SE Total no. Range Mean ± SE
Nov/Dec 2003 66 278–478 350 ± 5.58 106 281–484 364 ± 4.50
Nov/Dec 2004 212 175–464 326 ± 2.70 204 168–397 325 ± 3.15
Selection of the best performing model was based below for each 20-day interval, following Ricker
on the Akaike Information Criterion (AIC), Bayesian (1979):
Information Criterion (BIC), Root Mean Squared ML1 − ML2
Prediction Error (RMSPE) and Mean Absolute Error DGR =
t1 − t2
(MAE). Confidence intervals were estimated using a
bootstrapping approach where, once the model is fit- ln(ML1) − ln(ML2)
IGR =
ted, the residuals were randomly sampled and added t1 − t2
to the response variable (length) and then the model
was re-fitted. This process was repeated 1,000 times. where ML1 and ML2 are the estimated/predicted
Both the computation of the confidence intervals mantle length at time t1 and t2, respectively. In addi-
for the estimated parameters and the prediction are tion to the point estimates, we also computed 95%
based on the bootstrap generated parameters. For all confidence interval by bootstrapping as part of the
growth models fitted, the standard model diagnos- growth model fitting.
tics were checked: plots of residuals vs. fitted values All the analyses, visualisation and report genera-
(if models are valid this plot should show relatively tion were in R (R Core Team 2020). Multiple R pack-
random distribution of points), and quantile-quan- ages were utilised for data processing, visualisation,
tile plots of residuals (to check if the residuals devi- analysis, and summary of results including Alathea
ate from theoretical expectation under normal distri- (2015), Elzhov et al. (2016), Henry & Wickham
bution). (2019), Allaire et al. (2020), Robinson & Hayes
Daily growth rate (mm/day) DGR and Instanta (2020), Wickham et al. (2020a, b) and Xie (2020).
neous Growth Rate (IGR) were estimated as shown
RESULTS
The length frequency distributions of L. reynaudii of the residuals of the four growth models fitted to
for each of the years 2003 & 2004 and for both years the data (Fig. 3) show no apparent systematic pat-
combined are presented in Figure 1 (Kernel density). tern, indicating no bias in the model estimates. The
The mantle length size ranged from 71 to 425 mm in appreciably wider scatter of the residuals for males
males and from 83 to 263 mm in females during the relative to females clearly shows the generally poor-
two survey years. er fit of the models to the male data (apparent in
The fits of the four growth models to the observed the performance measures in Table 2). The Schnute
size at age data are illustrated in Figure 2. It is appar- and Francis growth models performed equally well
ent that the Linear and Power models yield similar in all fits to the data (Table 2) and showed better
estimates of chokka squid growth, but these differ performance than did the linear and power models.
somewhat from those yielded by the Schnute and The Francis growth model was, however, selected for
Francis models, which were almost identical. Plots further analyses of the year-specific data because the
156                                        Collette H. Mwanangombe et al.

Schnute model could not be fitted (no convergence to         Table 2. Performance measures for four growth models
a numerical solution) to all of the year-specific cases         (Linear, Francis, Power and Schnute) and different data
considered. The Francis model results (Table 3, Fig.            types (All data, Male, and Female). Four model perfor-
                                                                mance measures were considered: Akaike Information
4) indicate that at relatively young ages, growth rates
                                                                Criterion (AIC), Bayesian Information Criterion (BIC),
of male and female L. reynaudii were not apprecia-
                                                                Root Mean Squared Error (RMSE), and Mean Absolute
bly different, but that as ages increased, males grew           Error (MAE)
substantially faster than females. Separate Francis
                                                               sex  model_name         AIC       BIC     RMSE    MAE
growth models fitted to size at age data for each sam-
pling year (2003 and 2004) show that the growth              All    Francis          6325.39   6342.79   59.96   50.60
of the squid sampled in 2003 appears to be faster                   Linear           6326.80   6339.86   60.14   50.58
than that of those sampled in 2004 (Fig. 5), and that               Power            6327.48   6340.54   60.17   50.75
males in both years grew faster in length with in-                  Schnute          6325.39   6342.79   59.96   50.60
creasing age compared to females. The Linear growth          Male   Francis          3307.88   3322.75   55.06   42.37
model (Table 4) provided an “overall” measure of                    Linear           3312.42   3323.57   55.66   43.77
growth rate as an increase in size per day: 0.75–1.02               Power            3313.65   3324.80   55.77   43.95
mm/d for males, 0.32–0.45 mm/d for females and                      Schnute          3307.88   3322.75   55.06   42.37
0.64–0.86 mm/d for sexes combined.                           Female Francis          2437.49   2451.87   22.13   17.28
    The DGR and instantaneous growth rate (G)                       Linear           2456.88   2467.66   23.03   18.09
generally declined with age and appeared to vary be-                Power            2452.78   2463.57   22.85   17.94
tween sex (Figs 6–7).                                               Schnute          2437.49   2451.87   22.13   17.28

Fig. 1. Female and male length distribution of Loligo reynaudii between Plettenberg Bay and Port Alfred for the surveys
    conducted during November/December of 2003 and 2004. Median and maximum length of squid for each sex and year
    are represented by the dots. Kernel density graph, therefore there is no y axis

Fig. 2. Fits from the four growth models (Francis, Power, Linear and Schnute) for males, females, and all individuals
    combined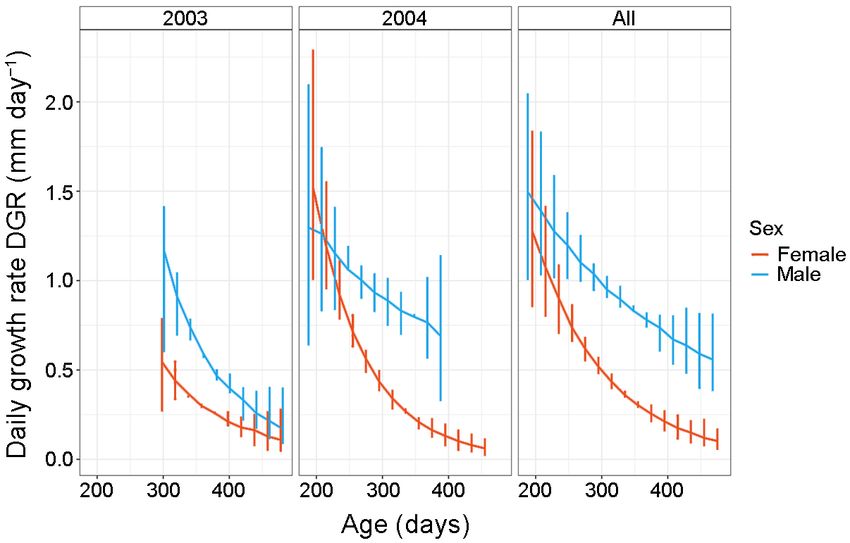
Growth rates of chokka squid                                             157

Fig. 3. Residual plots for the four growth models fitted to the size at age data for males, females and all combined

Fig. 4. Sex-specific observed mantle lengths (mm) at age (dots) pooled for both sampling years (2003 and 2004), with
    the Francis growth models fitted to the data. Solid lines represent the median of predicted mantle length. Light brown
    and light blue envelopes represent the 50% and 95% confidence intervals, respectively

Table 3. Summary statistics (median, upper and lower 2.5%
   quantiles) of estimated growth parameters for males,
   females and all data combined. Francis growth model
   sex      terms     quant_2.5    quant_50    quant_97.5      Table 4. Summary statistics of estimated growth parame-
All           L1        88.13       110.99       132.82           ters for males, females and all data combined. Linear
              L2       196.63       202.97       209.56           growth model
              L3       262.87       272.27       281.99            sex     terms     quant_2.5    quant_50    quant_97.5
Female        L1        81.57        99.42       116.03         All          a       −59.35       −23.65        12.04
              L2       169.53       173.28       177.01                      b          0.64         0.75        0.86
              L3       197.94       203.45       208.80         Female       a         33.49       56.14        76.70
Male          L1        94.10       122.20       147.02                      b          0.32         0.38        0.45
              L2       228.58       236.85       245.40         Male         a       −79.28       −34.65        13.10
              L3       305.71       317.48       327.50                      b          0.75         0.89        1.02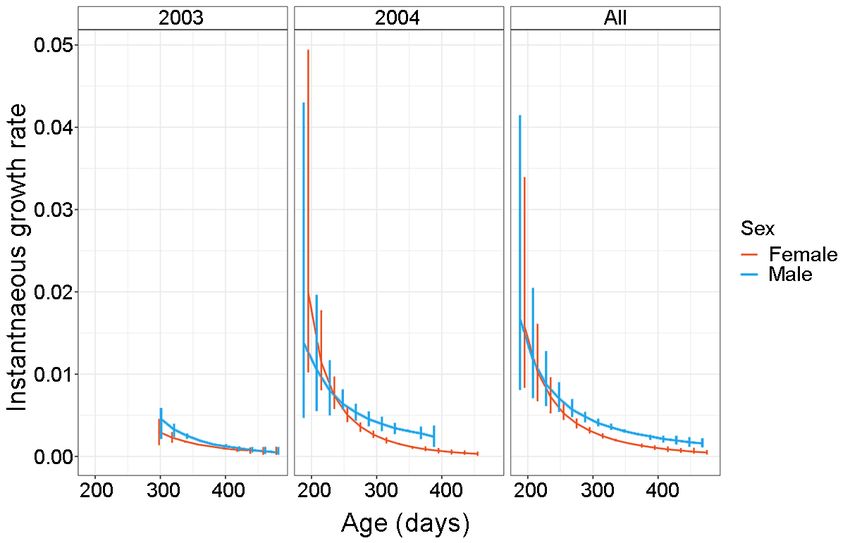
158                                         Collette H. Mwanangombe et al.

Fig. 5. Year-specific observed mantle lengths at age (dots) with the Francis growth models fitted to the data. Solid lines
    represent the median of predicted mantle length. Light brown and light blue envelopes represent the 50% and 95%
    confidence intervals, respectively

Fig. 6. Daily growth rates, mantle size (mm/day) for females and males for the two sampling years (2003 and 2004) and
    the combined data. Error bars represent 95% confidence interval

Fig. 7. Instantaneous growth rate for females and males for the two sampling years (2003 and 2004) and the combined
    data. Error bars represent 95% confidence interval
Growth rates of chokka squid 159
DISCUSSION
Considering that the data used in this study only by the different sampling methods, where 2003 data
covered the middle and later parts of the chokka were collected only by jigging and 2004 data were
squid life cycle and that the data were collected in collected both by jigging and trawl. However, this
a limited part of the species distribution range, we influence is considered small as ages (Lipiński et al.
note that growth of the whole population of chokka 2020) and length frequencies (Fig. 1) for both years
cannot be discussed here. Likewise, precision of age were similar for smaller squid, especially males.
readings (e.g. Campana 2001) was somewhat com- There are a number of reviews on growth in ceph-
promised, due to logistical reasons, by the use of only alopods (Jackson 1994, Lipiński 2002, Arkhipkin
one statolith reader (albeit experienced in reading 2004, Jackson & McGlashan 2004, Arkhipkin &
both otoliths and statoliths) and only one reading, as Roa-Ureta 2005) as well as some more recent con-
in the linked study by Lipiński et al. (2020). However, siderations (e.g. Schwarz & Perez 2010, Grist et
it is believed that in the light of the present results al. 2011, Jin et al. 2019). It has been recognised that
being comparable with a previous study (Lipiński & understanding and describing cephalopod growth
Durholtz 1994 vs. Lipiński et al. 2020) these re- are difficult (Moltschaniwskyj 2004). Early stud-
sults may be accepted, and outweigh rejection on ies (eg. Jackson 1990, Gonzalez et al. 1996) sug-
the grounds that the requirement of precision is not gested that growth of squid could best be described
met. The growth rates in this paper concern adult by a linear model. Other studies (e.g. Yang et al.
life stages of a single, but very important and exploit- 1986, Lee et al. 1994, Hatfield et al. 2001) report-
ed cohort. Grist et al. (2011) have warned against ed considerable differences between growth models
spurious growth models and equations arising from of cephalopods grown in different conditions (e.g. in
uncritical lumping of various cohorts with drastically different temperature regimes). Arkhipkin (2004)
different growth trajectories and patterns. The linear pointed out that maximum relative growth rates
models fitted to the data during this study suggest- were observed during the paralarval stage, quoting
ed that the relative growth rates of the chokka squid Forsythe & Heukelem’s (1987) data. However,
may be low in comparison with other values for lolig- these data were obtained for paralarvae kept in aquar-
inids. For example, Jin et al. (2019) found that such ia (therefore fed ad libitum) and not in their natural
values for Uroteuthis chinensis (Gray, 1849) were 5.17 environment (see also Grist et al. 2011: p. 117). At
mm/d and 2.46 mm/d for males and females, respec- least some data from the latter (e.g. Natsukari et
tively; for U. edulis (Hoyle, 1885) they were: males al. 1988, Bigelow 1992) show the opposite: the in-
1.71 mm/d, females 2.05 mm/d. This may be char- itial phase of paralarval growth is in fact the slowest
acteristic for the older life stages where growth rates stage (Bigelow 1992: fig. 7, first few days; Vidal et
are declining (Natsukari et al. 1988, Schwarz & al. 2002: reporting “no net growth” during the first
Perez 2010). 10–15 days), despite exponential growth phase later.
Interestingly, L. reynaudii resembles U. chinensis in If this is confirmed with a larger sample size and for
that the growth of males is more than double that of many species, a three-phase growth for cephalopods
females. While the results of this study have there- may be most plausible: paralarval (linear followed by
fore confirmed the sexual dimorphism in the chokka exponential during the “vertical movement” phase of
squid growth and highlighted the large inter-annual the paralarvae), juvenile and early adult (exponen-
variation in growth (Figs 6–7), further work encom- tial); late adult (asymptotic), as was suggested by
passing data from all life stages, seasons, areas and Jackson (2004) working with loliginid squid.
as many years as possible is required for a proper un- The large individual variation has led to two dif-
derstanding and quantification of the growth of this ferent approaches in considering cephalopod growth:
species. However, growth rates from a single cohort fitting available models to available length and/or
of squid, investigated on a large sample and repeated weight data (most often in situ, but also from aquari-
for at least two years, highlight growth ranges, dif- um rearing) (e.g. Arkhipkin & Roa-Ureta 2005); or
ferences between sexes, differences between years, open-ended, flexible, currently energy balance-based
and growth type (slow – fast; variable – steady) (Figs models (Grist & Jackson 2004, O’Dor et al. 2005,
6–7). This simple material shows some possible in- Grist et al. 2011). However, given that growth mod-
terpretation complications, such as possible limited els typically do not fit squid size at age data very well
presence of sneaker males in the sample, which may (Natsukari et al. 1988, Schwarz & Perez 2010,
have similar ages as large males but, obviously, very present data: Fig. 2) and energy balance equations
different growth rates (references concerning sneaker are generally too broad, lacking useful detail and
presence: Sauer et al. 2013). In addition, difference resolution, we are of the opinion that estimates of
in growth between years may have been influenced growth rate changes over time (e.g. Arkhipkin 1994:160 Collette H. Mwanangombe et al. fig. 9–10, Arkhipkin et al. 1999: fig. 9EF, present ACKNOWLEDGEMENTS paper: Figs 6–7) are more useful to evaluate squid growth during the full life cycle. Of course, it should The South African Squid Management Industrial be appreciated that even if they cover the entire life Association (SASMIA) is acknowledged for fund- cycle, they are imprecise in determining the lower ing the project, and the former Department of and especially upper growth rates for a given spe- Agriculture, Forestry and Fisheries for access to the cies. This is because of large natural variability in data. Many of our professional colleagues participat- that part of the life cycle, including responses to, for ed in the data collection – their input is gratefully example, environmental factors, food availability acknowledged. Prof. Coleen Moloney (UCT) and etc. (Natsukari et al. 1988). A full understanding Dr Lisa Hendrickson (NMFS NOAA, USA) are of these fluctuations and their determinants is (ide- thanked for the discussions on cephalopod growth ally) required for accurate life cycle models, popu- and various comments and inputs. Finally, The lation dynamics models, and fisheries management Rhodes University (Department of Ichthyology and decisions. Fisheries Science) provided logistics and support. REFERENCES Alathea L. 2015. Captioner: numbers figures and creates Elzhov T. V., Mullen K. M., Spiess A.-N., Bolker B. 2016. simple captions. Available online at https://rdrr.io/ Minpack.lm: R interface to the Levenberg-Marquardt cran/captioner/ (accessed 25 February 2021). nonlinear least-squares algorithm found in minpack, Allaire J., Xie Y., McPherson J., Luraschi J., Ushey plus support for bounds. Available online at https:// K., Atkins A., Wickham H., Cheng J., Chang W., CRAN.R-project.org/package=minpack.lm (accessed Iannone R., Dunning A., Yasumoto A., Schloerke 25 February 2021). B., Sievert J., Dervieux C., Ryan M., Aust F., Allen Forsythe J. W., Heukelem W. F. van 1987. Growth. In: J., Seo J.Y., Barrett M., Hyndman R., Lesur R., Boyle P. R. (ed.). Cephalopod life cycles. Vol. II, com- Storey R., Arslan R., Oller S. 2020. R markdown: parative reviews. Academic Press, London, pp.135–156. Dynamic documents for r. Available on line at https:// Gonzalez A. F., Castro B. G., Guerra A. 1996. Age CRAN.R-project.org/package=rmarkdown (accessed and growth of the short-finned squid Illex coindetii in 25 February 2021). Galician waters (NW Spain) based on statolith analysis. Arkhipkin A. I. 1994. Age, growth and maturation of the ICES Journal of Marine Science 53: 802–810. squid Enoploteuthis leptura (Oegopsida: Enoploteuthidae) https://doi.org/10.1006/jmsc.1996.0101 from the central-east Atlantic. Journal of Molluscan Grist E. P. M., Jackson G. D. 2004. Energy balance as a de- Studies 60: 1–8. terminant of two-phase growth in cephalopods. Marine https://doi.org/10.1093/mollus/60.1.1 and Freshwater Research 55: 395–401. Arkhipkin A .I. 2004. Diversity in growth and longevity in https://doi.org/10.1071/MF03154 short-lived animals: squid of the suborder Oegopsina. Grist E. P. M., Jackson G. D., Meekan M. G. 2011. Does a Marine and Freshwater Research 55: 341–355. snapshot show the whole picture? Intrinsic limitations https://doi.org/10.1071/MF03202 to growth inference of the short lived and fast growing. Arkhipkin A. [I.], Laptikhovsky V., Golub A. 1999. Environmental Biology of Fishes 90: 111–120. Population structure and growth of the squid Todarodes https://doi.org/10.1007/s10641-010-9723-9 sagittatus (Cephalopoda: Ommastrephidae) in north- Hatanaka H. 1986. Growth and life span of short-finned west African waters. Journal of the Marine Biological squid Illex argentinus in the waters off Argentina. Association of the U.K. 79: 467–477. Bulletin of the Japanese Society of Scientific Fisheries https://doi.org/10.1017/S0025315498000599 52: 11–17. Arkhipkin A. I., Roa-Ureta R. 2005. Identification of https://doi.org/10.2331/suisan.52.11 ontogenetic growth models for squid. Marine and Hatfield E. M. C., Hanlon R. T., Forsythe J. W., Grist Freshwater Research. 56: 371–386. E. P. M. 2001. Laboratory testing of a growth hypoth- https://doi.org/10.1071/MF04274 esis for juvenile squid Loligo pealeii (Cephalopoda: Bigelow K. A. 1992. Age and growth in paralarvae of Loliginidae). Canadian Journal of Fisheries and Aquatic the mesopelagic squid Abralia trigonura based on dai- Sciences 58: 845–857. ly growth increments in statoliths. Marine Ecology https://doi.org/10.1139/f01-030 Progress Series 82: 31–40. Henry L., Wickham H. 2019. Purrr: Functional program- https://doi.org/10.3354/meps082031 ming tools. Available online at https://CRAN.R-project. Campana S. E. 2001. Accuracy, precision and quality con- org/ package=purrr. (Accessed 25 February 2021) trol in age determination, including a review of the use Jackson G. D. 1990. Age and growth of the tropical near- and abuse of age validation methods. Journal of Fish shore loliginid squid Sepioteuthis lessoniana determined Biology 59: 197–242. from statolith growth-ring analysis. Fishery Bulletin https://doi.org/10.1111/j.1095-8649.2001.tb00127.x U.S. 88: 113–118.
Growth rates of chokka squid                                             161

Jackson G. D. 1994. Application and future potential of           1885). Journal of the Experimental Marine Biology and
   statolith increment analysis in squids and sepioids.           Ecology 116: 177–190.
   Canadian Journal of Fisheries and Aquatic Sciences 51:         https://doi.org/10.1016/0022-0981(88)90054-8
   2612–2625.                                                  O’Dor R., Aitken J., Jackson G. D. 2005. Energy balance
   https://doi.org/10.1139/f94-261                                growth models: applications to cephalopods. Phuket
Jackson G. D. 2004. Advances in defining the life histories       Marine Biological Center Research Bulletin 66: 329–
   of myopsid squid. Marine and Freshwater Research 55:           336.
   357–365.                                                    Ogle D. H. 2016. Introductory fisheries analyses with R.
   https://doi.org/10.1071/MF03152                               Vol. 32. CRC Press, Boca Raton.
Jackson G. D., McGlashan D. J. (eds). 2004. Cephalopod           https://doi.org/10.1201/b19232
   growth. Marine and Freshwater Research 55: 327–446.         R Core Team. 2020. R: A language and environment for
   https://doi.org/10.1071/MF04075                                statistical computing. R Foundation for Statistical
Jin Y., Li N., Chen X., Liu B., Li J. 2019. Comparative age       Computing, Vienna, Austria. Available online at https://
    and growth of Uroteuthis chinensis and Uroteuthis edulis      www.R-project.org/ (Accessed 25 February 2021).
    from China Seas based on statolith. Aquaculture and        Ricker W. E. 1979. Growth rates and models. In: Hoar W.
    Fisheries 4: 166–172.                                         S., Randall D. J., Brett J. R. (eds). Fish Physiology, III,
    https://doi.org/10.1016/j.aaf.2019.02.002                     Bioenergetics and Growth, Academic Press, New York,
Lee P. G., Turk P. E., Yang W. T., Hanlon R. T. 1994.             pp. 677–743.
   Biological characteristics and biomedical applications         https://doi.org/10.1016/S1546-5098(08)60034-5
   of the squid Sepioteuthis lessoniana cultured through       Robinson D., Hayes A. 2020. Broom: Convert statis-
   multiple generations. Biological Bulletin 186: 328–341.       tical analysis objects into tidy tibbles. Available on-
   https://doi.org/10.2307/1542279                               line at https://CRAN.R-project.org/package=broom
Lipiński M. R. 2002. Growth of cephalopods: a conceptual         (Accessed 25 February 2021).
    model. Abhandlungen der Geologischen Bundesanstalt         Sauer W. H. H., Smale M. J., Lipiński M. R. 1992. The
    57: 133–138.                                                  location of the spawning grounds, spawning and
Lipiński M. R., Durholtz M. D. 1994. Problems associ-             schooling behaviour of the squid Loligo vulgaris reynaudii
    ated with ageing squid from their statoliths: towards         (Cephalopoda: Myopsida) off the Eastern Cape coast,
    a more structured approach. Antarctic Science 6: 215–         South Africa. Marine Biology 114: 97–107.
    222.                                                          https://doi.org/10.1007/BF00350859
    https://doi.org/10.1017/S0954102094000337                  Sauer W. H. H., Downey N. J., Lipiński M. R., Roberts
Lipiński M. R., Hampton I., Sauer W. H. H., Augustyn              M. J., Smale M. J., Shaw P., Glazer J., Melo Y. 2013.
    C. J. 1998. Daily net emigration from a spawning con-         Loligo reynaudii, Chokka Squid. In: Rosa R., O’Dor
    centration of chokka squid (Loligo vulgaris reynaudii         R., Pierce G. (eds). Advances in squid biology, ecolo-
    d’Orbigny, 1845) in Kromme Bay, South Africa. ICES            gy and fisheries. Part 1. Nova Science Publishers, Inc.,
    Journal of Marine Science 55: 258–270.                        Hauppauge, New York, pp. 33–64.
    https://doi.org/10.1006/jmsc.1997.0271                     Schwarz R., Perez J. A. A. 2010. Growth model identifica-
Lipiński M. R., Mwanangombe C. H., Durholtz D.,                   tion of short-finned squid Illex argentinus (Cephalopoda:
    Yemane D., Githaiga-Mwicigi J., Sauer W. H. H.                Ommastrephidae) off southern Brazil using statoliths.
    2020. Age estimates of chokka squid (Loligo reynaudii         Fisheries Research 106: 177–184.
    d’Orbigny, 1845) off South Africa and their use to test       https://doi.org/10.1016/j.fishres.2010.06.008
    the effectiveness of a closed season for conserving this   Vidal E. A. G., DiMarco F. P., Wormuth J. H., Lee P. G.
    resource. African Journal of Marine Science 42: 461–          2002. Influence of temperature and food availability on
    471.                                                          survival, growth and yolk utilization in hatchling squid.
    https://doi.org/10.2989/1814232X.2020.1842804                 Bulletin of Marine Science 71: 915–931.
Lipiński M. R., Underhill L. G. 1995. Sexual matura-           Vyver J. S. F. van der, Sauer W. H. H., McKeown
    tion in squid: quantum or continuum? South African            N. J., Yemane D., Shaw P. W., Lipiński M. R. 2016.
    Journal of Marine Science 15: 207–223.                        Phenotypic divergence despite high gene flow in chok-
    https://doi.org/10.2989/02577619509504844                     ka squid Loligo reynaudii (Cephalopoda: Loliginidae):
Lipiński M. R., Vyver J. S. F. van der, Shaw P., Sauer            implications for fishery management. Journal of the
    W. H. H. 2016. Life cycle of chokka squid Loligo reynau-      Marine Biological Association of the United Kingdom
    dii in South African waters. African Journal of Marine        96: 1507–1525.
    Science 38: 589–593.                                          https://doi.org/10.1017/S0025315415001794
    https://doi.org/10.2989/1814232X.2016.1230074              Wickham H., Chang W., Henry L., Pedersen T. L.,
Moltschaniwskyj N. A. 2004. Understanding the pro-                Takahashi K., Wilke C., Woo K., Yutani H.,
  cess of growth in cephalopods. Marine and Freshwater            Dunnington D. 2020a. Ggplot2: Create elegant data
  Research 55: 379–386.                                           visualisations using the grammar of graphics. Available
  https://doi.org/10.1071/MF03147                                 online at https://CRAN.R-project.org/package=gg-
Natsukari Y., Nakanose T., Oda K. 1988. Age and                   plot2 (Accessed 25 February 2021).
  growth of loliginid squid Photololigo edulis (Hoyle,         Wickham H., Francois R., Henry L., Müller K. 2020b.
                                                                  Dplyr: A grammar of data manipulation. Available on-
162 Collette H. Mwanangombe et al. line at https://CRAN.R-project.org/package=dplyr maturation of the market squid, Loligo opalescens, cul- (Accessed 25 February 2021). tured through the life cycle. Fishery Bulletin U.S. 84: Xie Y. 2020. Knitr: A general-purpose package for dynam- 771–798. ic report generation in r. Available online at https:// Received: March 22nd, 2021 CRAN.R-project.org/package=knitr (Accessed on 25 Revised: May 1st/June 14th, 2021 February 2021). Accepted: June 23rd, 2021 Yang W. T., Hixon R. F., Turk P. E., Krejci M. E., Hulet W. Published on-line: July 11th, 2021 H., Hanlon R. T. 1986. Growth, behavior, and sexual
You can also read


