Guide for ventilation towards healthy classrooms - December 2020 - SCOEH
←
→
Page content transcription
If your browser does not render page correctly, please read the page content below
Guide for ventilation towards
    healthy classrooms

                            December 2020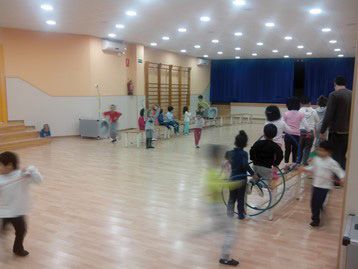
Guide for ventilation towards healthy classrooms.
     • María Cruz Minguillón, Xavier Querol, Andrés Alastuey, Institute of Environmental Assessment
       and Water Research, IDAEA – CSIC, Spain.
     • Michael Riediker, Swiss Centre for Occupational and Environmental Health, SCOEH, Switzerland.
     • José Manuel Felisi, Tomás Garrido, MESURA, Spain.
     • Gabriel Bekö, Department of Civil Engineering, Technical University of Denmark, Denmark.
     • Sascha Nehr, European University of Applied Sciences, Brühl, Germany.
     • Peter Wiesen, Institute for Atmospheric and Environmental Research, University of Wuppertal, Germany.
     • Nicola Carslaw, Department of Environment and Geography, University of York, York, United Kingdom.

Promoted by the COST Action CA17136 INDAIRPOLLNET, the Government of Valencia and the Spanish Ministry of Science and Innovation.

Authors of this report are members of INDAIRPOLLNET (INDoor AIR POLLution NETwork), a network of ~200 scientists from 36 countries,
mainly around Europe. INDAIRPOLLNET aims to significantly advance the field of indoor air pollution science, to highlight future research
areas, and to bridge the gap between research and business to identify appropriate mitigation strategies that optimise indoor air quality.
This report will provide guidance to schools around Europe (and beyond) on best practice around ventilating their school buildings to
minimise exposure to COVID-19 indoors. It aims to enable school managers to understand how the virus can accumulate and be transmitted
in school buildings, and also suggests practical measures for reducing the viral load and hence transmission between occupants of school
buildings.

                                                          COST (European Cooperation in Science and Technology) is a funding agency for research
                                                          and innovation networks. Our Actions help connect research initiatives across Europe and
                                                          enable scientists to grow their ideas by sharing them with their peers. This boosts their
                                                          research, career and innovation.
                                                          www.cost.eu        https://indairpollnet.eu

Suggested citation: Minguillón MC, Querol X, Riediker M, Felisi JM, Garrido T, Alastuey A, Bekö G, Nehr S, Wiesen P, Carslaw N., 2020. Guide for ventilation towards healthy
classrooms. COST Action CA17136 report. CSIC publications http://hdl.handle.net/10261/225519.
                                                                                                                                                                               2
Summary

                               Reduce the number of students per classroom

          Outdoors
    preferable to indoors      Maintain a safe distance between students

 Silence or speaking quietly              Use a well-fitted mask

                                                                             3
Summary
Reduce time indoors Ensure sufficient ventilation
Provide air cleaning Monitor CO2 levels
4Index
About this guide on healthy indoor air in classrooms 6
Need-to-know information 8
Ventilation & air cleaning 9
Risk of infection 11
Other considerations 12
PART I:
VENTILATION & AIR
CLEANING

                    13
Solution-finder flow chart 14
Solutions 15
Solution 1. Outdoors 16
Solution 2. Natural ventilation 17
Solution 3. Single-room mechanical ventilation 20
Solution 4. Centralised mechanical ventilation 23
Solution 5. Air cleaning 26
Verifying the ventilation efficiency using CO2 sensors 30
Method 1: Determination of air change rate 31
Method 2: Determine the target steady-state CO2 concentration 35
Limitations of these methods 39
Desirable characteristics of CO2 sensors 40
PART II. INFECTION
RISK ASSESSMENT

                     42
Virus emission and virus dose required for infection 43
Simulations of school scenarios 44
Simulations for other situations 47
DISCLAIMER

             48
5About this guide on healthy indoor air in classrooms
• This guide is intended as a tool to reduce the potential spread of the SARS-CoV-2 virus through aerosol
transmission. Strategies and possible solutions for ventilation in classrooms are provided, alongside tools to
evaluate the implemented ventilation strategies.
• This guide has two parts. Part I focuses on how to maintain healthy indoor air in classrooms to reduce the risk
of transmission of SARS-CoV-2 via aerosols, including ventilation and air cleaning, and how to check if the
ventilation is sufficient to reduce risk using CO2 as a tracer. Part II focuses on simulations of risk of infection
under different scenarios (tackled in Part I) in a classroom.
• This guide is based on the Harvard University Guide (https://schools.forhealth.org) and other experimental
studies on ventilation and filtration, as well as on modelling work by SCOEH (https://scoeh.ch).
• The guide can be applied to other types of indoor spaces, such as offices or other public buildings, though
some adjustments may be needed for physical characteristics (e.g. area and volume).
• The use of masks, maintaining physical distance, and upholding hygiene measures, as recommended by
governments and health experts, must be adhered to in conjunction with the strategies described here.
• The measures described here aim to reduce the risk of contagion, but they do not eliminate the risk entirely.
This guide should not replace the professional service provided by ventilation and air cleaning specialists. Individual
spaces may require specific solutions and complex calculations that may need to be performed by technical specialists
and professionals.
6NEED-TO-KNOW
INFORMATION
7Need-to-know information
• The risk of transmission of SARS-CoV-2 is greater in indoor areas than in outdoor areas. Performing activities outdoors is always
preferred where and whenever possible.
• Tiny particles held in suspension in the air, known as aerosols, emitted by an infected person can carry and transmit the virus. These
aerosols can accumulate in poorly ventilated indoor spaces, and increase exposure to these aerosols, which can result in infection.
Reducing the emission of and exposure to these aerosols will reduce the risk of infection.
• How much virus accumulates in the air can be estimated with an Indoor Scenario Simulator. Factors that affect are: room size and
ventilation, activity of infectious person (talking, shouting, physical activity), type of masks worn by the infectious and the other people in
the room.
• The emission of virus-carrying aerosols can be decreased by:
- Reducing the number of people in shared indoor spaces
- Wearing a well-fitted mask made of aerosol-filtering material
- Speaking quietly or maintaining silence (speaking loudly or shouting can increase the emission of aerosols by a factor of 30 to 50)
- Physical activity only in well-ventilated large halls or outdoors (increased physical activity increases emissions)
• The exposure to virus-carrying aerosols can be reduced by:
- Using a well-fitted mask, even while alone in a room that has been recently occupied by others
- Reducing the time for potential exposure
- Increasing the physical distance between individuals
- Ventilation or air cleaning to reduce the concentration of or eliminate the virus-carrying aerosols in the air
8Ventilation & Air Cleaning
• Ventilation involves the continuous replacement of potentially virus-contaminated indoor air with virus-uncontaminated
outdoor air. Note that using a fan in an enclosed indoor environment simply recirculates potentially virus-contaminated air in the
enclosed space. Therefore, fans are not considered equivalent to ventilation systems that replace indoor air with outdoor air.
• When using fans at doors or windows to help replace air, point them to the outside so that air is exhausted from the room rather
than blown into the room. Otherwise there is a risk that large droplets and aerosols (carrying viruses) are moved from one person to
another.
• Air cleaning consists of the removal from the air of suspended particulates that potentially carry the virus. Filtration is the
simplest and most effective method of air cleaning.
• The ventilation is defined parametrically as Air Change Rate (ACR) with its unit air changes per hour (h-1). For instance, an ACR of 1
h-1 (1 air change per hour) means that there is an hourly flow of outdoor air equal to the volume of the indoor space. Due to the
continuous mixing of outdoor and indoor air, an ACR= 1 h-1 results in a 63% replacement of indoor air with outdoor air in one hour. For
ACR= 2 h-1, 86% of the indoor air is replaced, and for ACR= 3 h-1, 95% of the indoor air is replaced in one hour.
• The ventilation rate needed to reduce the risk of infection depends on the volume of air in the room, the number and age of the
occupants, their activities, the case incidence in the region, and the risk level deemed acceptable. The Harvard Guide recommends 5-6
air changes per hour in classrooms of 100 m² with 25 students of 5-8 years of age. The Harvard Guide has established the following
classification:
ACR (h-1) Ventilation
6 5-6 4-5 4-3• The air change rate is related to the outdoor air flow as:
Outdoor air flow
ACR
Volume of air in the room
• Another way to measure the required ventilation is the volume of outside air entering per person per unit of time (flow per person).
• The equivalence between ACR and the flow of air per person is not always the same and may change for different room sizes and
different occupancy density (m² per person). For occupancies of about 4 m²/ person and normal ceiling height, an ACR of 5 h-1
corresponds to 14 litres per person per second. Hence this value of flow of air per person is considered a reasonable value to
reduce the risk of infection.
• The relation between these two parameters is described by:
ACR
where Volume of air in the room
ACR is in h-1
Flow per person is in litres per person per second
Number of people is the number of people in the room
Volume of air in the room is in m³
3600 is a conversion factor for units of time
0.001 is a conversion factor for units of volume
• Ventilation and occupancy may be adjusted according to the risk deemed acceptable. Zero risk of transmission is not
possible—however, higher ventilation lowers the risk of infection.
• Ventilation in an indoor space can be approximately measured by monitoring the levels of CO2. The concentration of CO2 in
outdoor air is approximately 420-480 ppm (parts per million). In occupied indoor spaces, CO2 will be elevated relative to outdoor air
due to the CO2 exhaled by the occupants in the room. These CO2 levels can be used to calculate air change rates in a given space
under specific conditions (see further sections).
10Risk of infection
• The infection risk depends on the number of virus particles inhaled. This depends on the number of viral particles in
the air and how much of that air is inhaled. Adults have a higher respiration rate than small children, as do people exercising
relative to those resting.
• To have viral particles in the air, a source (an infectious person), must be present in the room. Not all infected persons
emit the same number of viral particles. About 1 in 10 infected people will emit sufficient viral particles to infect others
via the air.
• One very infectious person (superspreader) in a room is sufficient to infect everybody else in the room, especially if
the infected person is not wearing a mask.
• An infectious person emits the highest number of viruses from a few days before they start to have symptoms until a
few days later. In this most infectious time they often have no fever. Asymptomatic infected people also emit viral
particles.
• People with symptoms, namely those coughing, emit extremely high amounts of viral particles.
• An infectious person speaking, especially speaking or singing loudly, emits many more viral particles than a silent one.
• In most indoor situations, wearing a well-fitted mask helps in preventing infection, especially if both the emitter and the
receiver wear a mask.
• Good ventilation and avoiding lengthy gatherings in small rooms are effective measures. However, they are often not
sufficient as stand-alone solutions. It is advised to combine them with wearing masks.
11Other considerations
• Where mechanical ventilation is not available, natural ventilation might be used. A compromise will have to be reached between
thermal comfort during colder periods and the risk of infection. Warm, comfortable clothing can be worn indoors when windows
are left open for ventilation to avoid the excessive use of heating.
• Natural ventilation may not always be a viable option under some meteorological conditions. In such cases, solutions should be
implemented in advance of expected weather changes (such as before the onset of winter). Mechanical ventilation and/or air
cleaning should be implemented before unfavourable weather conditions arrive.
• When using air cleaning units, they should be placed in an open space, that allows free air movement. Air cleaning systems with
high efficiency filtration are recommended.
• Mechanical ventilation units require an initial hygienic inspection, recurrent hygiene inspections and an individual hazard
assessment. Measurement techniques and tests in hygiene inspections comprise (i) hygiene tests of water in ventilation and
air-conditioning units, (ii) microbiological testing of surfaces and (iii) air measurements.
• Keeping windows and doors open may create problems with noise. A compromise will have to be made between risks of infection
and discomfort due to noise levels. For instance, controlling the noise levels in school hallways is preferable to closing the doors and
windows.
• Keeping windows open may introduce higher levels of pollution from outdoor air, especially in areas with high outdoor air
pollution. A compromise will have to be made between potential infection by Covid-19 and exposure to outdoor air pollution.
• CO2 concentrations in occupied indoor spaces can increase rapidly due to respiration. This indicates inadequate ventilation and
thus elevated levels of human bioeffluents (emissions). Replacing indoor air with outdoor air reduces the concentrations of these
pollutants, which may cause building related symptoms (e.g. tiredness, sensory irritation, difficulty concentrating). Improved
ventilation will improve the students' attention and performance.
• Low CO2 may reflect low occupancy. Sufficient ventilation should be ensured even at relatively low CO2 levels, since one infected
person is sufficient to cause high viral levels in a room.
12PART I:
VENTILATION & AIR
CLEANING
13Solution-finder flow chart Can the activities
be moved outdoors?
SOLUTION
• Activities should be performed outdoors whenever possible, including meals. 1
YES NO
• If an activity must be carried out indoors, it should be done in classrooms with
adequate ventilation. NO ACTION
SOLUCIÓN
NEEDED
Does the building
have mechanical
• Natural ventilation is better using cross-ventilation, i.e. windows and doors ventilation system?
open on opposite sides of the room.
YES NO
• If natural ventilation is not adequate, extra ventilation can generally be
achieved using exhaust fans or individual outdoor air supply systems with
Centralized
sufficient airflows. mechanical
Natural
ventilation
ventilation
SOLUTION
SOLUTION
• Where centralised mechanical ventilation is available, the outdoor air flow 4 2
should be increased while stopping or diminishing the air recirculation flow. The
filters in the air recirculation flow should be upgraded to as efficient as possible. Does it perfrom Does it perfrom
sufficiently? sufficiently?
NO YES
• If none of the above options are available or sufficient, air should be cleaned YES NO
using portable air cleaners equipped with HEPA filters.
NO ACTION
Can mechanical NEEDED
NO ACTION
ventilation be added?
• The optimum solution may be a combination of some of the above, such as NEEDED
for example a combination of natural ventilation and air cleaning. NO YES
• In the following sections, methods to evaluate the suitability of a given Mechanical
ventilation configuration are described. ventilation
SOLUTION
3
• The correct use of masks, maintaining physical distance, and personal hygiene
measures remain essential elements of all the solutions described here, Air Does it perfrom
including the solution to perform activities outdoors. cleaning sufficiently?
SOLUTION NO YES
5
NO ACTION
NEEDED
14SOLUTIONS
155
Solution 1. Outdoors SOLUTION 1
Activities performed outdoors OUTDOORS
• Outdoors, viral particles emitted by a potentially infectious person are naturally diluted and carried
away from the vicinity of the source.
16Solution 2. Natural ventilation SOLUTION 2
NATURAL
Indoors, where natural ventilation is sufficient (see further information on how this can be determined)
VENTILATION
• This solution increases the outdoor air change rate (ACR) without using mechanical equipment, for example, by opening
windows and doors to promote airflow.
• Cross-ventilation consists of opening windows and doors on opposite sides of a room. Cross-ventilation is more effective
than opening windows and doors on the same side of a room and is therefore preferable. In most cases, sufficient ventilation
cannot be achieved without cross-ventilation.
• Outdoor conditions affect the effectiveness of natural ventilation. The ventilation provided by a particular configuration of
windows and doors may change with wind direction, speed and indoor/outdoor temperature differences.
• Different configurations of open windows and doors should be tested (see further information on how performing these
tests).
• Natural ventilation can be enhanced by placing a fan facing an exterior window, with the airflow directed outdoors, so that
the rate of extraction of indoor air is increased. This can technically also be considered single-room mechanical ventilation,
and would therefore be similar to Solution 3.
Cross-ventilation Windows open and doors closed
17CLOSED
SOLUTION 2
CLOSED
NATURAL
CLOSED
VENTILATION
Variations in CO2 concentrations indicating the rate of air
change under different ventilation configurations
R1 all windows and doors closed CLOSED
R2 windows closed and doors open
CLOSED
2.500 R3 windows and doors open. Cross-ventilation
R4 windows and doors open. Cross-ventilation favoring diagonal air flow OPEN
2.000
1.500
R3
OPEN
CO� (ppm)
CLOSED
OPEN
1.000
500
CLOSED
R4
0 OPEN
0 10 20 30 40 50 60 70
OPEN
Time (minutes)
18Example of natural ventilation SOLUTION 2
Variations in CO2 concentrations in a classroom under different ventilation configurations.
NATURAL
VENTILATION
Dashed line: estimated trend of CO�
concentrations under conditions without ventilation
Door & windows open
No ventilation Door open Door & windows open Door & windows open
21 students 21 students 21 students 21 students 2 students
1.200 ACR = 5 h-1, CO� concentration = 1190 ppm
1.100
1.000
900 Dynamic play
in the classroom
CO� (ppm)
800 ACR = 10 h-1, CO� concentration = 804 ppm
700
ACR = 18 h-1, CO� concentration = 633 ppm
600
500
400
9:00 9:15 9:30 9:45 10:00 10:15 10:30 10:45 11:00 11:15 11:30
In this example, the classroom volume is 61 m³ and it is CO2 levels reach 1000 ppm. This increase is halted when the doors
occupied by 21 infant students and one teacher. For this are opened. When both the windows and doors are opened in a
occupancy, more than 5 air changes per hour are cross-ventilation configuration, CO2 levels begin to decrease. The
recommended. In the adjoining graph, the variations in eventual stabilisation of the CO2 levels indicates that the CO2
concentrations of CO2 in indoor air are shown under steady concentration can be compared to the calculated target
state conditions at 5, 10, and 18 air changes per hour (the last concentration in steady-state. As it is below 804 ppm, this means
value is equivalent to airfow of 14 liters per person per that 10 air changes per hour are reached.
second).
(For details on these calculations, consult the methods at the end
As this example demonstrates, CO2 concentrations increase of Part I of this guide).
over time in the absence of ventilation. Within 45 minutes, https://webmesura.org/mimoco2/
19SOLUTION 3
Solution 3. Single-room mechanical ventilation SINGLE-ROOM
MECHANICAL
Indoors, where natural ventilation is insufficient and single-room mechanical ventilation VENTILATION
is available.
• This solution consists of using mechanical methods to increase the exchange rate of indoor air with outdoor air.
• This solution can be implemented by introducing outdoor air into the room (supply ventilation), removing indoor air
from the room (exhaust ventilation) or both.
• The air supply and exhaust point can be a window, or a specifically designated vent with a fan in the wall or ceiling.
• The necessary flow is calculated according to the required air change rate, taking into consideration that ventilation
methods are cumulative:
Target ACR = Total ACR = ACR (natural ventilation) + ACR (mechanical ventilation)
• The necessary flow will be:
Flow = ACR (mechanical ventilation) * Volume of air in the classroom
• Some times the flow cannot be measured with this type of systems. In those cases, the assessment of the air change
rate achieved must be done similarly to situations with natural ventilation.
20Mechanical air extraction SOLUTION 3
SINGLE-ROOM
MECHANICAL
VENTILATION
EXTRACTION
Mechanical air supply Mechanical air supply from the ceiling
AIR AIR AIR AIR AIR
SUPPLY SUPPLY SUPPLY SUPPLY SUPPLY
AIR
SUPPLY
21SOLUTION 3
Example of mechanical ventilation SOLUCIÓN
SINGLE-ROOM
Variations in CO2 concentrations in a classroom, with and without students, equipped with
single-room mechanical supply ventilation.
3
MECHANICAL
VENTILATION
ACR = 5 h-1, CO� concentration = 813 ppm In this example, the classroom has a volume of
800 142 m³ and contains 21 students of 10 years of age
750
and one teacher. With this occupancy, more than
5 air changes per hour are recommended. In the
700
ACR = 8 h-1, CO� concentration = 665 ppm adjoining graph, the indoor steady-state CO2
650 concentrations corresponding to 5 and 8 air
changes per hour are indicated (the latter value is
600
equivalent to conditions for 14 liters per person
per second).
CO� (ppm)
550
500
In this example, mechanical ventilation is activated
450
during the entire period, achieving sufficient air
400 change rate, as reflected by the CO2
concentrations. The CO2 concentrations do not
350
exceed levels corresponding to 8 air changes per
300
09:10 09:20 09:30 09:40 09:50 10:00 10:10 10:20 10:30 10:40 10:50 11:00 11:10 11:20 11:30 11:40 11:50
hour.
With without
students students When the students vacate the classroom, the CO2
concentrations rapidly decrease to background
level.
https://webmesura.org/mimoco2/
(For details on these calculations, consult the
methods at the end of Part I of this guide).
22Solution 4. Centralised mechanical ventilation
SOLUTION 4
CENTRALISED
Indoors, where centralised mechanical ventilation is available. 4 MECHANICAL
VENTILATION
• Centralised ventilation systems provide ventilation for entire buildings to facilitate the exchange of indoor air with
outdoor air. Such ventilation systems are typically used for air conditioning.
• Such systems should be configured to maximize the supply of outdoor air relative to the recirculated indoor air. The
modification of existing configurations must be carried out by trained technical personnel.
• Recirculated indoor air can be filtered by introducing a suitable filtration system or upgrading the existing one. The
filter used in the recirculation flow should have the maximum efficiency that the system is able to handle considering
the limitations on pressure drop (energy use) and other system requirements. A minimum filter efficiency >50% for
particles lower than 1 µm is recommended (EN ISO 16890; aproximatelly equivalent to F7 by the old EN779 standard).
The flow of clean air provided by this system is calculated by multiplying the flow of the recirculated air by the efficiency
of the filter in use.
Flow of clean air from recirculation with filtration = Flow of air * Filter efficiency
• The necessary flow is calculated according to the required air change rate, taking into consideration that ventilation
rates are cumulative, i.e. when natural and mechanical ventilation are combined, the total ACR is cumulative; therefore,
the ACR of natural ventilation is added to the ACR of the centralised mechanical ventilation. Nevetheless, natural
ventilation can interact with the mechanical ventilation flows and result in a different combined ventilation.
Target ACR = Total ACR = ACR (natural ventilation) + ACR (centralised mechanical ventilation)
23SOLUTION 4
CENTRALISED
MECHANICAL
• The theoretical required mechanical flow is given by: VENTILATION
Flow = ACR (centralised mechanical ventilation) * Volume of air in the classroom
• When the mechanical flow cannot be measured with this type of systems, and even if so, given that the natural ventilation
can interfere with the flows, the assessment of the total air change rate achieved must be done similarly to situations with
natural ventilation.
Centralised ventilated air fed into the classroom from the ceiling
AIR
SUPPLY
EXTRACTION
AIR
SUPPLY
AIR
SUPPLY
24SOLUTION 4
Example of centralised mechanical ventilation CENTRALISED
MECHANICAL
VENTILATION
Variation of CO2 concentrations during a school day without (red) and with (green) centralised
mechanical ventilation.
Red: windows and doors closed (April 2015).
Green: Mechanical ventilation (supply mechanical ventilation without recirculation (May 2019)).
In this example, the classroom has a volume
3.500
of 148 m³ and contains 22 students of 14
3.000
years of age and one teacher. With this
occupancy, more than 5 air changes per hour
2.500
are recommended. In the adjoining graph,
the indoor steady-state CO2 concentrations
2.000
corresponding to 5 and 8 air changes per
CO� (ppm)
hour are indicated (the latter value is
1.500 equivalent to conditions for 14 liters per
person per second).
1.000
ACR = 5 h-¹, CO� concentration = 855 ppm
ACR = 8 h-¹, CO� concentration = 692 ppm
In this example, mechanical ventilation is
500 running continuously. The theoretical air
change rate is 11 air changes per hour (based
0 on the system flow).
7:00 8:00 9:00 10:00 11:00 12:00 13:00 14:00 15:00 16:00 17:00 18:00 19:00 20:00 21:00 22:00 23:00
(For details on these calculations, consult the
methods at the end of Part I of this guide).
https://webmesura.org/mimoco2/
25Solution 5. Air cleaning SOLUTION 5
AIR
Indoors, where natural or mechanical ventilation is not available or is insufficient . CLEANING
• In this solution, an air cleaner is installed to remove particles potentially carrying viral particles from indoor air.
• An air cleaner’s effectiveness in reducing particles is defined by their Clean Air Delivery Rate (CADR), typically
expressed in m³ per hour.
• The air change rate equivalent to the air cleaner’s CADR is:
ACR(cleaning) = CADR / Volume of air in the classroom
• The total effect of ventilation and air cleaning on particle levels in the same space is:
ACR(total) = ACR(ventilation) + ACR(cleaning)
• The required air cleaning (ACRcleaning) is calculated by:
ACR(cleaning) = ACR(total) - ACR(ventilation)
• The required clean air flow, Clean Air Delivery Rate (CADR), is calculated by:
CADR= ACR(cleaning) * Volume of air in the classroom
26SOLUTION 5
AIR
• More than one air cleaner can be used to achieve the necessary airflow. CLEANING
• The air cleaner should be positioned in the centre of the classroom if possible while avoiding blowing air
directly at the room's occupants.
• Filtration is the most effective system of air cleaning. Filtration consists of passing contaminated air through a
filter, which traps particles in the air stream. HEPA (High-Efficiency Particulate Air) filters H13 (>99.95% efficiency) or
higher are recommended (EN1822 standard).
• Ionizers or ozone generators are not recommended because they can produce uncontrolled reactions with
other atmospheric components and form harmful contaminants. More information can be found in the EPA
guide on indoor air cleaners (https://www.epa.gov/indoor-air-quality-iaq/air-cleaners-and-air-filters-home)
• Filters should be changed in accordance with the manufacturers' instructions.
Note: the equations used to calculate CADR and ACR(cleaning) are provided in the excel spreadsheet in the annex.
27Example of air cleaning SOLUTION 5
AIR
Variations in the concentration of ultrafine particles in a school gymnasium occupied by students, CLEANING
with and without air cleaners with HEPA filters installed.
The SARS-CoV-2 can be carried in particles of different sizes, from ultrafine to coarse. Here the assessment of
the air cleaner efficiency is done using ultrafine particles, and this implies that the efficiency for the whole
range of sizes in which the virus can be present is equal or larger than that.
Red arrows: air cleaner
Without With
In this example, six air cleaners are
air purifier air purifier
15000 installed, each with flow rates of 660 m³
per hour, in a school gymnasium of
Ultrafine particles/cm³ volume 430 m³ (150 m2 * 2.9 m).
The total flow is 660*6 = 3960 m³/h.
10000
The equivalent air change rate provided
by the six air cleaners is given by:
5000 ACR(cleaning) = 3960/430 = 9.2 air
changes per hour.
Pacitto et al., 2020 Science of the Total Environment A substantial decrease in the
concentrations of potentially
0
contaminated ultrafine particles in the
indoor air is observed when the cleaner
is used.
28VERIFYING THE
VENTILATION
EFFICIENCY USING
CO2 SENSORS
29Verifying the ventilation efficiency using CO2 sensors
When an enclosed space is occupied by people, concentrations of exhaled CO2 in indoor air can be used as indicator of
ventilation.
There are two methods to measure ventilation, both based on the measurement of CO2 in indoor air.
These methods are intended to quantitatively determine air change rate in classrooms following the established ventilation
recommendations. With all data available the ventilation can be expressed as air change rate in air changes per hour (h-1)
or as air flow per person in litres of air per person per second.
Concentrations of CO2 in ambient outdoor air are approximately 420-480 ppm, depending to the proximity to combustion
sources.
Both methods consider the dilution effect of outdoor airflow only. If air cleaning is employed, its effect and that of
ventilation are cumulative. For example, if ventilation provides an air change rate of 4 h-1, and the air cleaner provides a
CADR equivalent to 3 h-1, the cumulative effect on removal of air pollutants is 7 h-1.
30Method 1. Determination of air change rate
This method directly measures the air change rate (ACR) in air changes per hour (ACH). This method requires the room to be
unoccupied with no additional sources of CO2. CO2 concentrations are deliberately increased in the unoccupied room, and the
rate of decrease in CO2 concentrations is measured. The rate of the decrease can be used to calculate the air change rate..
• Measure the outdoor ambient CO2 concentrations for at least five minutes before and after the experiment. The average
measured CO2 concentration represents the baseline ambient CO2 levels.
• Place the CO2 sensor in the classroom approximately one meter above the ground, and monitor the CO2 concentration
continuously.
• Increase the CO2 concentration in the classroom (with all windows and doors closed) to approximately 2000 ppm by:
- Having one or more individuals stay in the room (this can be a regular classroom session)
- Using a source of CO2 such as dry ice.
• When CO2 reaches at least around 2000 ppm:
- Remove the CO2 source (such as the dry ice, if used)
- Ensure every person vacates the classroom
- Open the windows and doors according to the configuration being tested
• Allow the CO2 concentrations in the classroom to reduce. Avoid changes to positions of doors and windows or ventilation system
settings during this period.
31• Excess CO2 is defined as:
Excess CO� = indoor CO� concentration - outdoor CO� concentration
• The test ends when the excess CO2 reaches 37% of the initial excess.
Example:
- Maximum initial indoor concentration is 2000 ppm
- Outdoor concentration is 420 ppm
- Initial excess CO2 = 2000 - 420 = 1580 ppm
- Final excess CO2 = 37% of the initial excess CO2 = 1580 * 0.37 = 585 ppm
- Final indoor concentration = 420 + 585 = 1005 ppm
• Repeat the method for different window and door opening configurations.
32Processing the data Ending of the class, or switching off CO�
source
Opening doors and windows
2500 2210 ppm
• Download or take note of the measurement data recorded by the CO2 sensor. 9:05
Every 1 minute or less should be recorded. Beginning
2000 of the class
or switiching
on the
• Identify the moment when the windows and doors are open and the CO2 CO� emission
1500
CO2 (ppm)
source Final:
concentration begins to decrease. Ignore instances where the CO2 concentration 1085 ppm
9:22
oscillates around the same value and instead choose the point when CO2 clearly
begins to reduce continuously. The green point in the adjoining graph indicates this 1000
concentration (Cstart) and the time tstart.
500
• Identify the moment when the CO2 concentration reaches the final indoor
0
concentration (as calculated previously). The red point in the adjoining graph
8:45 8:52 9:00 9:07 9:14 9:21 9:28
indicates this concentration (Cfinal) and the time tfinal.
• Calculate the average CO2 concentration in outdoor air measured with the sensor before and after the indoor tests
(Coutdoor).
• Use the following equation to calculate the air change rate (ACR), where C is the concentration in ppm and t is the time
in hours:
C f i n a l C outdoor
* ln C start Coutdoor
ACR
t f i n a l t start
• Compare the obtained air change rate with the target value and modify settings as necessary before re-testing the
ventilation conditions.
Note: these calculations can be made using the Excel spreadsheet provided in the annex of this guide.
33Method 1 Example Ending of the class, or switching off CO�
source
Opening doors and windows
• Point where CO2 concentrations begin to reduce, Cstart = 2210 ppm y tstart = 09:05 2500 2210 ppm
9:05
Beginning
• Point where CO2 concentrations stop decreasing, Cfinal= 1085 ppm y tfinal= 09:22 2000 of the class
or switiching
• Outdoor concentration, Coutdoor = 420 ppm on the
CO� emission
1500
CO2 (ppm)
source Final:
• Experiment time tfinal – tstart is 17 minutes. This is 17/60 = 0.2833 hours 1085 ppm
9:22
• Calculate ACR as 1000
1085 420
* ln 2210 420
ACR 3.5 500
0.2833
0
• Comparison of the achieved value (ACR = 3.5 h-1) with the target value. 8:45 8:52 9:00 9:07 9:14 9:21 9:28
Option 1. Take the desired ACR (target), e.g. 5 h-1
Option 2. Take as the target 14 litres per person per second and calculate the corresponding ACR. For example, 23 people in a
classroom of area 70 m² and height 2.8 m height (70 * 2.8 = 196 m³) corresponds to:
ACR = 14 litres per person per second * 23 people * 3600 seconds/hour * 0.001 m³/litre / 196 m³ = 5.9 h-1
• At an ACR (target) = 5 h-1, additional air change rate of 1.5 h-1 is required (5.0 - 3.5)
Using the 14 litres of air per person per second target, additional air change rate of 2.4 h-1 is required; 5.9 - 3.5).
The precautionary principle would imply to use the most restrictive value from the two above).
• Options:
- Modify the window and/or door configurations in order to achieve the required ACR
- Use additional mechanical ventilation to achieve the extra 1.5 h-1 needed. Required extra flow = 1.5 * 196 = 294 m³ per hour.
- If the exact flow of the mechanical ventilation cannot be determined precisely, method 1 can be repeated with a new ventilation
configuration (natural and mechanical) to determine the total achievable ACR.
- Employ an air cleaner to provide the extra 1.5 h-¹ needed. The required clean air flow from the cleaner would be
CADR = 1.5*196 = 294 m³ per hour.
34Method 2. Determine the target steady-state CO2 concentration
This method determines the target CO2 concentration in an occupied classroom under stable conditions (steady-state). The
classroom dimensions, the number of occupants, and the target air change rate must be known. The calculated steady-state
concentration is compared with measurements taken continuously in the occupied classroom under steady-state conditions,
i.e., the stabilised CO2 concentration in an occupied classroom.
• Measure the classroom dimensions: width * length * height, and calculate the volume in cubic meters.
• Measure the concentration of CO2 in outdoor air for at least five minutes before and after the experiment. Calculate the
average for both measurements, which will be used as the average outdoor CO2 concentration.
• Estimate the CO2 generated as:
CO2 generation = number of people in the room * rate of CO2 generation per person
• The rate of CO2 generation per person depends on age, sex, weight, and metabolic activity. Consult Table 1 and Table 2 to
determine the rate of CO2 generation in each case in each case. Below are some typical values:
- Seated students aged 6 - 11 years: 0.0031 litres per second = 0.186 litres per minute (lpm) per student
- Adolescents: 0.0044 litres per second = 0.264 litres per minute (lpm) per adolescent
- Adults (standing and speaking, average age between 30 to 40 years): 0.0061 litres per second = 0.366 litres per minute (lpm)
35• Calculate the target outdoor airflow:
Target outdoor airflow = ACR(target) * Volume of the classroom
• Estimate the steady-state CO2 concentration (Csteady-state) using the following formula:
C
where
Csteady-state is in ppm
CO2 generation is in lpm
Target outdoor airflow is in lpm
CO2 concentration outdoors is in ppm
10-6 is a conversion factor for units
• Measure the CO2 to evaluate if the ventilation is adequate. If the steady-state CO2 concentration in the classroom is similar
to the calculated Csteady-state, the target ventilation is established. If the measured CO2 concentration is above the Csteady-state,
the target air change rate is not being met, and the ventilation configuration will have to be revised. Given that CO2
concentrations can vary during the day, allow a reasonable 20% deviation from the target value before taking any measures.
Note: these calculations can be made using the Excel spreadsheet provided in the annex of this guide.
36Table 1: CO2 generation rates for ranges of ages and levels of physical activity, based on mean Table 2: Values of physical activity levels (M). From Persily and de Jonge,
body mass in each age group. From Persily and de Jonge, 2017. Indoor Air, doi:10.1111/ina.12383. 2017. Indoor Air, doi:10.1111/ina.12383.
37Method 2 Example: Middle school classroom
Classroom of 65 m² with 16 adolescent students and one teacher.
Classroom dimensions: width * length * height: 6.5 x 10 x 2.9 = 188.5 m³
Outdoor CO2 exterior = 420 ppm
CO2 generation = (16 * 0.264 lpm) + (1 * 0.366 lpm) = 4.59 lpm (16 students and 1 teacher)
Target air change rate, ACR = 5 h-1
(The target air change rate based on 14 litres per person per second (lps) ventilation:
ACR = 14 liters per person per second * 17 persons * 3600 seconds/hour * 0.001 m³/liter / 188.5 m³ = 4.5 h-1)
Required outdoor air flow: 5 * 188.5 = 942.5 m³/hour = 15708 lpm
C 712 ppm
Measured steady-state values above 712 ppm CO2 indicate an air change rate below the target, and thus additional
measures will need to be implemented. Given that CO2 concentrations can vary during the day, allow a reasonable 20%
deviation from the target value before taking any measures.
38Method 2 Example: Kinder garden classroom
Classroom of 50 m² with 12 children under 6 years and two caretakers.
Classroom dimensions: width * length * height: 10 x 5 x 2.9 = 145 m³
Outdoor CO2 concentration = 420 ppm
CO2 generation = 12 * 0.186 lpm + 2 * 0.366 lpm = 2.964 lpm
Target air change rate, ACR = 5 h-1
(The target air change rate based on 14 litres per person per second (lps) ventilation:
ACR = 14 liters per person per second * 14 persons * 3600 seconds/hour * 0.001 m³/liter / 145 m³ = 4.9)
Required outdoor air flow: 5 * 145 = 728 m³/hour = 12083 lpm
Measured steady-state values above 665 ppm CO2 indicate an air change rate below the target, and thus additional
measures will need to be implemented. Given that CO2 concentrations can vary during the day, allow a reasonable
20% deviation from the target value before taking any measures.
39Limitations of these methods
The air in occupied spaces cannot always be considered well mixed. For instance, the air in a classrooms' central areas may be
better mixed than the air in the corners or other peripheral areas. Tests should be carried out in different parts of the room to
identify possible stagnant zones that may require extra ventilation.
The calculations must be adjusted when filters or air cleaners are used to minimize exposure in combination with ventilation.
The equivalent ACRs provided by ventilation and air cleaning are cumulative.
CO2 sensors should be calibrated before use.
Unlike the virus, CO2 does not degrade over time. Thus, the concentration of viable viruses in the air will decrease more rapidly
than CO2 concentrations. The difference will depend on various environmental factors such as UV radiation and temperature.
The emissions of aerosols generated by people are not proportional to the emissions of CO2. For instance, speaking loudly,
shouting, or singing tends to emit many more particles and the increase with respect to breathing may be higher than the
increase in CO2 emission. Therefore, for identical CO2 conditions, the risks of infection might be different.
The measured values of ACR determined by Methods 1 and 2 on a given day will reflect the conditions of that day and can vary
depending on the outdoor meteorological conditions.
The accuracy of the results obtained by Method 1 may be affected by errors in identifying the start and end points in the CO2
concentrations curve and by the response time of the CO2 sensor.
The amount of CO2 generated by an individual varies depending on several factors, including age, sex, weight, and metabolic
activity. The estimates used may affect the results obtained by Method 2.
40Desirable characteristics of CO2 sensors
Provides data in a raw downloadable file such as .txt, .xls,.csv, or similar
A time resolution of at least one data point per minute
A screen that displays CO2 levels in real-time
Use of NDIR (non-dispersive infrared) technology
Price range between 100 and 300 euros often provides the desired measurement quality
Always follow the manufacturer's recommendations and calibration instructions.
To test that the sensor is functioning correctly, measure the outdoor CO2 concentration, which should be around 420-480
ppm. This value can be higher in dense urban areas during the day due to emissions from combustion sources. The
accuracy of the instrument used should be taken into consideration.
41PART II. INFECTION
RISK ASSESSMENT
42INFECTION RISK ASSESSMENT
The infectious risk can be assessed with a spreadsheet-tool, the Indoor Scenario Simulator, that calculates the number of
viral particles in the air of a well-mixed room for which the room volume and the air change rate can be defined. It is
available for download in many languages at https://scoeh.ch/tools. The scientific approach used in the tool is described in
an article by Riediker and Monn (2020, Aerosol Air Qual. Res., doi:10.4209/aaqr.2020.08.0531). The tool uses mathematical
modelling of the virus emission in the adult population for normal breathing, speaking softly and loudly at rest, and while
being moderately or extremely physically active. It also allows simulation of the effect of wearing different types of masks.
Thus, many different indoor scenarios can be simulated with a few mouse-clicks.
Virus emission and virus dose required for infection
How much virus does an average infected person emit?
How much a person emits depends on the viral load (viruses per milliliter of lung liquid) and how much aerosol volume that
person emits. There is a very large range of viral emissions in the general population. The average person emits almost no
virus. However, about ten percent of the infected population emits sufficient virus to pose a realistic risk, especially if they
talk loudly and for prolonged periods in small, ill-ventilated rooms. Super-emitters (about 1 in 1000 infected people) can
infect others even in very large halls. It is important to adapt the risk measures to these super-emitters.
How much virus is needed to get sick? What is the critical dose?
The dose necessary to infect humans is subject to ongoing research. For many viruses, a few hundred to a thousand plaque
forming units (PFU) are sufficient to infect a human. PFUs are not identical to the number of viral copies determined by
polymerase chain reaction (PCR) test, since several hundred “virus copies“ can be present per PFU. When aiming to prevent
infections, a “critical dose” that should not be exceeded can be defined as a few PFU, which corresponds to about 500 viral
copies determined by PCR. For high-risk persons such as elderly, sick or immune-compromised patients, it seems advisable
to define a lower critical dose of 100 or even 1 virus copy. Research on the minimal infective dose of SARS-CoV-2 is ongoing.
43Simulations of school scenarios
We used the simulator to assess different scenarios in a classroom of 100 m² of 2.8 m height hosting 25 children and 1
teacher. We also look at the relevance of age and activity by assuming that either a teacher or a child 7 to 9 years old was
the emitter. The scenarios described in Table 3 represent situations where either a child or a teacher becomes infected. The
table shows calculations for a single class. That dose has to be multiplied by the number of classes per day to obtain the
daily inhaled dose. Also, the scenarios assume there is perfect ventilation between classes and hence the virus
concentration at the start of each class is zero. If this is not the case, the virus concentration throughout the class would be
higher and so would be the risk. An (infected) teacher was assumed to talk loudly in front of the class for 30% of the class
and then in a low voice to individual children for another 30%. In contrast, an often-talking (infected) child was assumed to
talk for 10 % at low voice (discussions amongst children) and 5% loud voice (talking to entire class). Note that the risk of
contracting the virus is elevated at daily doses above 500 virus-copies.
44Table 3: Comparison of the inhaled viral dose received after 45 minutes for different classroom scenarios. This number has to be multiplied by the number of classes
per day to obtain the daily inhaled dose from exposure at school
Child is infected
Base scenario: inhaled dose after 45 minutes class Teacher is infected super-emitter = very high
“super-emitter” “adult” emitter
1) Low ventilation (180 m³/h, here ACR=0.6 h-1),
3,177 virus copies 16 virus copies
nobody wears masks
Low ventilation (180 m³/h, here ACR=0.6 h-1), all
2) wears medical masks 199 virus copies 5 virus copies
3) Better ventilation (660 m³/h, here ACR=2.4 h-1), all 143 virus copies 4 virus copies
medical masks
4) Better ventilation (1320 m³/h, here ACR=4.7 h-1), all
100 virus copies 3 virus copies
medical masks
It is important to note that the assumption of an infected child requires additional information from outside the simulator.
A recent study suggests that children emit about half as many aerosols as adults when talking normally, though similar
when talking loudly (https://www.medrxiv.org/content/10.1101/2020.09.17.20196733v1.full.pdf). Another study shows that the
maximal viral load in children is about 100 times lower than adults, while the median is in a similar range to adults
(https://www.medrxiv.org/content/10.1101/2020.09.17.20196733v1.full.pdf). We therefore assumed for these simulations that
a "child super-emitter" emits as many viruses as a "high" to "very high" emitting adult (Table 4 shows the results for "very
high"). The inhaled dose of children may be two- to three-fold over-estimated because the volume of air breathed per
minute in the model corresponds to that of adults.
45An important question is the activity of the teacher in the classroom before the start of the class. If this teacher is infected,
the children will enter the classroom, in which there has already been some viral accumulation. Table 4 shows that a teacher
working quietly with a mask leads only to a very small increase compared to the base scenario (199 inhaled virus copies by
the children when they and the teacher enter at the same time, see Table 3). The increase of this value is relatively small
even if the teacher wears no mask. However, the increase is substantial if the teacher sings/talks loud before the start of the
class.
Table 4: Scenarios comparing the impact of different activities by an infected teacher during ten-minute preparation time in a poorly ventilated classroom. During the
class, teachers were always assumed to talk loudly in front of the class for 30% of the time and then in a low voice to individual children for another 30% of time.
Teacher is infected
Advanced scenarios: Activities of teacher before start of the class “super-emitter”
inhaled dose (children)
Teacher wears a mask for 10 minutes before children enter room,
A) teacher is quiet during this preparation time 207 virus copies
Low ventilation (180 m³/h, here ACR=0.6 h-1), all wears medical masks during class
Teacher does not wear mask for 10 minutes before children enter room,
A) teacher is quiet during this preparation time 231 virus copies
Low ventilation (180 m³/h, here ACR=0.6 h-1), all wear medical masks during class
Teacher does not wear mask for 10 minutes before children enter room,
B) teacher sings loudly during this preparation time 3,281 virus copies
Low ventilation (180 m³/h, here ACR=0.6 h-1), all wear medical masks during class
46Simulations for other situations
We simulated a range of office situations, walk-in businesses such as small shops, boutiques, restaurants and discos;
transportation when travelling by train, bus, car and air; documented super-spreading event (Please read the article
“https://aaqr.org/articles/aaqr-20-08-covid-0531” for a full description of the findings).
Overall, these simulations document the positive effects of wearing masks and increasing ventilation. They also document
the contribution of viral load, speaking and physical activity. The parameter driving the risk in most scenarios is the emission
rate of the infected person; in most cases, the presence of a super-emitter (about one in 1,000 infected people) or very high
emitter (1 in 100) was required to reach a critical number of inhaled virus copies. In very small rooms with poor ventilation
(e.g. sitting in a car), a high emitter (1 in 10) was sufficient, especially if the emitter was singing or talking loudly. Wearing
simple surgical/hygiene mask was very effective in almost all cases, assuming that the masks were a good fit and properly
worn. However, masks are not always a good fit and properly worn in public spaces, which has to be considered in risk
assessments.
The comparison to documented super-spreading events suggests that these infectious events could be explained by
transmission via the airborne route (as opposed to contact transmission) and that an estimated dose of a few thousand
virus copies may be sufficient to infect a large proportion of the exposed population.
47DISCLAIMER
48DISCLAIMER
This document is provided for informational and educational purposes only. This document aims to provide guidance to
optimise ventilation in school classrooms and reduce the risk of transmission of diseases, specifically the novel
coronavirus SARS-CoV-2 and its associated disease COVID-19.
The adherence to the information outlined in this document does not guarantee total prevention of disease
transmission. Every situation and building is different, and users must accept that no scenario is entirely risk-free.
This document should not be considered an exhaustive compilation of all available and suitable methods. Other
reasonably designed methods will exist that can achieve similar results. This document is not intended to replace
guidelines issued by governments or health authorities.
The information contained in this document reflects the best available science at the time the document was compiled.
The emergence of new information and scientific evidence may necessitate future revisions of this document.
Every reasonable effort was made to ensure that the information in this document is correct and up to date. However,
the information is provided without warranty of any kind. The authors disclaim any liability and in no event shall they be
liable for any injury or damage to persons or property arising from the use or the inability to use the information
contained in this report, including damages arising from inaccuracies, errors or omissions therein.
49Guide for ventilation towards
healthy classroomsYou can also read