H1 2022 Results - Ithaca Energy
←
→
Page content transcription
If your browser does not render page correctly, please read the page content below

H1 2022 Results

August 2022
Cautionary Statement
This proprietary presentation (including any accompanying oral presentation, question and answer session and any other document or materials distributed at or in connection with this presentation) (collectively, the “Presentation”) is supplied for your information only and has been prepared by Ithaca Energy Limited
(“Ithaca” or the “Company”). This Presentation does not and is not intended to constitute a prospectus nor does it constitute or form any part of any offer or invitation to purchase, sell or subscribe for, or any solicitation of any such offer to purchase, sell or subscribe for, any securities in Ithaca in any jurisdiction nor
shall this Presentation or any part of it, or the facts of its distribution, form the basis of, or be relied on in connection with, any contract therefor. The contents of this Presentation have not been examined or approved by the Financial Conduct Authority or any authorised person for the purposes of section 21 of the
Financial Services and Markets Act 2000 as amended, nor is it intended that the Presentation will be so examined or approved. No reliance may be placed, for any purposes whatsoever, on the information contained in this Presentation. This Presentation is not, and nothing in it should be construed as, an offer,
invitation to offer or recommendation in respect of the Company’s assets, securities or credit facilities in any jurisdiction. Neither this Presentation nor anything in it shall form the basis of, or be relied on in connection with, or act as an invitation or inducement to enter into, any contract or legal obligation, express or
implied.

Forward-Looking Statements
This Presentation contains projections, information and other forward-looking statements (collectively “forward looking statements”) regarding future events and the Company’s future performance. All statements and information other than present and historical facts contained in this Presentation are forward looking.
When used in this Presentation, words and phrases like “forecast”, "anticipate", "continue", "estimate", "expect", "may", "will", "project", "plan", "should", "believe", "could", “target”, “scheduled”, “in the process of”, “on track” and similar expressions, and the negatives thereof, whether used in connection with production
forecasts, operational activities, anticipated development plans, planned maintenance shutdowns and the effects thereof, drilling campaigns and plans, budgetary figures, future operating costs, anticipated capital expenditures and capital programmes, financing activities, anticipated net debt, anticipated funding
requirements and uses of available credit under the Company’s debt facilities, anticipated extension of debt facilities, expectation for development funding or otherwise, any future valuations of the business, potential developments including the timing and anticipated benefits of acquisitions and dispositions or
otherwise, expected future payments in connection with such acquisitions and dispositions, statements relating to reserves and the expected tax horizon of the Company are intended to identify forward-looking statements. Forward-looking statements are based on the Company's current internal expectations,
estimates, projections, assumptions and beliefs, including, among other things, assumptions with respect to production, drilling, construction and maintenance times, well completion times, risks associated with operations, future capital and operating expenditures, financing activities, continued availability of financing
for future capital expenditures, future acquisitions and divestments and cash flow, required regulatory, partner and other third party approvals. The reader is cautioned that assumptions used in the preparation of such information may prove to be incorrect. Forward looking statements are not promises or guarantees,
and are subject to risks and uncertainties that could cause actual outcomes to differ materially from those suggested by any such statements and the risk that the future benefits and anticipated production by the Company may be adversely impacted. These forward-looking statements speak only as of the date of this
Presentation. In the view of the Company’s management, this Presentation was prepared by management on a reasonable basis, reflects the best currently available estimates and judgements, and presents, to the best of management’s knowledge and belief, the expected course of action and the expected future
performance and results of the Company. However, such forward-looking statements are not fact and should not be relied upon as being necessarily indicative of future results and recipients of this Presentation are cautioned not to place undue reliance on this information. Neither the Company nor any other person
has conducted any investigation into or verified the information contained in this Presentation. No representation or warranty, express or implied, is or will be given by the Company or its directors, officers, advisers or any other person as to the accuracy, completeness or fairness of this Presentation. So far as
permitted by law, no responsibility or liability whatsoever is accepted for the accuracy or sufficiency of such information or for any errors, opinions, omissions or misstatements relating to the Presentation. Ithaca expressly disclaims any obligation or undertaking to release publicly any updates or revisions to any
information or forward-looking statement contained herein to reflect any change in its expectations with regard thereto or any change in events, conditions or circumstances on which any forward-looking statement is based except as required by applicable securities laws.

Non-International Financial Reporting Standards Terms
This Presentation contains non-International Financial Reporting Standards ("IFRS") industry benchmarks and terms, such as “net debt, EBITDAX”.. Net debt includes amounts outstanding under the Company’s senior debt excluding Letters of credit less cash and cash equivalents. EBITDAX stands for Earnings
Before Interest, Depreciation, Amortisation and Exploration. These non-IFRS financial measures do not have any standardised meanings and therefore are unlikely to be comparable to similar measures presented by other companies. The Company uses these measures to help evaluate its performance. This
Presentation includes unaudited H1 2022 financial statements as well as unaudited indicative financial information which has been prepared by management. The unaudited indicative financial information was not prepared with a view towards compliance with published guidelines of the SEC, the guidelines
established by the American Institute of Certified Public Accountants for preparation and presentation of indicative financial information or IFRS. The Company’s independent auditors have not audited, reviewed, compiled or performed any procedures with respect to such unaudited indicative financial information for
the purpose of its inclusion herein and accordingly, they have not expressed an opinion or provided any form of assurance with respect thereto for the purpose of this Presentation.

Notes Regarding Oil and Gas Disclosure
This Presentation contains estimates of future net revenue from the production of oil and gas reserves and resources of the Company. These estimates do not represent fair market values of the reserves and resources. The estimates of such volumes and future net revenues for individual properties may not reflect
the same confidence level as estimates of volumes and future net revenues for all properties, due to the effects of aggregation. Possible reserves are those additional reserves that are less certain to be recovered than probable reserves. There is an equal probability that the quantities actually recovered will be
greater or less than the sum of the proved plus probable reserves. There is a 10% probability that at least the sum of the estimated proved reserves plus probable reserves plus possible reserves will be recovered. References herein to "boe" mean barrel of oil equivalent which is derived by converting gas to oil in the
ratio of 5.8 thousand cubic feet ("Mcf") of gas to one barrel ("bbl") of oil. Boe may be misleading, particularly if used in isolation. A boe conversion ratio of 5.8 Mcf:1 bbl is based on an energy conversion method primarily applicable at the burner tip and does not represent a value equivalency at the wellhead. Given the
value ratio based on the current price of crude oil as compared to natural gas is significantly different from the energy equivalency of 5.8 mcf:1 bbl, utilising a conversion ratio at 5.8 mcf:1 bbl may be misleading as an indication of value. Well test results that may be disclosed represent short-term results, which may
not necessarily be indicative of long-term well performance or ultimate hydrocarbon recovery therefrom.
Statements relating to reserves and resources are deemed to be forward-looking statements, as they involve the implied assessment, based on certain estimates and assumptions, that the reserves and resources described can be profitably produced in the future. The volume estimates set forth in this Presentation
are estimates only and the actual reserves and resources and realised revenue may be greater or less than those calculated. If a discovery is made, there is no certainty that it will be developed, or if it is developed, there is no certainty as to the timing of such development or the benefits (if any) which may flow to the
Company. The reserve and resource figures (as of 30 June 2022) are derived from a report prepared by Netherland Sewell & Associates Inc., an independent qualified reserves evaluators (currently in draft form and not signed). The reserve and resource estimates are prepared in accordance with the definitions and
guidelines set forth in the 2018 Petroleum Resource Management System (PRMS) approved by the Society of Petroleum Engineers (SPE).

Recipients of this Presentation are specifically referred to the risk factors described in the Company’s Management Discussion and Analysis of operating and financial results for the six months ended 30 June 2022 and in other documents the Company files from time to time with securities regulatory authorities.

Abbreviations Throughout This Presentation
$ represents US dollars; £ represents pounds sterling; $M represents millions of US dollars; “MMboe” represents millions of barrels of oil equivalent; “MMbbl” represents millions of barrels of oil; “kboe/d” represents thousands of barrels of oil equivalent per day; “MMscf/d” represents millions of standard cubic feet per
day.
By accepting receipt of, attending any delivery of, or electronically accessing this Presentation, you agree to be bound by the above limitations and conditions and, in particular, you represent, warrant and undertake to the Company that you will not forward the Presentation to any other person, or reproduce or publish
this Presentation, in whole or in part for any purpose and you have read and agree to comply with the contents of this notice.

     2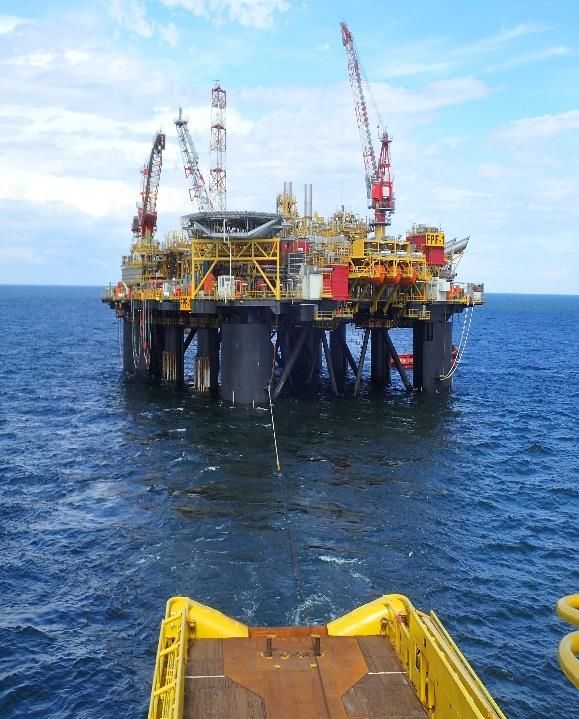
Today’s presenters

             Alan Bruce          David Crawford            Iain Lewis
                  Chief                 Chief          Incoming Chief Financial
             Executive Officer     Financial Officer             Officer
                                                          (effective 01.09.22)

3
Agenda

    1 Company Overview

    2 H1 2022 Financial Results

    3 Reserves Update & Near-Term
      Outlook

    4 Emissions Reduction

    5 Appendices
4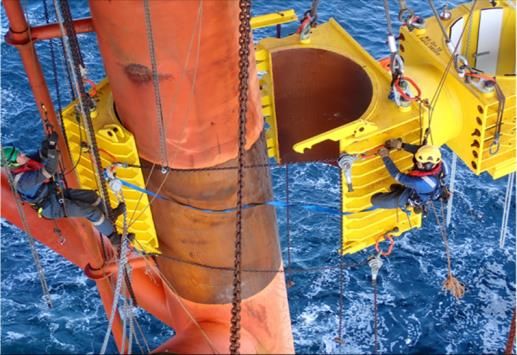
Company Overview

5
Our vision

    1   Scale and longevity     One of the largest UK independent producers with long reserves life

    2   Operating excellence    Established operator focused on safe and efficient operations

    3   Development expertise   Leading development capabilities and strong growth pipeline

    4   Decarbonisation focus   Well-defined emissions-reduction strategy

                                Material FCF generation to drive growth and maximise returns on
    5   Return oriented
                                investments

        High performing
    6   organisation            Experienced management and workforce with successful track record

                 Aim to be the highest performing UK North Sea
                 independent oil and gas company, focused on
                           sustainably growing value

6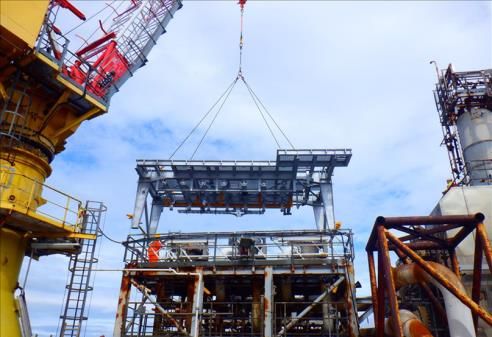
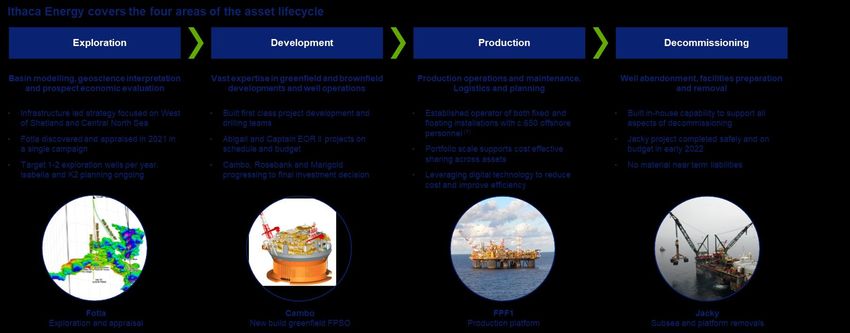
One of the only independents with deep expertise across the full
    E&P lifecycle

    Notes:
7   1. Includes c.260 Ithaca Energy employees plus contractors and contract for services staff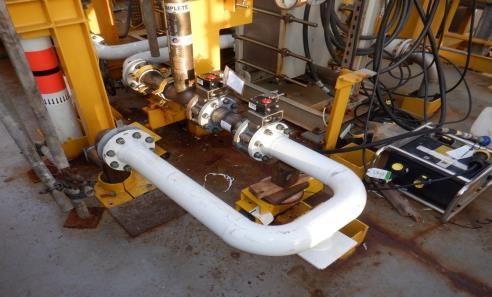
H1 2022 at a glance

    Key Operational Highlights                                                                                                                                                                       Key Financial Highlights*

    c.67 kboe/d Average Production                                                      1                                                                                                             $19/boe Average Opex                                           1

                                                                                                                                                                                                     $1,564MM LTM H1 2022 EBITDAX                                                   1

    c.63% Operated Portfolio                                                2

                                                                                                                                                                                                     $905MM H1 2022 EBITDAX                                                 1

    c.244 mmboe 2P Reserves                                                     2
                                                                                                                                                                                                       $270MM Liquidity Headroom                                                5

    c.301 mmboe 2C Resources                                                        2
                                                                                                                                                                                                       $0.9x Leverage Ratio                                        3,4

    76% Oil-weighted 2P Reserves                                                        2
                                                                                                                                                                                                        $1,415MM Net Debt                                            3,4

    Notes:
    1. For the six months to 30 June 2022 (excludes both Summit and Siccar Point acquisitions completed on 30 June 2022)                               * H1 2022 production and Profit and Loss reflects unaudited Ithaca Energy standalone (including Marubeni); Balance
8   2. Based on aggregate resources as set out in the Draft NSAI CPR as of 30th June 2022 (including Marubeni, Siccar Point and Summit acquisitions)   Sheet at 30 June 2022 reflects aggregate Ithaca Energy, Summit and Siccar Point
    3. As at 30 June 2022 (includes additional debt and cash acquired as part of the Summit and Siccar acquisitions)
    4. Excludes letters of credit (“LCs”) and Surety Bonds
    5. As at 30 June 2022 includes cash acquired as part of the Summit and Siccar acquisitions and excludes restricted cash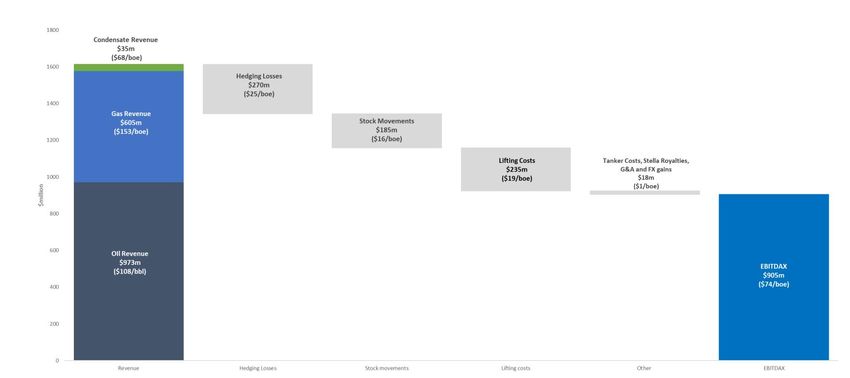
Q2 key highlights

         Siccar Point Energy and Summit E&P acquisitions
    1    completed on 30.06.2022

         Successful Installation of Pre-Assembled Units on EOR
     2   Stage 2

                                                                    Captain – New deck installation
     3   New Captain C69 (W01A) well online 17th April 2022

     4   Successful turnarounds on FPF1 and Cook

    5    Drilling campaigns on Captain and Jade in line with plan

                                                                    FPF1 – Pipework replacement

9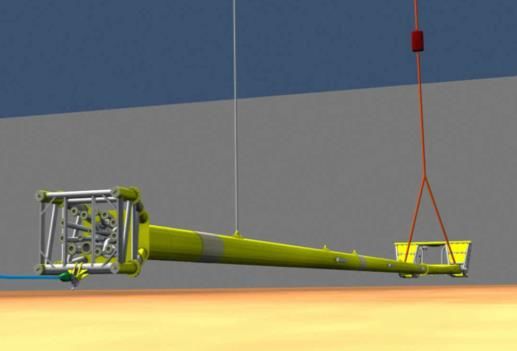
Q3 key highlights

      1   Completion of Alba turnaround

      2   Captain EORII Riser Caisson installation

                                                                     Captain EORII - Riser caisson clamp installation

      3   Abigail first oil forecast for the end of September 2022

          Captain LCS Producer, C71 (LM32P) due online in
      4   September 2022

                                                                         Captain EORII – Riser caisson schematic

10
H1 2022 Financial Results 11
H1 2022 operational and financial results1

                                  Production                                               Realised Hydrocarbon                               Unit Operating
                                   (kboe/d)                                                    Price ($/boe)2                               Expenditure ($/boe)3             EBITDAX ($/boe)

                                                                                                                          98
                                                                                                                          22
                                                   67                                                                                                                                      75
                            56
                                                                                               68                                                                            50

                                                                                               10
                                                                                                                                              18            19
                                                       19%                                                                     41%                               6%
                                                                                                                                                                                             50%

                  2021 full year 1H 2022                                             2021 full year                 1H 2022              2021 full year   1H 2022       2021 full year   1H 2022
                                                                                                  Revenue              Hedging loss

                    Production bolstered                                                       Commodity prices                          Unit operating expenditure        Commodity pricing
                    from newly acquired                                                          remain strong                             under continued focus.           driving growth in
                    MonArb and Columba                                                                                                   Increases primarily due to        EBITDAX per barrel
                   assets from 4 February                                                                                                rise in cost of fuel gas and
                                                                                                                                                    diesel

     Notes:
     1. H1 2022 Operational and Financial Results exclude Summit and Siccar Point acquisitions completed 30 June 2022
12   2. Realised price of hydrocarbons produced in period - revenue figures include movement in inventory, tanker costs and royalties;
     2. Opex figures are excluding tanker costs and are net of tariff income
12 months actual production
Net Production (kboe/d)
80
70
60
50 • Average H1 2022 production of 67 kboe/d
40 • Captain was the biggest single contributor (c.19 kboe/d
average)
30
• Q2 2022 production was lower primarily due to the
20
planned summer shutdowns at Jade and the Greater
10 Stella Area fields during June 2022
0
Q3'21 Q4'21 Q1'22 Q2'22
Captain Erskine Britannia Vorlich
Stella ElginFranklin Cook Alder
Harrier Callanish Jade Alba
Pierce Enochdhu MonArb Others
Note: H1 2022 production and Profit and Loss reflects Ithaca Energy standalone (including Marubeni)
13H1 2022 EBITDAX
Due to continued rise in
commodity prices, represents
losses on realised hedges
during1H 2022
Lifting costs $19/boe in line with
2022 Budget, excluding the Q2
acquisitions. Lifting costs forecasts
to be $18-$20/boe for the full year
2022, including Summit and Siccar
Point acquisitions for 2H 2022
Stock decreases mainly
driven by large lifted
balances on Captain,
MonArb and Britannia
Satellites
Source: Q1 2022 and Q2 2022 group accounts
14 Note: H1 2022 production and Profit and Loss reflects Ithaca Energy standalone (including Marubeni)Q2 2022 total production and income statement
Income Statement Analysis Q2 2022 Q1 2022
PRODUCTION kboed mmboe Kboed mmboe
Oil 38.8 3.5 40.4 3.7 • Production in 2Q was 7.6 kboed (11%) down on Q1 mainly due to
Gas 21.8 2.0 25.2 2.3 planned summer shutdowns at Jade and the Greater Stella Area
NGL 2.3 0.2 4.9 0.4 fields during June 2022
TOTAL PRODUCTION 62.9 5.7 70.5 6.4
• Oil prices have continued to rise through Q2 to an average of
REVENUES $/boe $m $/boe $m $116/bbl in Q2. However, the average gas prices significantly
Oil Revenue 116 475 100 498 dropped from 226p/th in Q1 to 132p/th in Q2
Gas Revenue 103 199 177 406
Condensate Revenue 70 20 65 15 • Q2 hedging losses are the net of $10m gain relating to hedges
Oil & Gas Hedging Gains / (Losses) (15) (84) (29) (186) reset in 2020 (and cash received in 2020) offset by losses of $94m
TOTAL 107 610 114 733
on Q2 2022 realised hedges
Movement in oil & gas stocks (11) (61) (19) (124)
Tanker costs - (5) - (6)
• Q2 stock decrease of 0.6mbbls, mainly driven by large lifted
Stella royalties - (3) - (3)
TOTAL VALUE FROM PRODUCTION 95 542 94 601 balances on Captain, MonArb and BritSats. Brent closing prices
COSTS increased by $10/bbl compared to Q1. Volume impact $-41m, price
Operating: Captain (19) (34) (23) (37) impact $-20m
All other assets (20) (81) (17) (83)
Total (20) (114) (19) (120) • Opex of $20/boe in Q2. Increase of $1/boe due to reduced
Routine G & A (0) (2) (1) (8) production. Overall cash cost down $6m to $114m compared to Q1
Forex (loss) / gain 1 5 (0) 0
TOTAL OPERATING CASH COSTS (19) (111) (20) (127)
EBITDAX 75 431 74 474
Source: Q1 2022 and Q2 2022 group accounts
15 Note: H1 2022 production and Profit and Loss reflects Ithaca Energy standalone (including Marubeni); Balance Sheet at 30 June 2022 reflects aggregate Ithaca Energy, Summit and Siccar PointLiquidity overview
1.5x 0.9x 0.6x 0.9x
• Prudent financial framework underpinned by low leverage,
590 high liquidity and capital discipline
620
305 • Increase in Net Debt at 30 June 2022 primarily due to RBL
78 200
drawdown of $750MM to fund the Summit and Siccar Point
acquisitions ($590m presented opposite is a net off $160m
625 625 625 625 cash)
• Material liquidity headroom of c. 270MM as at 30 June 2022
1 1 1 1, 2
Net Debt Net Debt Net Debt Net Debt
30 Sept. 2021 31 Dec. 2021 31 Mar. 2022 30 Jun. 2022 • $200m Nordic Bond acquired through Siccar Point. $166m of
the Bond was subsequently called on change of control put
Senior Notes Nordic Bond RBL (less LTM leverage option which was paid in July 2022
cash)
• $100m of RBL drawdown scheduled to be repaid by the end
RBL Facility Banks August 2022
Notes:
1. Net debt equates to drawings under the RBL plus senior notes less cash (excludes letters of credit and surety bonds)
16 2. As at 30 June 2022 (includes additional debt and cash acquired as part of the Summit and Siccar acquisitions)Oil and gas hedging overview
>44% of H2 2022 and >37% of 2023 Oil >67% of H2 2022 and >17% of 2023 Gas
Production Hedged* Production Hedged*
Period Average Volume Period Average Volume
Oil hedged
floor ($/bbl)
hedged
(mmboe)
Gas hedged floor
(p/therm)
hedged
(mmboe)
H2 2022 114 3.5
H2 2022 56 4.7
H1 2023 176 1.1
H1 2023 69 4.2
H2 2023 101 0.4
H2 2023 68 3.4 H1 2024 46 0.1
Hedging position as of 30 June 2022
17 * Based on aggregate resources as set out in the Draft NSAI CPR as of 30th June 2022 (including Marubeni, Siccar Point and Summit acquisitions)Reserves Update & Near-Term
Outlook
18Reserves and Resources update
Net 2P Reserves & 2C Resources as at 30 June 2022 (mmboe)
214
• 2P reserves addition of 46 mmboe
associated with the Summit and Siccar
(20) Point assets acquired at 30 June 2022
107
545
• A further 214 mmboe 2C resources
46
added from the Siccar Point
(8) acquisition
244
206
YE 2021 2P H1 2022 Summit & Siccar 30 June 2022 2P YE 2021 2C 2C Revisions Siccar Point 2C 30 June 2022
Production and Point 2P acquired acquired 2P+2C
Revisions
Source: Aggregate resources as set out in the Draft NSAI CPR at 30 June 2022 (including Marubeni, Siccar Point and Summit acquisitions)
19Active portfolio of projects in execution and development phase
6 highly attractive development opportunities
Rosebank Cambo Captain EOR II • Diversified portfolio of developments
The single largest undeveloped field Material development with low Leading EOR technology expected to
underpinning material growth
in the UKNS emissions double Captain production
• Access to flagship assets Cambo and
Rosebank
• Pipeline of low-cost developments
Marigold Fotla Abigail
Subsea tieback to existing Fast-track development close to Accelerated development with only
infrastructure with FID in 2023 existing infrastructure 10 months from FID to first oil
Ithaca Energy-operated
20Near term outlook
Production - kboe/d Opex - $/boe Capex - $m
~900 - 1,300 1,200.0
78-90 18-20 1,000.0
72-78 19 18-20
68 800.0
480 430-470 600.0
400.0
200.0
0.0
2022 2022 2023-25 2022 2022 2023-25 2022 Budget 2022 2023-25
Budget Guidance Guidance Budget Guidance Guidance (Ithaca + Guidance Guidance
(Ithaca + (incl. (Ithaca + (incl. Marubeni) (incl. Summit
Marubeni) Summit + Marubeni) Summit + + Siccar)
Siccar) Siccar)
• 2022 production guidance • Unit operating expenditure • Captain and Abigail driving the
increase due to M&A activity under continued focus majority of 2022 spend
(Summit and Siccar Point
• Includes impact of increase • Reduction in latest 2022 guidance due
acquisitions) and further
cost of fuel gas, diesel prices to deferral of Shaw C well into 2023
investment such as Captain
and FX
EOR II and Abigail • 2023-25 guidance includes capex
relating to 2C resources acquired from
Siccar Point
Source: Company information, Draft NSAI CPR as of 30 June 2022
21Energy Profits Levy favours companies in investment phase
Energy Profits Levy (EPL)
Objective
• Reduce cost-of-living for UK households
• Incentivise new investment in the UK upstream
Terms
• 25% incremental tax applied to pre-abex profits
• Investment allowance of 80%
• 2025 sunset clause
Implications
• 91p tax saving for every £1 investment
• Companies in investment phase will be less affected
Source: Gov.uk, company information
22Emissions Reduction 23
We aim to have one of the lowest carbon emission portfolios in the
     UK North Sea

24
We have several levers available to achieve our emissions reduction
targets
25Appendices 26
Appendix 1: Summary statement of income

     Source: 6 months to 30 June 2022 Financial Results
27   * H1 2022 production and Profit and Loss reflects Ithaca Energy standalone (including Marubeni); Balance Sheet at 30 June 2022 reflects aggregate Ithaca Energy, Summit and Siccar Point
Appendix 2: Summary balance sheet
Source: 6 months to 30 June 2022 Financial Results
28 * H1 2022 production and Profit and Loss reflects Ithaca Energy standalone (including Marubeni); Balance Sheet at 30 June 2022 reflects aggregate Ithaca Energy, Summit and Siccar PointThank you
You can also read