Q2 2021 Earnings Presentation - July 22, 2021 - Genuine Parts Company
←
→
Page content transcription
If your browser does not render page correctly, please read the page content below
Q2 2021
Earnings Presentation
July 22, 2021

Genuine Parts Company Snapshot (NYSE: GPC)
KEY STATISTICS1                                                                                                                                        GLOBAL FOOTPRINT
                                                                                                                                                      TTM Revenue by Region1
Founded                                                              1928
Headquarters                                            Atlanta, GA
Countries Served                                                         14
Locations                                                        10,538
  • Warehouses                                                         878
  • Distribution Facilities                                            189
  • Retail (Owned/Independent)                                       9,471                                                             74%                             15%
                                                                                                                                       North                          Europe
Employees                                                      ~52,000                                                                America
                                                                                                                                                                                                       11%
Market Capitalization2                                        ~$18.5B                                                                                                                                Australasia

TTM FINANCIAL HIGHLIGHTS1
Revenue                                                          $17.9B
  • Automotive                                                         67%
  • Industrial                                                         33%

Segment Profit Margin3                                               8.8%
Free Cash Flow4                                                  ~$1.6B
Dividend Yield5                                                      2.6%

                                                           Leading Global Distributor in Diversified End Markets
   1   As of 6/30/21 2 As of 7/14/21 3 See Appendix C 4 See Appendix D 5 Calculated based on annual dividend per share divided by share price as of 6/30/21                    GPC 2Q21 EARNINGS PRESENTATION |    2
Safe Harbor Statement
FORWARD-LOOKING STATEMENTS: Some of the comments made during this conference call and information contained in our presentation constitute forward-looking statements that are
subject to the safe harbor provisions of the Private Securities Litigation Reform Act of 1995. All statements in the future tense and all statements accompanied by words such as “expect,”
“likely,” “outlook,” “forecast,” “preliminary,” “would,” “could,” “should,”, “position”, “will,” “project,” “intend,” “plan,” “on track,” “anticipate,” “to come,” “may,” “possible,” “assume,” or similar
expressions are intended to identify such forward-looking statements. These forward-looking statements include the Company’s view of business and economic trends for the remainder of the
year, the Company’s ability to execute our strategic priorities and capitalize in light of these business and economic trends, and the updated full-year 2021 financial guidance for the Company.
The Company cautions that all forward-looking statements involve risks and uncertainties, and while we believe that our expectations for the future are reasonable in view of currently available
information, you are cautioned not to place undue reliance on our forward-looking statements. Actual results or events may differ materially from those indicated as a result of various important
factors. Such factors may include, among other things, the extent and duration of the disruption to our business operations caused by the global health crisis associated with the COVID-19
pandemic, including the effects on the financial health of our business partners and customers, on supply chains and our suppliers, on vehicle miles driven as well as other metrics that affect
our business, and on access to capital and liquidity provided by the financial and capital markets; the Company’s ability to maintain compliance with its debt covenants; the Company's ability to
successfully integrate acquired businesses into the Company’s operations and to realize the anticipated synergies and benefits; the Company's ability to successfully implement its business
initiatives in its two business segments; changes in demand for the Company's products; the ability to maintain favorable supplier arrangements and relationships; disruptions in global supply
chains and in our suppliers' operations, including as a result of the impact of COVID-19 on our suppliers and our supply chain; changes in national and international legislation or government
regulations or policies, including changes to import tariffs, environmental and social policy, infrastructure programs and privacy legislation, and their impact to the Company and its suppliers
and customers; changes in general economic conditions, including unemployment, inflation (including the impact of tariffs) or deflation and the United Kingdom's exit from the European Union
and the unpredictability of the impact following such exit; changes in tax policies; volatile exchange rates; volatility in oil prices; significant cost increases, such as rising fuel and freight
expenses; the Company's ability to successfully attract and retain employees in the current labor market; uncertain credit markets and other macroeconomic conditions; competitive product,
service and pricing pressures; failure or weakness in our disclosure controls and procedures and internal controls over financial reporting, including as a result of the work from home
environment; the uncertainties and costs of litigation; disruptions caused by a failure or breach of the Company's information systems, and the other risks and uncertainties discussed in the
Company’s latest SEC filings. The statements speak only as of the date they are made, and the Company undertakes no duty to update any forward-looking statements made during this
presentation or in these materials except as required by law. Actual results may vary materially and, as such, you are cautioned not to place undue reliance on these forward-looking
statements.

NON-GAAP MEASURES: This presentation contains adjusted net income from continuing operations, adjusted diluted earnings per share from continuing operations, adjusted EBIT and
adjusted EBITDA from continuing operations, adjusted gross profit, adjusted operating expenses, adjusted tax rate, segment profit margin and free cash flow, which are financial measures that
are not derived in accordance with United States generally accepted accounting principles ("GAAP"). The Company considers these non-GAAP measures useful to investors because they
provide greater transparency into management’s view and assessment of the Company’s core operating performance. These measures are widely used by analysts, investors and competitors
in our industry, although our calculation of the measure may not be comparable to similar measures disclosed by other companies, because not all companies and analysts calculate these
measures in the same manner. The Company does not, nor does it suggest investors should, consider non-GAAP financial measures superior to, in isolation from, or as a substitute for, GAAP
financial information. The Company has included reconciliations of this additional information to the most comparable GAAP measure in the appendix of this presentation.

                                                                                                                                                                      GPC 2Q21 EARNINGS PRESENTATION |       3
Q2 Highlights

       Paul Donahue
       Chairman & CEO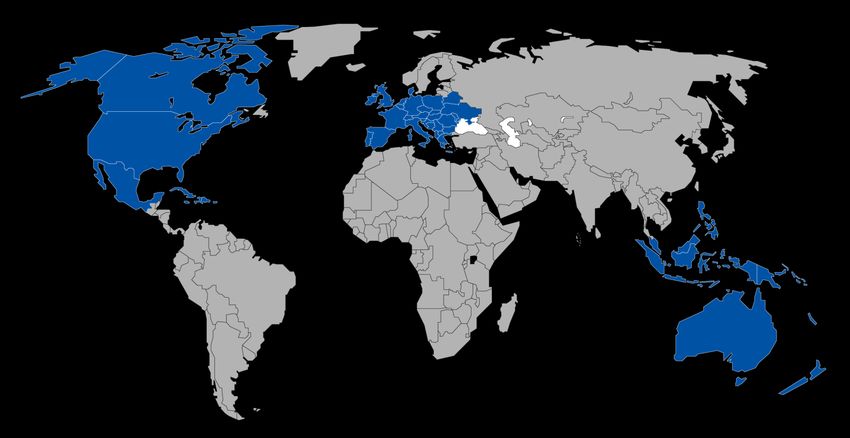
Key Messages

     Strong financial performance driven by consistent execution of strategic priorities
01   and global market recovery

02   Continued strong sales trends that drove market share gains

     Gross margin gains and improved operational efficiencies that drove margin
03   expansion and record quarterly earnings

04   Effective deployment of capital:
         ✓ Growth and productivity investments
         ✓ Bolt-on acquisitions
         ✓ Dividend
         ✓ Share repurchases

       Well Positioned to Deliver Strong Results, Gain Market Share and Create Value
                                                                              GPC 2Q21 EARNINGS PRESENTATION |   5
2Q21 Performance Highlights1
                                     • $4.8B Total Sales, +25.1%
                                           ✓ Monthly daily sales2 trends strengthened in May/June from April
                                           ✓ Automotive recovery driven by re-opening of economies, improving miles driven and strong DIFM sales growth

  Financial                                ✓ Industrial recovery driven by strengthening economy, re-opening of plants and new capital spending
   Update                            • Segment Margin Expansion of 65 bps
                                           ✓ Driven by gross margin improvement and expense leverage
                                     • Net Income of $196M; $1.36 Diluted EPS
                                     • Adjusted Net Income3 of $253M; $1.74 Adjusted Diluted EPS3, +32% and a New Record
                                     • Strong Balance Sheet and Cash Flow Available for Effective Capital Allocation
                                           ✓ Re-investment in businesses, dividend payments, share repurchases and M&A
                                     • $987M in Cash; $2.5B in Liquidity
Balance Sheet                        • Effective Management of Key Working Capital Accounts – A/R, Inventory and A/P
     and                                   ✓ Continued improvement in cash conversion cycle
 Cash Flow                           • Improving Debt Position, with Total Debt to TTM Adjusted EBITDA3 at 1.6x Compared to 2.9x on June 30,
                                       2020
                                     • Strong Cash from Operations
                                           ✓ Driven by increase in net income and working capital improvement

                                                            Strong Financial Performance and Financial Capacity
   1 For   Continuing Operations Only; See Appendix A for Sales and EPS bridge; 2 See Appendix B for definition; 3 Refer to Reconciliation of Non-GAAP measures   GPC 2Q21 EARNINGS PRESENTATION |   6
Automotive: Highlights, Trends and Initiatives
                         Automotive – Total sales +28%
                         Comp Sales1 +21%; 2-Year Stack +8.5%; Segment Profit Margin +30 bps

     MACRO                                           NORTH AMERICA                                  EUROPE                                        AUSTRALASIA
• Tailwinds:                                       • U.S. Comp Sales1 +20%                      • Comp Sales1 +34%                             • Comp Sales1 +17%
     − Broad economic recovery and strong            − +6% 2-Year Stack                             − +18% 2-Year Stack                           − +19% 2-Year Stack
       consumer health
                                                   • Positive DIFM and DIY sales, with DIFM     • Strengthening sales environment              • Strong DIFM and DIY sales growth
     − Favorable weather trends                      outperforming DIY                            associated with economic recovery
                                                                                                                                                  − DIFM > DIY
     − Inflation – strategic pricing               • DIFM sales driven by Major Accounts and        − Outperformance in UK and Benelux
                                                                                                                                               • Maximizing sales opportunities through
     − Improving aftermarket fundamentals            NAPA AutoCare customers
                                                                                                • Solid growth across operations                 short-term lockdowns
• Headwinds:                                         − Strong double-digit growth at all DIFM
                                                                                                    − Focus on key account development         • Accelerated digital strategy across B2B
                                                       customer segments
     − COVID-19 uncertainties                                                                                                                    and B2C
                                                                                                    − Leading inventory availability
     − Global supply chain constraints             • Investments in new store groups
                                                                                                                                               • Addition of Rare Spares and PARts
                                                                                                    − Excellent customer service
     − Impact of inflation on costs                • Retail on-line sales growth +70% YOY
                                                                                                                                               • Expansion of NAPA store strategy across
                                                                                                • Ongoing benefit of NAPA roll-out across
• Strong long-term industry fundamentals             − New record sales volume                                                                   Asia Pac
                                                                                                  markets – 17 product lines available today
     − Growing and older car parc                  • Canada comp sales1 +12%                                                                      − 50+ NAPA stores on June 30, 2021
                                                                                                • Investment in on-line leader, Winparts
     − Positive miles driven trends; outlook for
       further improvement

                                                                       STRATEGIC INITIATIVES IN AUTOMOTIVE
 •      Sales team effectiveness – more sales reps focused on end-user customer                 •     Omni-channel investments – B2B and B2C – new catalog and search capabilities
 •      Commercial sales programs and promotions – NAPA AutoCare                                •     Strategic pricing services and tools to maximize competitiveness
 •      Improving inventory availability to ensure more parts for more cars                     •     Value-add services and roll-out of NAPA brand in Europe and Australasia
 •      Strengthen supply chain through supplier relationships and network optimization         •     Investments to expand our global store footprint across geographies

          1   See Appendix B for definition                                                                                                            GPC 2Q21 EARNINGS PRESENTATION |   7
Industrial: Highlights, Trends and Initiatives
                        Industrial – Total sales +20%
                        Comp Sales1 +16%; 2-Year Stack Flat; Segment Profit Margin +130 bps

  MACRO                                                                NORTH AMERICA                                                      AUSTRALASIA
• Continued improvement in Industrial sales trends                  • Strengthening industrial economy and growth                      • Strong sales growth and excellent operating results
                                                                      initiatives driving improved sales trends
• Ongoing strengthening of industrial economy                                                                                          • Steady recovery to pre-pandemic sales levels
                                                                    • Fourth consecutive quarter of sequential sales
• Strong growth outlook for plant automation and
                                                                      improvement
  robotics solutions
                                                                       − Better sales trends among virtually all product categories
• Following manufacturing PMI and industrial production as
                                                                         and industries served
  industrial demand indicators – both showing improving
  trends                                                            • Continuing expansion of value-add businesses
  − PMI consistently strong > 60%                                      − Focus areas: Automation, Conveyance and Repairs
  − Industrial production +5.5% in 2Q                               • Customers operating at higher run rates and releasing
                                                                      capital project orders
• Projecting positive comp sales over balance of 2021

                                                                          STRATEGIC INITIATIVES IN INDUSTRIAL

    •       Omni-channel buildout to accelerate e-commerce growth                                                                IMPROVING COMP SALES1 TRENDS               16%
    •       Expand industrial services and solutions capabilities                                                  2%
                                                                                                                                                                                             7%
    •       Considering strategic M&A to further boost products/services offering
                                                                                                                              -3%                                   -2%
    •       Strategically enhanced pricing and product category management                                                                                 -4%
                                                                                                                                                 -9%
    •       Network optimization and automation to further improve productivity                                                          -17%
                                                                                                                2019      1Q20        2Q20    3Q20   4Q20         1Q21      2Q21     2021E

        1   See Appendix B for definition                                                                                                                        GPC 2Q21 EARNINGS PRESENTATION |   8
Strategic Initiative
Update

        Will Stengel
        President
Investing in Our Core Business

          Talent                 Sales Effectiveness                    Digital                   Supply Chain                Emerging Technology

• Recognize high potential   • Utilize data and analytics    • Deliver a best-in-class     • Ensure we have the            • Aspire to lead in
  talent, infuse new           to understand our unique        customer experience and       “right” product available       emerging technologies,
  capabilities into the        customer segments and           profitable growth while       in the “right” market at        leveraging our unique
  organization and recruit     drive increasing mix of         investing in foundational     the “right” time through        positioning, global scale
  diverse talent               traditional selling and         digital elements              continuous improvements         and One GPC team
                               digital strategies                                            in inventory, facility          approach
                                                                                             productivity, logistics and
                                                                                             technology

    ✓ Strategic bolt-on acquisitions remain a               ✓ Acquisition pipeline remains             ✓ Continue to refine our processes to move
      key part of our GPC growth strategy                     active and actionable                      faster, be disciplined and create value

                                                                                                                           GPC 2Q21 EARNINGS PRESENTATION | 10
Strategic Priorities: Q2 Select Highlights
• Focused on talent investments:
✓ Naveen Krishna, EVP and Chief Information & Digital Officer
✓ Category management; field sales and services; indirect
sourcing; pricing; diversity, equity and inclusion; digital; data;
and inventory leadership
• Strategic initiatives and winning team
performance in Europe:
✓ Increased productivity at best-in-class distribution facility
in the Netherlands
✓ Consolidated back office shared service centers in France
✓ Power and differentiation of the NAPA brand in the local market
• Executed well on acquisition strategy:
✓ Various store acquisitions by North American and European
automotive teams
✓ Winparts, on-line leader of automotive parts and accessories,
accelerating European digital vision
✓ Rare Spares, market leader in the niche segment of automotive
restoration parts and accessories
✓ PARts, leading cloud-based product and supplier data platform
GPC 2Q21 EARNINGS PRESENTATION | 11Financial Performance
Carol Yancey
EVP & CFO2Q21 Financial Results
($M, except per share data)
Sales Adj. Gross Profit1 Adj. Op/Non-Op Expenses1 Segment Profit1 Adj. EPS1
+25.1% +29.6% +27.5% +34.6% 20.0%
+31.8%
19.0%
$1,900 40.0%
$4,784 $1,689 70.0%
69.0%
68.0%
$500
$441
18.0%
$1,342
67.0%
$1.74
66.0%
65.0% 17.0%
$1,700 39.0%
64.0%
$1,400 63.0%
62.0%
61.0% 16.0%
60.0%
59.0%
58.0%
57.0% 15.0%
$3,823
$1,500 38.0%
56.0% $400
55.0%
$1,303
$1,200 54.0%
$1,300 37.0%
$1,052 53.0%
52.0%
51.0%
50.0%
49.0% $328
14.0%
13.0%
48.0%
47.0%
46.0%
$1,000 45.0%
12.0%
44.0%
43.0%
$1.32
42.0% $300
+120 bps
$1,100 36.0%
41.0%
40.0%
39.0%
8.6% +65 bps 9.2% 11.0%
28.1%
38.0%
37.0%
10.0%
27.5% +60 bps
$800 36.0%
35.0%
34.0%
33.0%
9.0%
$900 35.0% 32.0%
31.0%
30.0%
35.3%
29.0%
8.0%
28.0% $200
$600 27.0%
26.0%
25.0%
$700 34.0% 7.0%
24.0%
23.0%
22.0%
34.1%
21.0%
6.0%
20.0%
19.0%
$400 18.0%
17.0%
$500 33.0% 5.0%
16.0%
15.0%
14.0% $100
13.0%
12.0% 4.0%
11.0%
10.0%
$200 9.0%
$300 32.0% 8.0% 3.0%
7.0%
6.0%
5.0%
4.0% 2.0%
3.0%
2.0%
1.0%
$100 31.0% $0 0.0% $0 1.0%
2Q20 2Q21 2Q20 2Q21 2Q20 2Q21 2Q20 2Q21 2Q20 2Q21
• +19.5% comp sales2 • 15 consecutive quarterly • Operating in-line with plans for • Strong margin expansion in both • 4th consecutive quarter of
increases in Gross Margin the year Automotive and Industrial double-digit adj. EPS growth
− Business and economic recovery
across business segments and • Driven by benefits of: • Significant temporary savings in Q2 • Strong core sales growth a tailwind • Reported earnings per diluted share
regions 2020 for expense leverage
− Supplier incentives/rebates − $1.36 in 2Q21
• +1.5% acquisitions • Increase in variable costs related to • Gross margin expansion
− Sales mix − ($2.52) in 2Q20
• +5.0% foreign currency $1B sales growth
− Product mix • Ongoing expense management and • Adj. tax rate1 increased to 27.2%
• Passing on rising product costs in − Strategic category mgmt. • Rising cost pressures operational efficiencies, despite compared to a rate of 24.1% in 2Q20
sales initiatives comparison to prior year temporary
− Wages/incentive comp − Rate increases in UK
saving
− Pricing initiatives − Freight; rents; health insurance
− Global sourcing • Investments in productivity projects
• Tailwinds
− Greater automation/efficiencies
Note: All comparisons are YoY unless otherwise stated 1 Adjusted gross profit, adjusted op / non-op expenses, adjusted EPS and adjusted tax rate exclude certain items that the Company believes are
not representative of our continuing operations and impact comparability. These amounts are non-GAAP measures (See Reconciliation of Non-GAAP Measures) 2 See Appendix B for definition GPC 2Q21 EARNINGS PRESENTATION | 132Q21 Segment Performance
($M)
Automotive Industrial
Sales Segment Profit1 Sales Segment Profit1
+28.1% +32.8% +19.6% +38.1%
$180 20.0%
$350 20.0%
$1,587
$3,196 $300
$291 18.0%
$160
$150
18.0%
16.0%
16.0%
$1,327 $140
$2,496 $219
$250
14.0% 14.0%
$120
$109
12.0% 12.0%
$200
9.1%
$100
9.5%
8.8% +30 bps 10.0%
8.2% +130 bps 10.0%
$80
$150
8.0% 8.0%
$60
6.0% 6.0%
$100
$40
4.0% 4.0%
$50
$20
2.0% 2.0%
$0 0.0% $0 0.0%
2Q20 2Q21 2Q20 2Q21 2Q20 2Q21 2Q20 2Q21
Automotive Highlights Industrial Highlights
• Total sales +28%; +15% from 2019 • Total sales +20%; +7% from 2019
• Positive DIFM and DIY growth, with DIFM outperforming DIY • Includes benefit of three strategic bolt-on acquisitions closed in 3Q20
• Sales improvement a function of economic recovery and growth initiatives − Strengthens position in automation and hydraulics
• Strong double-digit comp sales2 across all operations • Strong 16.4% comp sales2 growth
• Strong core growth and operating performance • Strong operating results
− Improved profit margin in both markets/regions for the 3rd consecutive quarter
Note: All comparisons are YoY unless otherwise stated. 1These amounts are non-GAAP measures (See Reconciliation of Non-GAAP Measures). 2 See Appendix B for definition. GPC 2Q21 EARNINGS PRESENTATION | 14Strong Balance Sheet and Robust Cash Generation
BALANCE SHEET HIGHLIGHTS1 ($B) LIQUIDITY PROFILE1 ($B) DEBT MATURITY SCHEDULE1 ($M)
Cash / Cash Equivalents $1.0 Total Credit Capacity3 $4.0 2.35% 2Q21 Average Interest Rate $854
Accounts Receivable $1.9 Less Total Debt: ($2.5)
Inventory $3.7
Unused Credit Capacity $1.5 $382 $364 $417
Total Assets $14.1 $247
Cash $1.0 $208
Accounts Payable $4.7 $49
Total Available Liquidity $2.5
Total Debt $2.5 2021 2022 2023 2024 2025 2026 2027 2028 2029 2030+
Total Liabilities $10.8 Total debt to adj EBITDA
1.6x
(TTM)4
Working Capital2 $1.2 CASH FLOW FROM OPERATIONS ($M)
Drivers:
$2,015 • Earnings
• Working Capital
• Continued strong cash flow to support growth initiatives and effective • Sale of receivables
$1,300 • Cost Savings
allocation of capital $1,057
$833 $921
• Steady debt position and favorable financial arrangements $704
• Total debt to TTM adjusted EBITDA4 improved to 1.6x as of June 30,
2021 from 2.9x in the prior year 2018 2019 2020 2021E Q2 2020 Q2 2021
1As of 6/30/2021 2 Working capital is defined as current assets less current liabilities 3 Total credit capacity represents total committed capacity under the revolving credit facility plus the amount of all
other debt outstanding 4 These amounts are Non-GAAP measures (See Reconciliation of Non-GAAP Measures ) GPC 2Q21 EARNINGS PRESENTATION | 15Disciplined Capital Allocation
YTD 2021 Capital Deployment Current Priorities
Reinvestment
16% • $90M CapEx YTD; Projecting 2021 CapEx of ~$300M
31%
M&A
• $97M spend YTD; Targeting additional acquisitions
~$600M1
Share Repurchases
38% • $184M spend YTD; 1.4M shares repurchased and plans for continued share
15% buy-backs
Dividend
• 2021 cash dividend of $3.26 per share, +3% from 2020
• 65th consecutive year of increased dividends paid to our shareholders
M&A Dividend Reinvestment Share Repurchases • $232M spend YTD
Strong Cash Flow for Effective Capital Allocation
1 Includes proceeds from divestitures. GPC 2Q21 EARNINGS PRESENTATION | 162021 Outlook1
Current Previous
Total Sales Growth 10% to 12% 5% to 7%
• Automotive 11% to 13% 5% to 7%
• Industrial 6% to 8% 4% to 6%
Diluted EPS $5.81 to $5.96 $5.85 to $6.05
Adjusted EPS $6.20 to $6.35 $5.85 to $6.05
Adjusted EPS Growth 18% to 20% 11% to 15%
Cash from Operations $1.2B to $1.4B $1.0B to $1.2B
Free Cash Flow2 $900M to $1.1B $700M to $900M
• Corporate expenses ~$160M to $170M
• Capex ~$300M
ASSUMPTIONS • Depreciation and amortization $280M to $290M
• Interest expense $68M to $70M
• Tax rate ~25%
Strong Outlook with Strategic Growth Plans
1 Ourguidance considers several factors, including the continued uncertainty related to the COVID-19 pandemic and its potential impact on our results. We will update full-year guidance during
2021, as appropriate. 2 These amounts are non-GAAP measures (See Reconciliation of Non-GAAP Measures) GPC 2Q21 EARNINGS PRESENTATION | 17Optimistic for Strong Results in Quarters Ahead
Progress in capturing profitable growth, generating strong cash flow and driving
shareholder value
Encouraged by continued recovery of the Automotive and Industrial business markets
Exceptional balance sheet providing financial flexibility to pursue strategic growth
opportunities
Focused on executing growth strategy and operational initiatives to further enhance
financial performance
Thank you to our teammates for their continued dedication and commitment to being the
best in serving our stakeholders
Well-Positioned to Drive Profitable Growth, Cash Flow and Shareholder Value
GPC 2Q21 EARNINGS PRESENTATION | 18Q&A
Appendix
Consolidated Net Sales and Adj. Diluted EPS Bridge             Appendix A

          Net Sales ($M)              Adj. Diluted Earnings Per Share

                                                           GPC 2Q21 EARNINGS PRESENTATION | 21
Other Information Appendix B
Comparable Sales: Comparable sales or “comp sales” refer to period-over-period comparisons of our sales excluding the
impact of acquisitions, divestitures and foreign currency. The Company considers this metric useful to investors because it
provides greater transparency into management’s view and assessment of the Company’s core ongoing operations. This
metric is widely used by analysts, investors and competitors in our industry, although our calculation of the metric may not be
comparable to similar measures disclosed by other companies, because not all companies and analysts calculate this metric
in the same manner.
Daily Sales: Daily sales represents the amounts invoiced to the Company's customers each day. Daily sales do not
represent GAAP-based sales because, among other things, invoices are not always generated at the same time goods and
services are delivered to customers and the amounts do not include adjustments for estimates of returns, rebates or other
forms of variable consideration. Management uses this metric to monitor demand trends at each of its subsidiaries
throughout each month for the purposes of monitoring performance against forecasts and to make operational decisions. The
Company considers this metric useful to investors because it provides greater transparency into management’s view and
assessment of the Company’s core ongoing operations. The calculation of this metric may not be comparable to similar
measures disclosed by other companies, because not all companies and analysts calculate this metric in the same manner.
GPC 2Q21 EARNINGS PRESENTATION | 22Segment Data Appendix C
2021 2021 2020
(in thousands) TTM Q2 Q1 Q2 Q1 Q2 Q3 Q4
Net sales:
Automotive $ 11,931,675 $ 2,953,165 $ 3,196,299 $ 2,582,685 $ 2,495,799 $ 2,960,379 $ 2,821,832
Industrial 5,938,457 1,511,549 1,587,439 1,509,841 1,327,428 1,409,707 1,429,762
Total net sales 17,870,132 4,464,714 4,783,738 4,092,526 3,823,227 4,370,086 4,251,594
Segment profit:
Automotive 1,032,695 235,678 290,758 142,578 218,906 266,124 240,135
Industrial 534,698 125,292 150,413 113,933 108,928 125,620 133,373
Total segment profit 1,567,393 360,970 441,171 256,511 327,834 391,744 373,508
Interest expense, net (79,990) (18,324) (15,362) (19,868) (24,876) (25,221) (21,083)
Intangible asset amortization (101,894) (25,544) (27,384) (22,740) (23,256) (24,223) (24,743)
Corporate expense (148,720) (31,243) (51,397) (55,061) (28,613) (33,379) (32,701)
Other unallocated costs (158,112) — (77,421) 1,751 (555,525) (11,256) (69,435)
Income (Loss) before income taxes from continuing operations 1,078,677 285,859 269,607 160,593 (304,436) 297,665 225,546
Income taxes from continuing operations (259,921) (68,149) (73,111) (38,247) (59,065) (64,747) (53,914)
Net income from continuing operations $ 818,756 $ 217,710 $ 196,496 $ 122,346 $ (363,501) $ 232,918 $ 171,632
Segment profit margin:
Automotive 8.7% 8.0% 9.1% 5.5% 8.8% 9.0% 8.5%
Industrial 9.0% 8.3% 9.5% 7.5% 8.2% 8.9% 9.3%
Total segment profit margin 8.8% 8.1% 9.2% 6.3% 8.6% 9.0% 8.8%
GPC 2Q21 EARNINGS PRESENTATION | 23Explanation of Adjustments Appendix D
(1) Product liability damages award: Adjustment reflects damages reinstated by the Washington Supreme Court order on July 8, 2021 in
connection with a 2017 automotive product liability claim.
(2) Goodwill Impairment Charge: Adjustment reflects a second quarter goodwill impairment charge related to our European reporting unit.
(3) Restructuring Costs: Adjustment reflects restructuring costs related to the execution of the 2019 Cost Savings Plan announced in the
fourth quarter of 2019. The costs are primarily associated with severance and other employee costs, including a voluntary retirement
program, and facility and closure costs related to the consolidation of operations.
(4) Realized Currency Loss: Adjustment reflects realized currency losses related to divestitures.
(5) Gain on Insurance Proceeds Related to SPR Fire: Adjustment reflects insurance recoveries in excess of losses incurred on inventory,
property, plant and equipment and other fire-related costs related to the S.P. Richards Headquarters and Distribution Center.
(6) Inventory Adjustment: Adjustment reflects a $40 million charge to cost of goods sold due to the correction of an immaterial error related
to the accounting in prior years for consideration received from vendors.
(7) Transaction and Other Costs: Adjustment includes incremental costs associated with COVID-19, a loss on investment, and costs
associated with certain divestitures. COVID-19 related costs include incremental costs incurred relating to fees to cancel marketing events
and increased cleaning and sanitization materials, among other things.
GPC 2Q21 EARNINGS PRESENTATION | 24Reconciliation of Non-GAAP Financial Measures Appendix D
Adjusted Net Income from Continuing Operations
2021 2021 2020
(in thousands) TTM Q2 Q1 Q2 Q1 Q2 Q3 Q4
GAAP net income (loss) from continuing operations 818,756 217,710 196,496 122,346 (363,501) 232,918 171,632
Adjustments:
Product liability damages award (1) 77,421 — 77,421 — — — —
Goodwill impairment charge (2) — — — — 506,721 — —
Restructuring costs (3) 21,978 — — 2,982 25,059 10,968 11,010
Realized currency loss on divestitures (4) — — — — 11,356 — —
Gain on insurance proceeds related to SPR Fire (5) — — — (12,282) (1,166) — —
Inventory adjustment (6) 40,000 — — — — — 40,000
Transaction and other costs (7) 18,713 — — 7,549 13,555 288 18,425
Total adjustments 158,112 — 77,421 (1,751) 555,525 11,256 69,435
Tax impact of adjustments (48,834) — (21,322) (3,810) (1,500) (7,423) (20,089)
Adjusted net income from continuing operations 928,034 217,710 252,595 116,785 190,524 236,751 220,978
2021 2021 2020
(in thousands, except per share and per share data) TTM Q2 Q1 Q2 Q1 Q2 Q3 Q4
Diluted net income (loss) from continuing operations per common share $ 5.65 $ 1.50 $ 1.36 $ 0.84 $ (2.52) $ 1.61 $ 1.18
Adjustments:
Product liability damages award (1) 0.53 — 0.53 — — — —
Goodwill impairment charge (2) — — — — 3.51 — —
Restructuring costs (3) 0.15 — — 0.02 0.17 0.07 0.08
Realized currency loss on divestitures (4) — — — — 0.08 — —
Gain on insurance proceeds related to SPR Fire (5) — — — (0.08) (0.01) — —
Inventory adjustment (6) 0.28 — — — — — 0.28
Transaction and other costs (7) 0.13 — — 0.05 0.10 — 0.12
Total adjustments 1.09 — 0.53 (0.01) 3.85 0.07 0.48
Tax impact of adjustments (0.33) — (0.15) (0.03) (0.01) (0.05) (0.14)
Adjusted net income from continuing operations 6.40 1.50 1.74 $ 0.80 $ 1.32 $ 1.63 $ 1.52
Weighted average common shares outstanding — assuming dilution 144,983 145,300 144,983 145,623 144,262 145,035 145,160
GPC 2Q21 EARNINGS PRESENTATION | 25Reconciliation of Non-GAAP Financial Measures (Cont.) Appendix D
Adjusted EBIT and Adjusted EBITDA
2021 2021 2020
(in thousands) TTM Q2 Q1 Q2 Q1 Q2 Q3 Q4
GAAP net income (loss) from continuing operations $ 818,756 $ 217,710 $ 196,496 $ 122,346 $ (363,501) $ 232,918 $ 171,632
interest expense, net 79,990 18,324 15,362 19,868 24,876 25,221 21,083
Income taxes from continuing operations 259,921 68,149 73,111 38,247 59,065 64,747 53,914
EBIT 1,158,667 304,183 284,969 180,461 (279,560) 322,886 246,629
Product liability damages award (1) 77,421 — 77,421 — — — —
Goodwill impairment charge (2) — — — — 506,721 — —
Restructuring costs (3) 21,978 — — 2,982 25,059 10,968 11,010
Realized currency loss on divestitures (4) — — — — 11,356 — —
Gain on insurance proceeds related to SPR Fire (5) — — — (12,282) (1,166) — —
Inventory adjustment (6) 40,000 — — — — — 40,000
Transaction and other costs (7) 18,713 — — 7,549 13,555 288 18,425
Adjusted EBIT 1,316,779 304,183 362,390 178,710 275,965 334,142 316,064
2021 2021 2020
(in thousands) TTM Q2 Q1 Q2 Q1 Q2 Q3 Q4
GAAP net income (loss) from continuing operations $ 818,756 $ 217,710 $ 196,496 $ 122,346 $ (363,501) $ 232,918 $ 171,632
Depreciation and amortization 285,111 72,296 73,960 67,254 66,733 69,097 69,758
interest expense, net 79,990 18,324 15,362 19,868 24,876 25,221 21,083
Income taxes from continuing operations 259,921 68,149 73,111 38,247 59,065 64,747 53,914
EBITDA 1,443,778 376,479 358,929 247,715 (212,827) 391,983 316,387
Product liability damages award (1) 77,421 — 77,421 — — — —
Goodwill impairment charge (2) — — — — 506,721 — —
Restructuring costs (3) 21,978 — — 2,982 25,059 10,968 11,010
Realized currency loss on divestitures (4) — — — — 11,356 — —
Gain on insurance proceeds related to SPR Fire (5) — — — (12,282) (1,166) — —
Inventory adjustment (6) 40,000 — — — — — 40,000
Transaction and other costs (7) 18,713 — — 7,549 13,555 288 18,425
Adjusted EBITDA $ 1,601,890 $ 376,479 $ 436,350 $ 245,964 $ 342,698 $ 403,239 $ 385,822
GPC 2Q21 EARNINGS PRESENTATION | 26Reconciliation of Non-GAAP Financial Measures
Adjusted Gross Profit
Three Months Ended June 30, QTD Change
(in thousands) 2021 2020 $ Change % Change
GAAP Gross Profit $ 1,689,105 $ 1,290,487 $ 398,618 30.9%
Adjustments:
Transaction and other costs — 12,891 (12,891) (100.0)%
Total Adjustments (1) — 12,891 (12,891) (100.0)%
Adjusted Gross Profit $ 1,689,105 $ 1,303,378 $ 385,727 29.6%
Adjusted Gross Profit as a Percent of GAAP Net Sales 35.3% 34.1% 120 bps
Adjusted Tax Rate
Three Months Ended June 30,
(in thousands) 2021 2020
GAAP Income before taxes $ 269,607 $ (304,436)
Total adjustments (1) 77,421 555,525
Adjusted income before taxes $ 347,028 $ 251,089
GAAP Income taxes $ 73,111 $ 59,065
Tax impact of adjustments 21,322 1,500
Adjusted income taxes $ 94,433 $ 60,565
GAAP tax rate 27.1% -19.4%
Adjusted tax rate 27.2% 24.1%
(1) Refer to adjusted net income from continuing operations and adjusted diluted earnings per share from continuing operations reconciliation for explanation of pre-tax adjustments
GPC 2Q21 EARNINGS PRESENTATION | 27Reconciliation of Non-GAAP Financial Measures (Cont.) Appendix D
Adjusted Operating and Non-Operating Expenses
Three Months Ended June 30, QTD Change
(in thousands) 2021 2020 $ Change % Change
GAAP operating and non-operating expenses $ 1,419,498 $ 1,594,923 $ (175,425) (11.0)%
Adjustments:
Product liability damages award (77,421) — (77,421) 100.0%
Goodwill impairment charge — (506,721) 506,721 (100.0)%
Restructuring costs — (25,059) 25,059 (100.0)%
Realized currency loss — (11,356) 11,356 (100.0)%
Gain on insurance proceeds related to SPR Fire — 1,166 (1,166) (100.0)%
Transaction and other costs — (664) 664 (100.0)%
Less: Total Adjustments (1) (77,421) (542,634) 465,213 (85.7)%
Adjusted operating and non-operating expenses $ 1,342,077 $ 1,052,289 $ 289,788 27.5%
Adjusted operating and non-operating expenses as a percent of GAAP net sales 28.1% 27.5% 60 bps
(1) Refer to adjusted net income from continuing operations and adjusted diluted earnings per share from continuing operations reconciliation for explanation of pre-tax adjustments
GPC 2Q21 EARNINGS PRESENTATION | 28Reconciliation of Non-GAAP Financial Measures (Cont.) Appendix D
Free Cash Flow
(in thousands) TTM June 30, 2021
Net cash provided by operating activities $ 1,798,232
Less: Purchases of property, plant and equipment (169,137)
Free Cash Flow $ 1,629,095
Updated Outlook
YE December 31, 2021
Net cash provided by operating activities from continuing operations $1.2 billion to $1.4 billion
Purchases of property, plant and equipment Approximately $300 million
Free Cash Flow $900 million to $1.1 billion
GPC 2Q21 EARNINGS PRESENTATION | 29You can also read