Harrow Local Economic Assessment 2019 - 2020 Linkages and Flows - Harrow Council
←
→
Page content transcription
If your browser does not render page correctly, please read the page content below
Harrow Local Economic Assessment 2019 - 2020 Linkages and Flows
Linkages and Flows

Harrow Local Economic Assessment 2019 - 2020   2

Linkages and Flows

Economic Linkages

Economic linkages between Harrow and surrounding areas help to strengthen the economic
sustainability of the borough by giving the borough a competitive advantage. On an individual company
basis, the greater the linkages to the local economy (e.g. through supply chains), the greater the
company is embedded within the local economy.

3.1     The London Borough of Harrow is located in the north-west of London and is served by the M1
motorway to the north-east, linking the borough with the north of the country and the M4 and A40/M40
motorways to the south providing access to the west. Harrow in unique in London having no roads that
are part of the Transport for London Road Network (TLRN) but is still well connected to London's
strategic road network, the M25, the major orbital route to the north and west and the A406 North
Circular Road to the south-east as well as other major routes the A1 and A41.

3.2     Harrow Metropolitan Centre, Wealdstone District Centre and the corridor linking the two centres
forms an Opportunity Area for regeneration and intensification of employment as identified by the
Greater London Authority (GLA), one of the key targets is to provide 3,000 new jobs by providing the
opportunity for new businesses to move to the area or for existing business to expand through policies
within the Harrow Local Plan.

3.3     Surveys of businesses in the borough have shown that many of the larger businesses do not
have significant local supply chains. Similarly many small businesses locate in Harrow for convenience,
rather than any obvious competitive advantage.

Transport Connections

The efficiency and reliability of the transport network in Harrow and West London as a whole is important
for both businesses and individuals.

Congestion remains a significant issue for many road users in West London and Harrow, especially
those travelling east-west, affecting journey times and journey time reliability. With demands on both
public transport and the road system projected to increase, reliability and resilience to disruption are
likely to suffer without continued investment and action.

3.4       The need to encourage the use of modes of transport other than the car presents Harrow with
one of its biggest challenges. Environmental pollution as a result of road traffic, traffic congestion and the
prevention of accidents are all serious concerns within the community, and can significantly affect quality
of life. The transport policies in the Harrow Local Plan aim to bring about a reduction in road traffic
(especially car traffic) and create a genuine choice of travel modes.

3.5      Four London Underground lines serve Harrow: the Metropolitan, Bakerloo, Jubilee and Piccadilly
lines; in addition the Edgware branch of the Northern line runs close to the eastern borough boundary
and the London Overground network provides services in the borough which supplement the Bakerloo
line. Mainline rail services connect the borough to London termini at Marylebone and Euston, and to
Clapham Junction, Watford Junction, Aylesbury and Milton Keynes.

3.6      The London Mayor’s Transport Strategy 2018 (MTS) outlined plans to upgrade the deep tube
network, which includes the Bakerloo Line, from 2025 onwards. This upgrade is intended to extend the
line in southeast London and increase capacity through new rolling stock and more trains. Funding for
this upgrade/extension is not currently committed. Replacement of current rolling stock which dates from
1970s is a priority as it causes reliability issues and delays (the trains share the same tracks as the
London Overground service until Queens Park Station, so train issues on the Bakerloo Line can
immediately impact London Overground services).

3.7     There is a planned upgrade to the Bakerloo Line, which has the oldest rolling stock on the whole
of the London Underground network, (scheduled to follow behind the Piccadilly Line upgrade) and a 25%

Harrow Local Economic Assessment 2019 - 2020          3
Linkages and Flows

capacity enhancement is envisaged as a result. Currently over 70% of trains from Central London are
turned around at Queens Park Station and so do not reach Harrow & Wealdstone Station.

3.8     London Overground services were due to be upgraded in Summer 2019. Delay to the delivery of
the new class 710 trains meant that the four train per hour frequency service was only fully delivered in
November 2019. This currently operates with a mixture of new and old rolling stock. The new frequency
runs throughout the day on the ‘stopping’ service between Watford Junction and Euston, calling at
Harrow & Wealdstone Station. In addition to the Metropolitan Line, Harrow-on-the-Hill Station is also
served by Chiltern Railways' mainline services from Aylesbury to London Marylebone.

3.9     Harrow & Wealdstone Station is not only served by the Bakerloo Line and London Overground
but also by London Northwestern and Southern Rail services. The Southern Rail service essentially
provides an hourly service south to Clapham Junction and East Croydon, through Shepherds Bush and
north to Milton Keynes, with one additional service in the am & pm peaks (two additional in the morning
southbound in a three hour period). There is strong demand for more frequent services, possibly coupled
with connection to a future West London Orbital line. The London Northwestern Rail service essentially
provides a half hourly fast service into London Euston and northwest to Tring, being a stopping service
beyond Watford Junction.

3.10 Apart from the Southern Rail service towards East Croydon and Clapham Junction, all train
services connect essentially radially with Central London. Away from London there are regular direct
services to Aylesbury (Chiltern Line ); Amersham, Chesham, Uxbridge & Watford (Metropolitan Line);
Tring (London Northwestern); Milton Keynes (Southern); Watford Junction (London Overground) and
Uxbridge (Piccadilly Line).

3.11 Whilst connectivity along these radial services routes is good, rail connections to other West
London destinations, usually requires travel via Central London and/or multiple changes. Prospect of
some limited improvement may be achieved via the proposed West London Orbital (WLO), a line
currently used by rail freight. These proposals, which are under discussion between the boroughs, West
London Alliance and Transport for London(TfL), connect Hendon through Old Oak Common (area)
towards Hounslow, but offer no direct connectivity for Harrow nor to other destinations in West and
South West London. An enhanced WLO potentially could provide direct connectivity from the borough
and onto Ealing and Heathrow using existing freight links.

3.12 In 2017 following many years of lobbying, TfL formally announced that Harrow-on-the-Hill Station
will have step free access. Subsequently enabling works started on site in 2019 with an expected
completion date of late 2020. Four lifts are being installed at the station providing access to all platforms
from College Road (Town Centre side). A fifth lift would be added and constructed as part of the
proposed TfL housing development if and when approved. The housing development plans are currently
being reworked by TfL.

3.13 In addition to Harrow-on-the-Hill Station, Sudbury Hill (Piccadilly Line) Station is also on the
current phase of the step free access programme. Construction works started in late 2019 with expected
completion due in 2020. At Stanmore Station, where there is currently substandard step free access (via
the car park and vehicle ramp), there are TfL development proposals which would see a lift constructed
within the development. The Council continues to lobby for step free access at other stations in the
borough, in particular at Rayners Lane Station.

3.14 A network of cycle routes provides a total of 41 km of cycle lanes in the borough, around 10% of
the total Harrow road network. There are 37 bus routes, including five night bus services serving areas
within the borough and links to neighbouring boroughs, however Harrow Bus Station is operating over
capacity (Harrow Transport Local Implementation Plan 2019/20 - 2021/22).

3.15 Harrow's Local Implementation Plan maintains a commitment that the council will work with
Transport for London (TfL) to improve orbital bus links. The council has continued to lobby TfL to
improve orbital bus connections. At the present time however no new orbital bus routes serving Harrow
are planned or have been established. However, the 140 bus route which runs between Harrow Weald

Harrow Local Economic Assessment 2019 - 2020          4
Linkages and Flows
and Heathrow has seen an increase in frequency and new stock. The bus stop accessibility programme
is seen as a crucial element in the drive to improve the quality of bus services. Currently Harrow is 98%
compliant and is one of only a few London boroughs with such a high percentage of compliant bus stops.
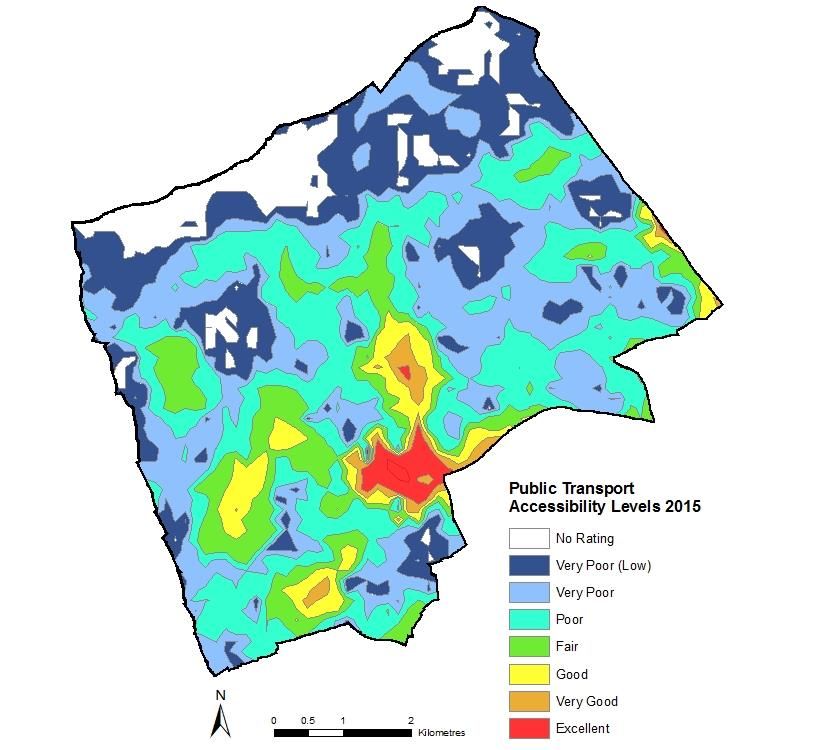
3.16 The areas immediately around Harrow-on-the-Hill Station and Harrow & Wealdstone Station have
the best Public Transport Accessibility Levels (PTALs), as these stations are Harrow's main transport
hubs, both served by the underground and mainline rail services (Map 3.1).
Map 3.1: Public Transport Accessibility Levels (PTALs)
Source: Public Transport Accessibility Levels, 2015, Transport for London
© Crown copyright. All rights reserved 100019206, 2020
3.17 The latest available data shows that the borough-wide average Public Transport Accessibility
Level (PTAL) score for Harrow was 2.87 in 2014, reflecting its geographical location as an Outer London
borough. This is significantly lower than the Inner London borough average of 4.9 and slightly lower than
the average 3.04 for the Outer London boroughs. This average PTAL score for Harrow ranks it the sixth
lowest among the 33 London boroughs behind Hillingdon, Havering, Bexley, Bromley and Sutton.1
1
https://data.london.gov.uk/dataset/london-borough-profiles
Harrow Local Economic Assessment 2019 - 2020 5Linkages and Flows
3.18 The most recent information available on car ownership is still the 2011 Census which showed
that car ownership levels in Harrow were higher than the national average and the fifth highest level in
London. Nearly one-third of households in Harrow had two or more cars, which was the third highest
level in London. Car ownership levels, in 2011, were lowest in the central wards of Greenhill,
Marlborough and Wealdstone along with Roxbourne in the west of the borough. These wards are
regarded as the borough's most deprived wards (MHCLG, Index of Multiple Deprivation, 2019). Whilst
the PTAL scores are 'excellent', 'very good' or ‘good’ in the central wards, some of the lowest PTAL
scores are in Roxbourne which has the highest concentration of social rented housing in the borough.
Roxbourne which contains the recently rebuilt Rayners Lane Estate, the largest social rented housing
estate in the borough, had a total of 1,154 social rented dwellings (235 per 1,000 dwellings) in 2018.
Travel to Work Patterns
Being an Outer London borough, it is recognised that a significant proportion of residents will commute
out of the borough for work. However, a choice of employment opportunities needs to be maintained
within the borough for a number of reasons, including to help maintain work/life balance for Harrow
residents, and to reduce the need to travel.
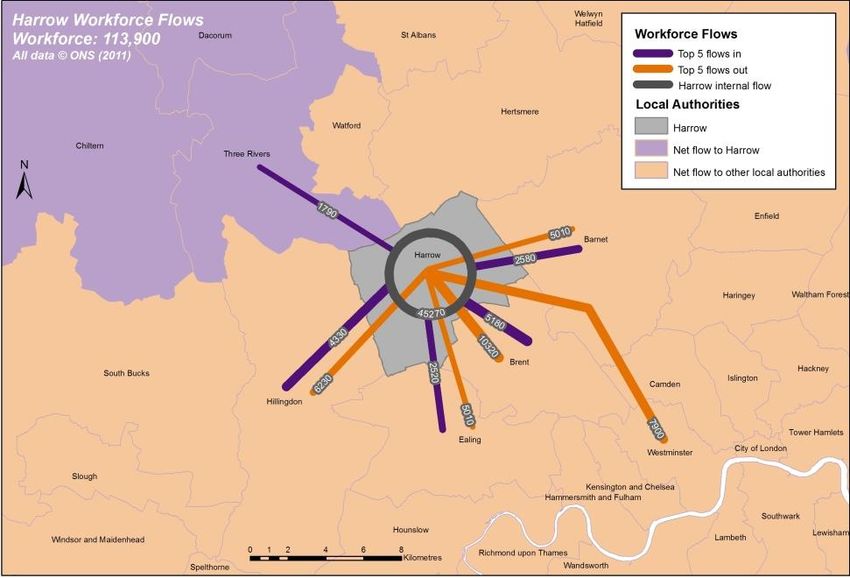
Map 3.2: Key Harrow Workforce Flows
Source: Census 2011, ONS
© Crown copyright. All rights reserved 100019206, 2020
3.19 The most recent travel to work data available is from the 2011 Census and provides an indication
of the areas where Harrow residents went to work and where other workers travelled from, to work in
Harrow. Map 3.2 shows the areas with the five highest workforce flows both into and out of Harrow.
3.20 From 2001 to 2011 the number of Harrow's working residents (aged 16 to 74) increased by
nearly 17%, from around 97,400 to 113,900. The 2011 Census showed that around 40% of Harrow’s
residents worked within the borough, a 1.4% increase from 2001. A further 23% worked in the
Harrow Local Economic Assessment 2019 - 2020 6Linkages and Flows
neighbouring London boroughs of Brent, Hillingdon, Barnet and Ealing (Table 3.1). 22% of Harrow's
workers commuted to the Inner London boroughs2, taking advantage of Harrow's good radial public
transport links into Central London. Whilst this was roughly the same proportion of workers as in 2001,
this represents a 16.5% (3,600) increase in numbers over the decade. The number of Harrow's workers
employed in the City of London and Westminster rose slightly over the decade - from just over 11,000 to
11,800 in 2011. The percentage working in Tower Hamlets (including Canary Wharf) more than doubled
from 2001 to 2011 and there was a 50% increase in the number working in Southwark, which benefited
from new employment opportunities, particularly at London Bridge City which is situated between
London Bridge and Tower Bridge on the south side of the River Thames. These locations are both easily
accessible to Harrow's residents, due to the extension of the Jubilee Line and it is likely that there were a
higher proportion of well paid jobs in these areas.
3.21 Perhaps the most significant change in commuting patterns lies with the percentage of Harrow
residents working from home, which increased from 5.1% to 10.2% over the ten year period. There were
numerous technological advances over the decade, with the introduction of video conferencing (using
Skype) and the development of the internet, allowing people to access work files from home, thereby
leading to a 20% increase in the number of residents working from home between 2001 and 2011 and
therefore cutting down on commuting.
Table 3.1: Place of Work for Harrow Residents - Age 16-74 (out-flows)
2001 2011
Rank Location
Number % Number %
1 Harrow 22,670 23.3 21,320 18.7
2 No fixed workplace 9,640 9.9 12,380 10.9
3 Working mainly at or from home 5,010 5.1 11,570 10.2
4 Brent 9,470 9.7 10,320 9.1
5 Westminster 7,890 8.1 7,900 6.9
6 Hillingdon 6,170 6.3 6,230 5.5
7 Barnet 5,010 5.1 5,010 4.4
8 Ealing 4,540 4.7 5,010 4.4
9 Camden 3,680 3.8 4,120 3.6
10 City of London 3,160 3.2 3,860 3.4
11 Watford 2,070 2.1 2,360 2.1
12 Tower Hamlets 1,010 1.0 2,180 1.9
13 Hammersmith & Fulham 1,470 1.5 1,980 1.7
14 Hertsmere 1,530 1.6 1,700 1.5
15 Islington 1,390 1.4 1,630 1.4
16 Hounslow 1,130 1.2 1,490 1.3
17 Three Rivers 930 1.9 1,360 1.2
18 Kensington & Chelsea 1,160 1.2 1,310 1.1
19 Southwark 850 0.9 1,260 1.1
20 Lambeth 490 0.5 650 0.6
Source: 2011 Census Table WU02EW & 2011 Census Table TT010, ONS, Crown copyright
3.22 Comparisons with the 2001 Census (age 16-74) showed an overall 6% increase in the number of
people working in the borough to 2011. However, when people working at home, or having no fixed
address are excluded, the data showed a fall of over 2,800 potentially working in business premises in
the borough. In terms of the people who worked in Harrow, a significant number of people commuted
into the borough from elsewhere - just under 20% of Harrow's jobs were filled by residents from the
adjacent London boroughs of Hillingdon, Brent, Barnet and Ealing. Overall from 2001 to 2011, there was
a 5% decrease in residents commuting into the borough (Table 3.2). The 2011 Census showed that
flows from Harrow into neighbouring Hertfordshire slightly exceeded flows from Hertfordshire to Harrow,
with 7,180 people commuting to Hertfordshire and 6,230 travelling into Harrow.
2
The Inner London authorities are: City of London; Camden, Greenwich, Hackney, Hammersmith & Fulham,
Islington, Kensington & Chelsea; Lambeth; Lewisham; Southwark; Tower Hamlets; Wandsworth and Westminster
Harrow Local Economic Assessment 2019 - 2020 7Linkages and Flows
Table 3.2: Place of Residence for Harrow Workers - Age 16-74 (in-flows)
2001 2011
Rank Location
Number % Number %
1 Harrow 22,670 27.6 21,320 28.9
2 No fixed workplace 9,640 11.8 12,380 16.8
3 Working mainly at or from home 5,010 6.1 11,570 15.7
4 Brent 5,110 6.2 5,180 7.0
5 Hillingdon 4,680 5.7 4,230 5.9
6 Barnet 2,620 3.2 2,580 3.5
7 Ealing 2,590 3.2 2,520 3.4
8 Three Rivers 1,910 2.3 1,790 2.4
9 Hertsmere 1,540 1.9 1,550 2.1
10 Watford 1,500 1.8 1,410 1.9
11 Dacorum 810 1.0 550 0.7
12 St Albans 510 0.6 430 0.6
Source: 2011 Census Table WU02EW & 2011 Census Table TT010, ONS, Crown copyright
3.23 A high proportion of Harrow's working residents travel to work by car. The 2011 Census showed
that just over 42% of Harrow's residents travelled by car or van to work, higher than the West London
average of 35.2% and London's level of 28%. Over 45,500 residents drove their car or van to work, with
over 77% of these commutes made to workplaces outside the borough. In addition 17,300 workers
travelled to work in Harrow, from places outside of the borough.
Trading Links and Movement of Goods and Services
3.24 Harrow Council has the distinction of being one of the first two London boroughs to be awarded
the Freight Operators Recognition Scheme (FORS) Silver Accreditation by TfL. FORS is an accreditation
scheme that aims to improve fleet activity in London and throughout the UK and beyond.
3.25 There are relatively low levels of movement of road freight through the borough compared to the
rest of West London and this mainly serving local destinations and businesses. Most of West London's
road freight is transported through the strategic M1/A406/A40/M4 corridors, all which lie outside the
borough boundary.
3.26 In 2012 Harrow introduced a borough freight strategy. This enabled the borough to prevent some
heavy goods vehicles from cross cutting through local roads in the borough as a shortcut to reach
destinations beyond Harrow. This significantly reduced heavy goods vehicles misusing local roads in the
borough. The borough will continue to consider introducing an enforcing weight restrictions and road
width restrictions to prevent the misuse of roads by inappropriate vehicles. Harrow supports the London
Lorry control Scheme (LLCS) which controls the movement of heavy goods vehicles over 18 tonnes. The
LLCS operates at night and at weekends on specific roads in London helping to minimise noise pollution.
In 2019/20, the borough will work to implement a revised freight strategy.
3.27 In order to encourage and assist the transportation of freight in Harrow a number of schemes are
being introduced, such as working with GPS providers to ensure that freight routes are appropriately
guided within the borough avoiding residential areas and reducing the impacts and conflicts with other
modes of transport, for example bus and cycle lanes. Periodically review the provision in town centres
and the Harrow & Wealdstone Opportunity Area for all aspects of servicing, delivery, loading/unloading
and freight movement as well as the provision of public electric charging points across the borough.
Harrow Local Economic Assessment 2019 - 2020 8You can also read